 fl@C@
fl@C@
Be sure to check out the bio that Hackaday.com did on me!!
ST Micro gave me a shoutout on their Facebook page!
The great people over at RaspberryPi.org did a wonderful article on ramanPi!
Some kind words from the folks at 3ders.org too!
Thanks to Elecia and Chris White at embedded.fm for the great podcast interview!
Follow me on twitter too! I'll be tweeting on gitHub updates as well as from here!
Index of Instructions and Informational project logs:
- Information: controlBoard Schematic and Firmware
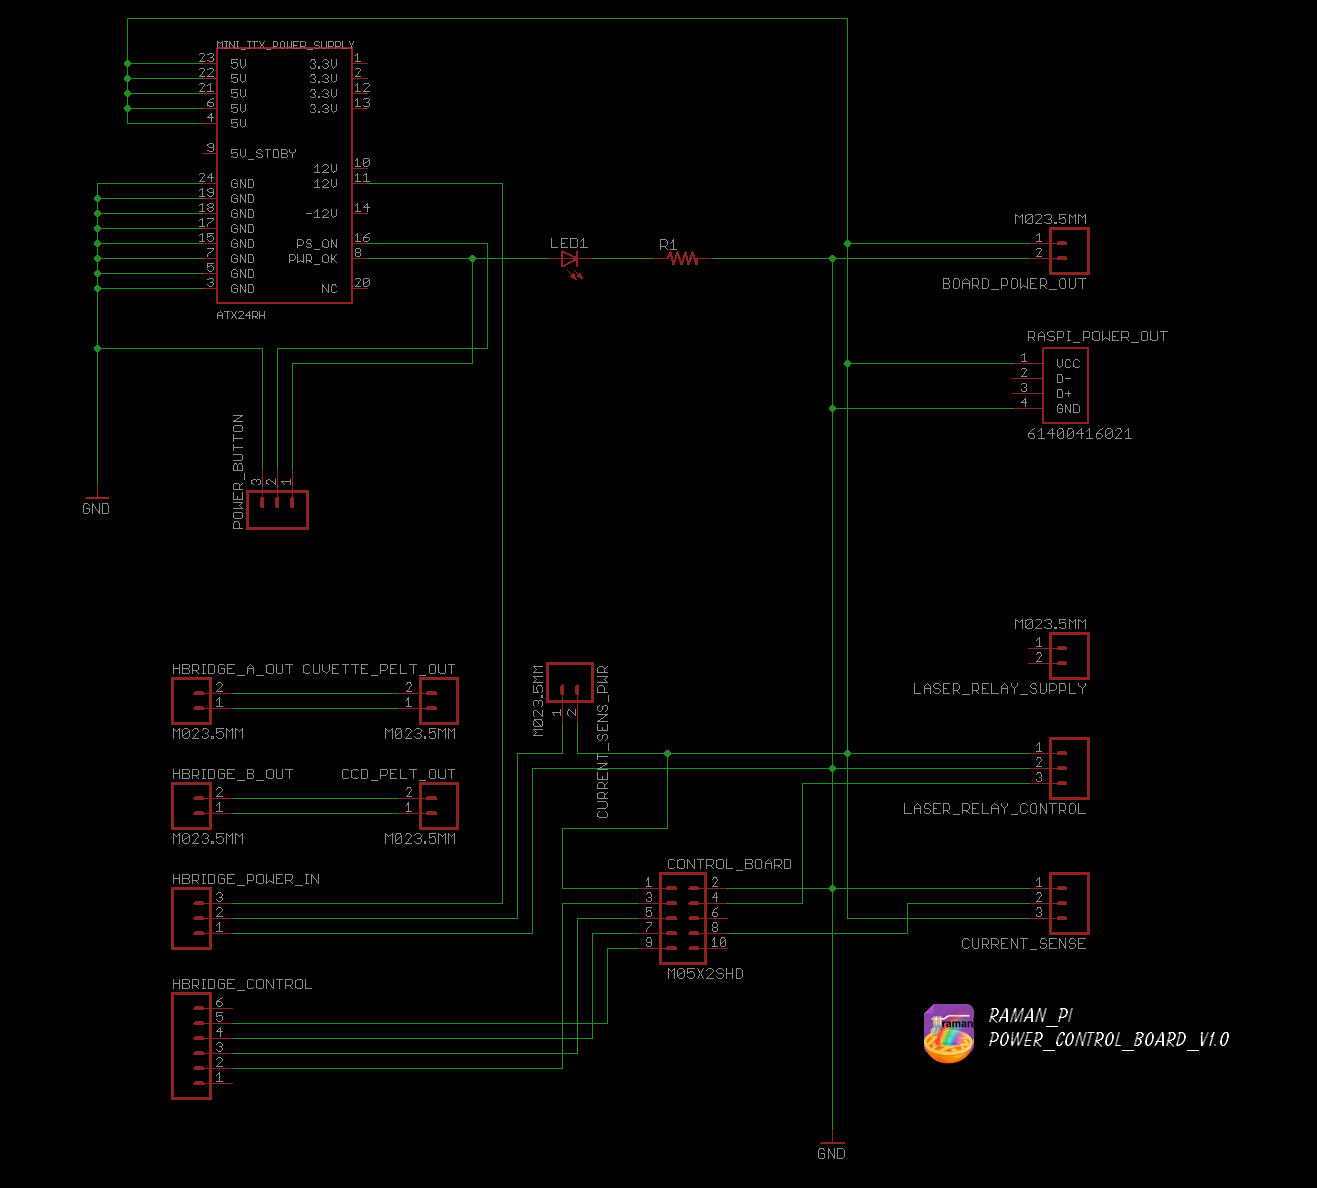
- Information: powerControlBoard Schematic
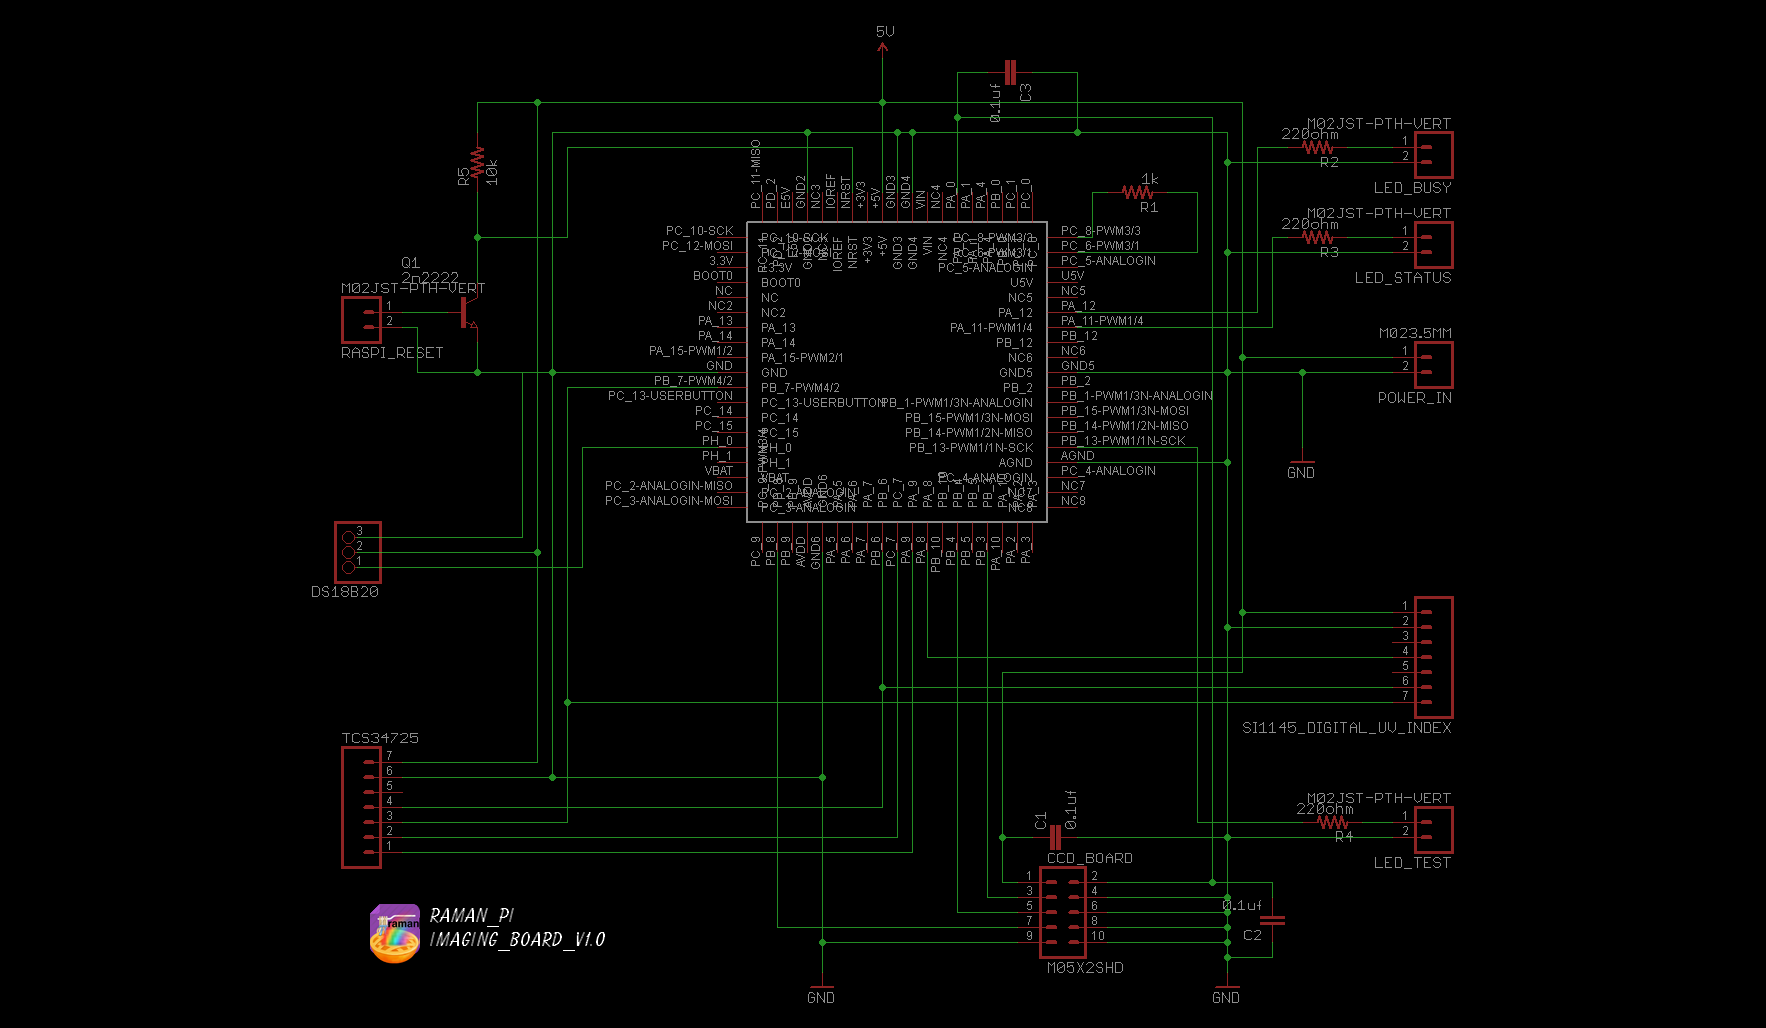
- Information: imagingBoard Schematic and Firmware
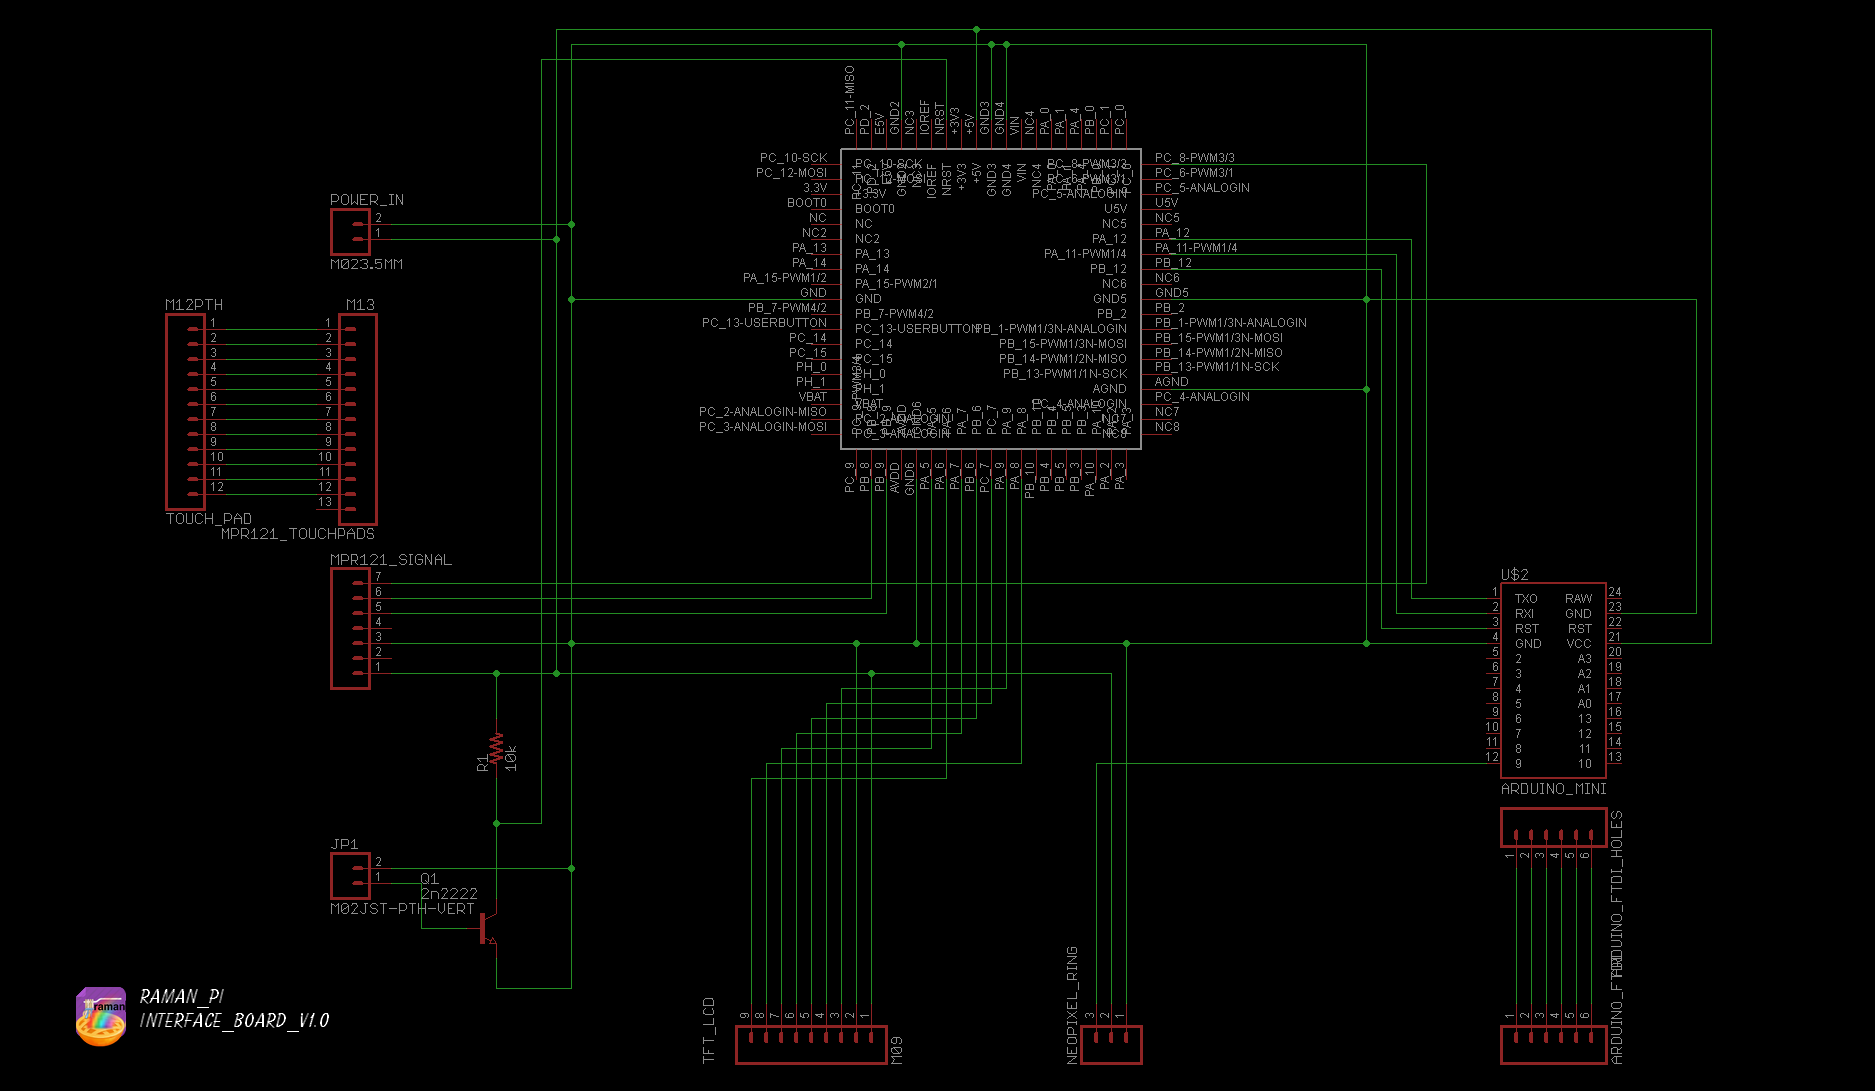
- Information: interfaceBoard Schematic and Firmware
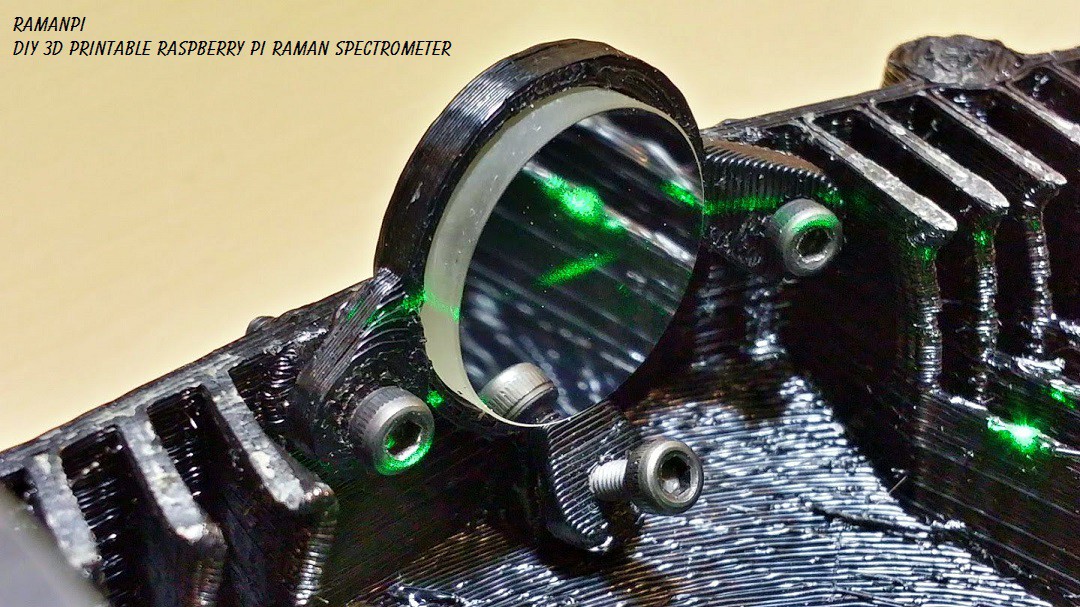
- Build Instruction: Objective Lens Mount
- Build Instruction: Beam Splitter Assembly
- Build Instruction: Laser Shutter Assembly
- Build Instruction: Mirror Mount Assembly
- Build Instruction: Laser Emitter Assembly
- Build Instruction: Filter Selector Assembly
- Build Instruction: Spectrometer
- Alignment Instruction: Spectrometer
- Build Instruction: Optical Assembly
- Build Instruction: TFT LCD and Touch Panel

THP Semifinals Video
You can also view the project log with this video that includes a full transcript HERE ...


A bench top, raman spectrometer constructed from very easy to source components and 3D parts printable on even entry level printers. My system is a completely unique innovative design in the world of raman spectroscopy and has many advantages beyond the fact it can be constructed for a tiny fraction of the cost of a used commercial system, which can cost tens of thousands of dollars! My system connects to multiple internet databases to retrieve spectral data to identify chemical compounds under test. It is completely scalable to fit almost any budget... Many of the components can be used for other purposes outside this system or project. It presents a great learning experience for anyone who is interested in electronics, science, physics, lasers, chemistry, and so on..!
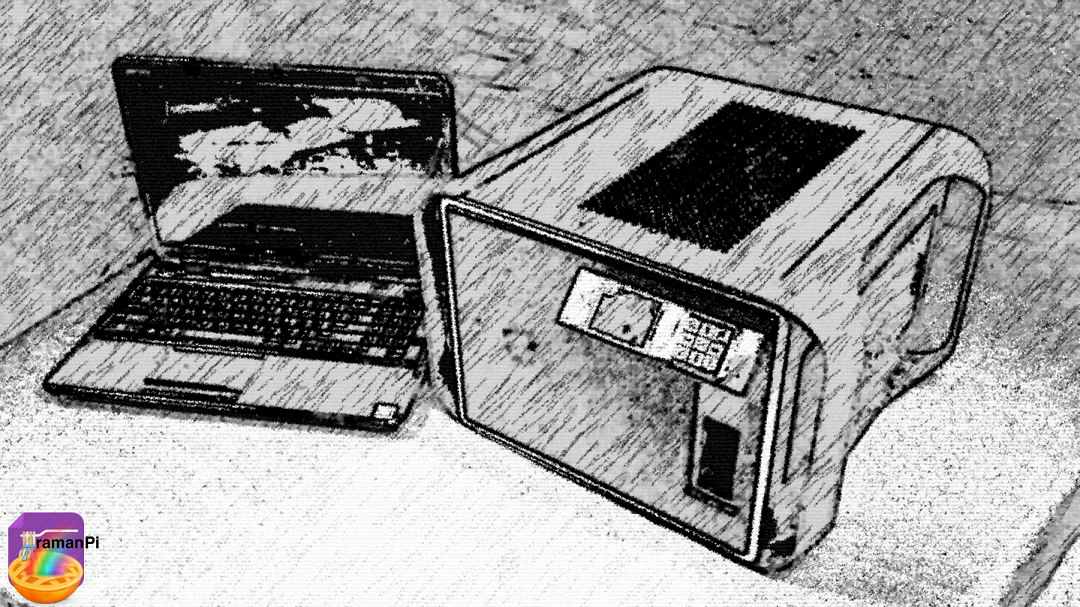
Artists Rendition:
|
|


A description from Omega Filters ( http://www.omegafilters.com/Capabilities/Applications/Raman_Spectroscopy/Raman_General ) Describes raman spectroscopy as follows;
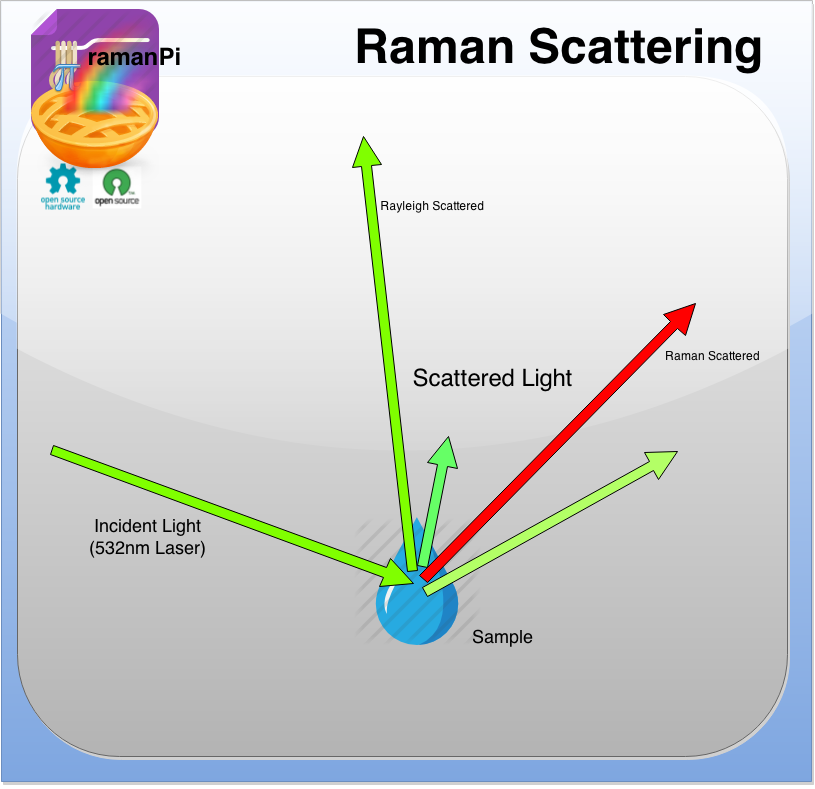
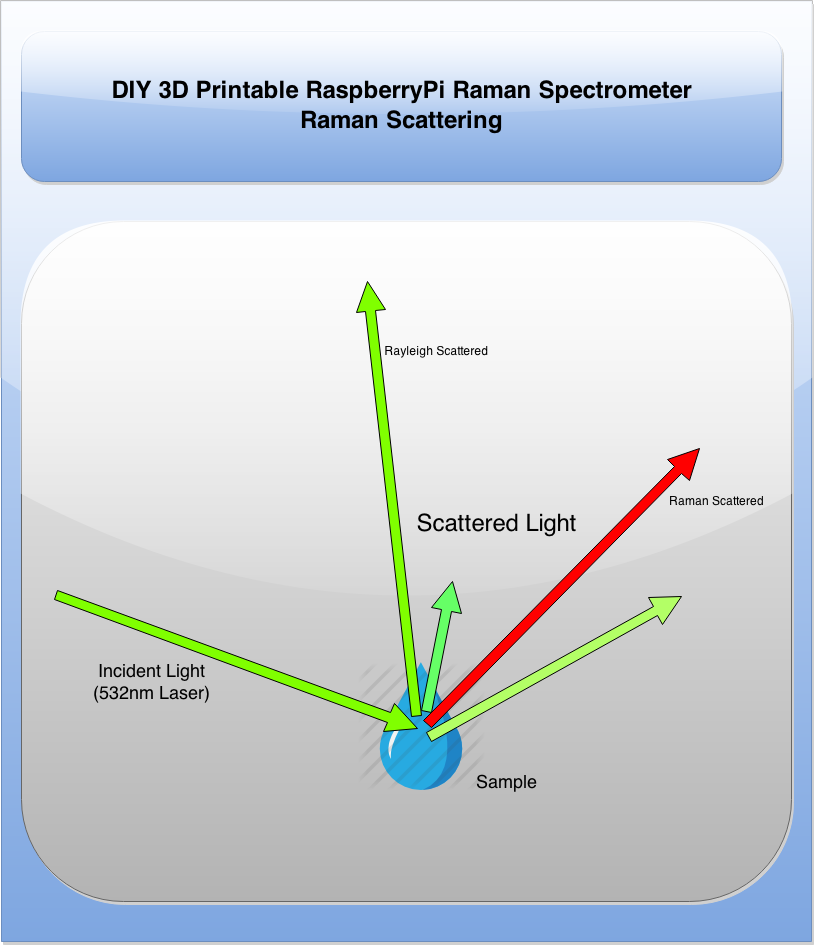
Raman spectroscopy provides valuable structural information about materials. When laser light is incident upon a sample, a small percentage of the scattered light may be shifted in frequency. The frequency shift of the Raman scattered light is directly related to the structural properties of the material. A Raman spectrum provides a "fingerprint" that is unique to the material. Raman spectroscopy is employed in many applications including mineralogy, pharmacology, corrosion studies, analysis of semiconductors and catalysts, in situ measurements on biological systems, and even single molecule detection. Applications will continue to increase rapidly along with further improvements in the technology. A Raman signature provides positive material identification of unknown specimens to a degree that is unmatched by other spectroscopy's. Raman spectroscopy presents demanding requirements for the detection and resolution of narrow-bands of light with very low intensity and minimal frequency shift relative to the source.
Raman spectroscopy is something very cool to behold, and imagine.. The idea that shining a light on a sample will yield data as to its composition and vibrational state is nothing short of amazing.. And this open source system delivers all of that within reach of whomever wants it now.. Something that was not possible before.
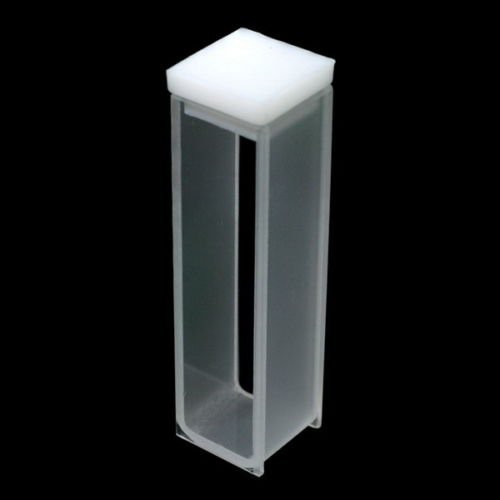
Imagine the keyboard in front of you... It is made of several elements...it's probably plastic, some metal, some silicon, and so on... Now imagine a glass of water, a tasty beverage or your favorite soft drink.. So now let's ask what's in that glass...you probably know there's a bit of water, and a lot of other components.. What if you look at that tasty beverage, and want to find out what chemical compounds are in it.. So take a sample of it, and put it into a 'cuvette' which is a fancy tiny test tube of sorts.. Then insert that into our Raman Spectrometer.. Then run an analysis on it and bam! You can see that your tasty beverage has C2H6O, carbon dioxide, water, etc..

Use it to determine any number of things.. Sort your sand collection based on the composition of silica (SiO2) and other materials(meant as a joke but you could if you really wanted to)! Or determine what kind of plastic or metal or ceramic or glue was used to make something... How fresh is your food? What happens to this material when I do this? Do a before and after analysis and find the raman shift!


You!! And literally everyone.. Schools, teachers, small businesses, hackers, hackerspaces, research scientists, chemists, biologists, cancer researchers, STEM advocates, average citizens who want to test their water, people who are interested in finding things out like what is in your favorite energy drink....people who have a taste for learning and experiencing the world! This is literally a tool that every hacker and hackerspace should have..

A lot can be said in this section... I'll boil it down to this... Basically, it works by shining a really bright laser through some optics to focus down to a sample...That laser light then hits the sample, and depending on the molecules it hits, and what they're doing...the light can be shifted up or down in color.. Some of that light, and some of the laser light is reflected back into the optics and is reflected through a couple of filters that removes the laser light completely..leaving only the shifted light from the sample.. That light is bounced off of a 'diffraction grating' which is sorta like a prism.. The light is separated and projected onto a camera(ccd) which takes an 'image' of the spectra. The computer analyzes that and compares it to a couple of online databases, then comes back and tells you what's in your tasty beverage on a very easy to read and intuitive interface!
Lasers + tasty beverages = Fun....no?
This entire process is based on an open source concept that side steps the expensive optics normally required for raman spectroscopy. Ordinarily, an expensive notch filter would be used which is cost prohibitive for most average people. My system avoids this cost by using two less expensive edge filters which when combined in the correct manner provide the same benefit as the notch filter...at the minimal cost of a little extra computing time.

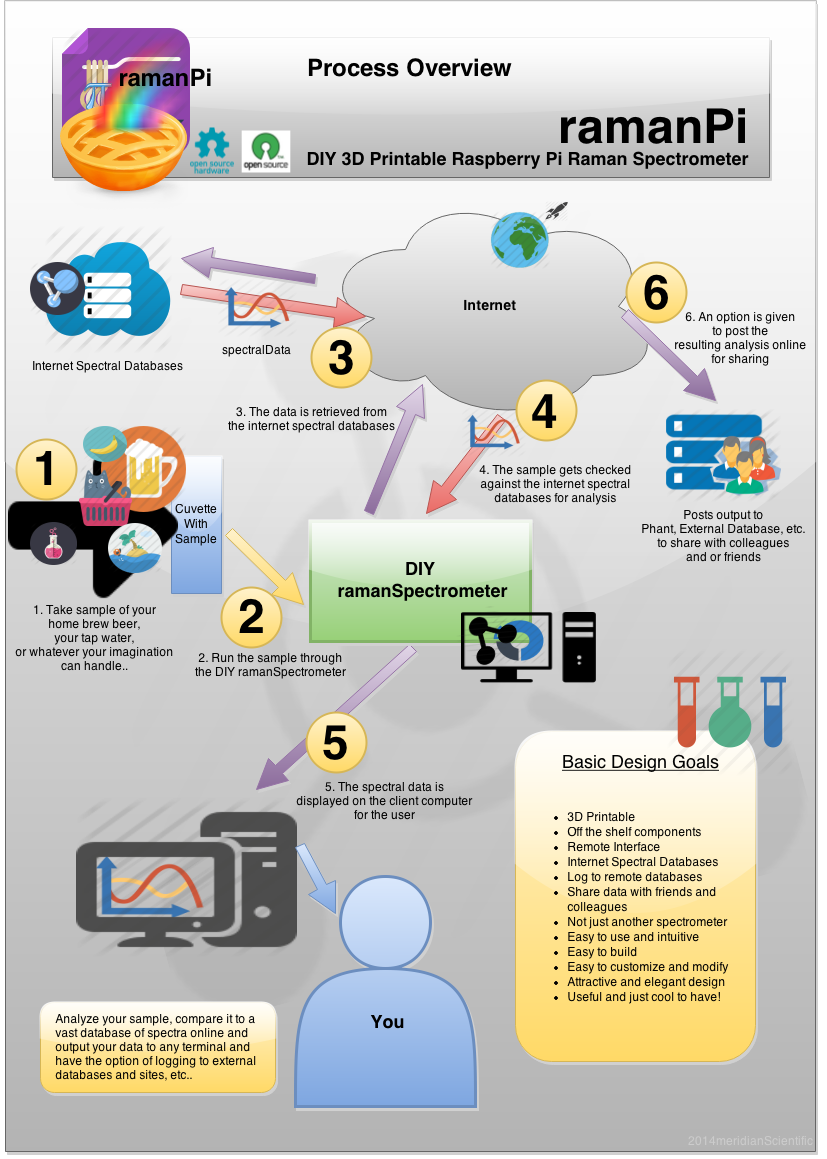
Start off by putting a sample in the cuvette.. Insert the cuvette into the DIY 3D Printable Raman Spectrometer, run the analysis.....the data is retrieved from the internet spectral databases, a match is found...that match is displayed on the users remote terminal... You can store that data in an external database, share it online, or do what you please with it..

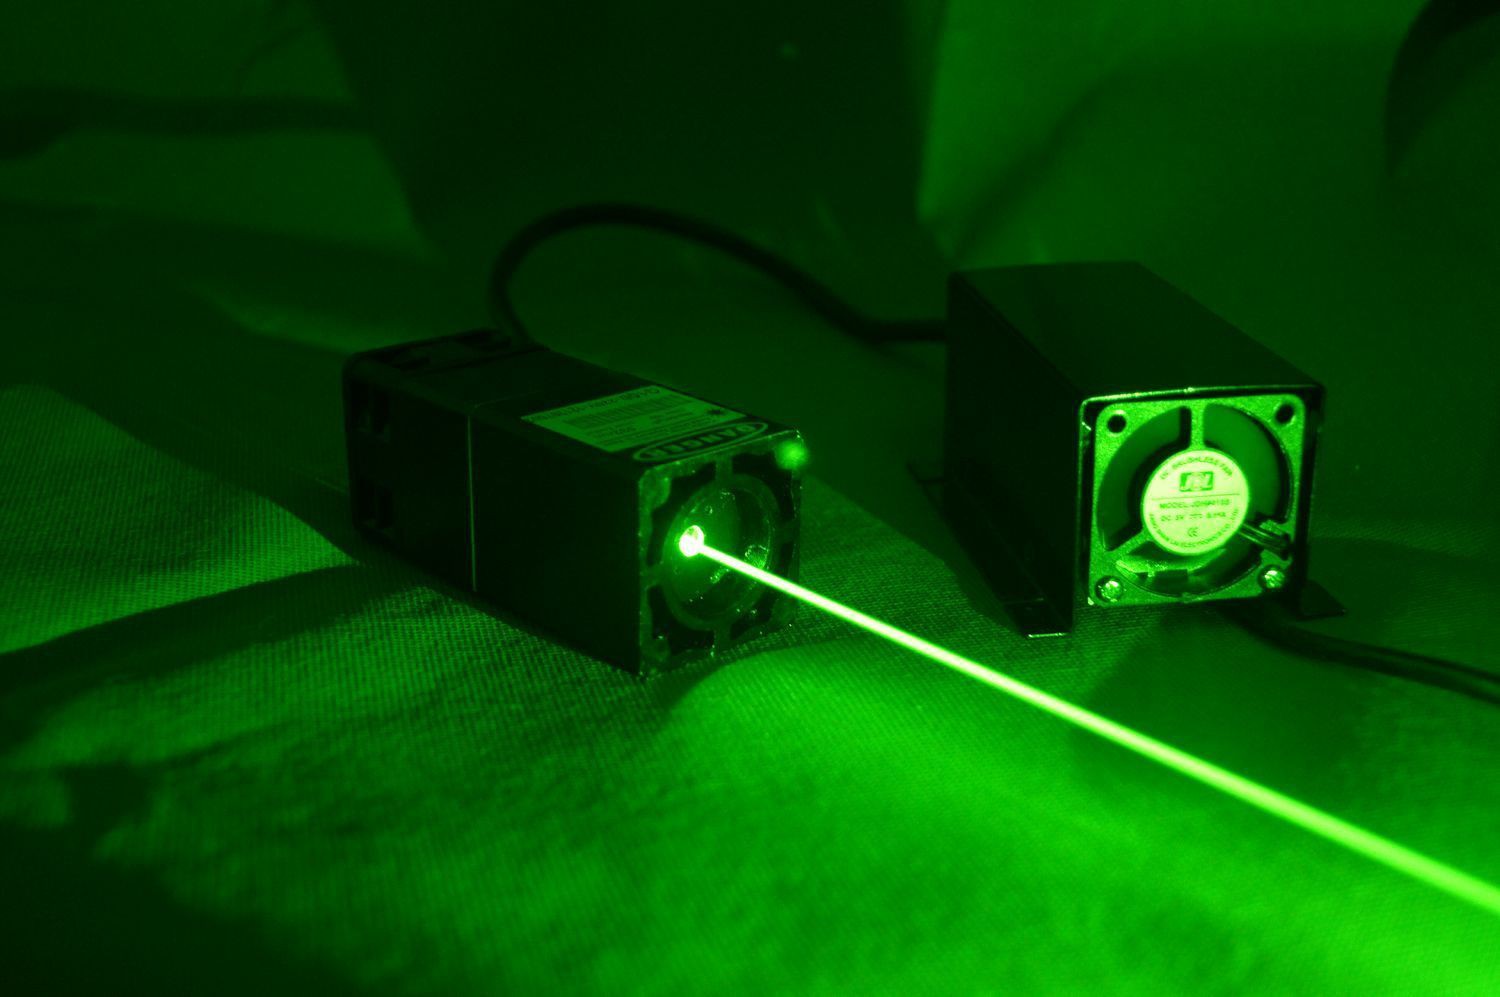
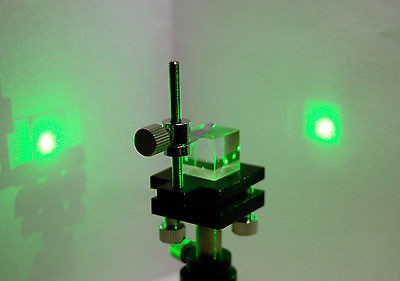
An early laser alignment test.
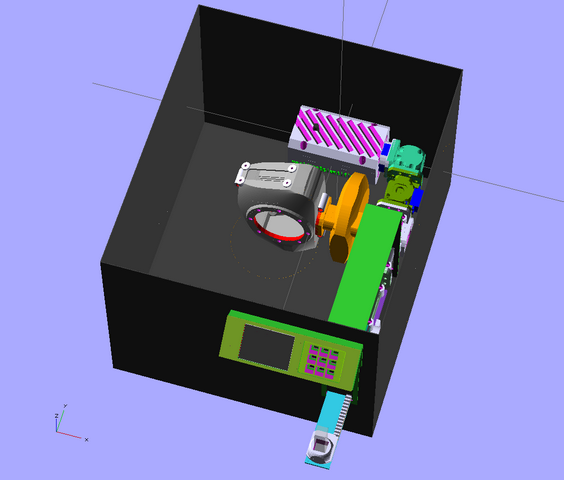
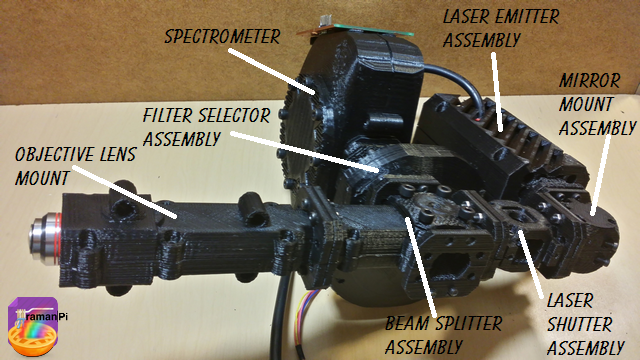
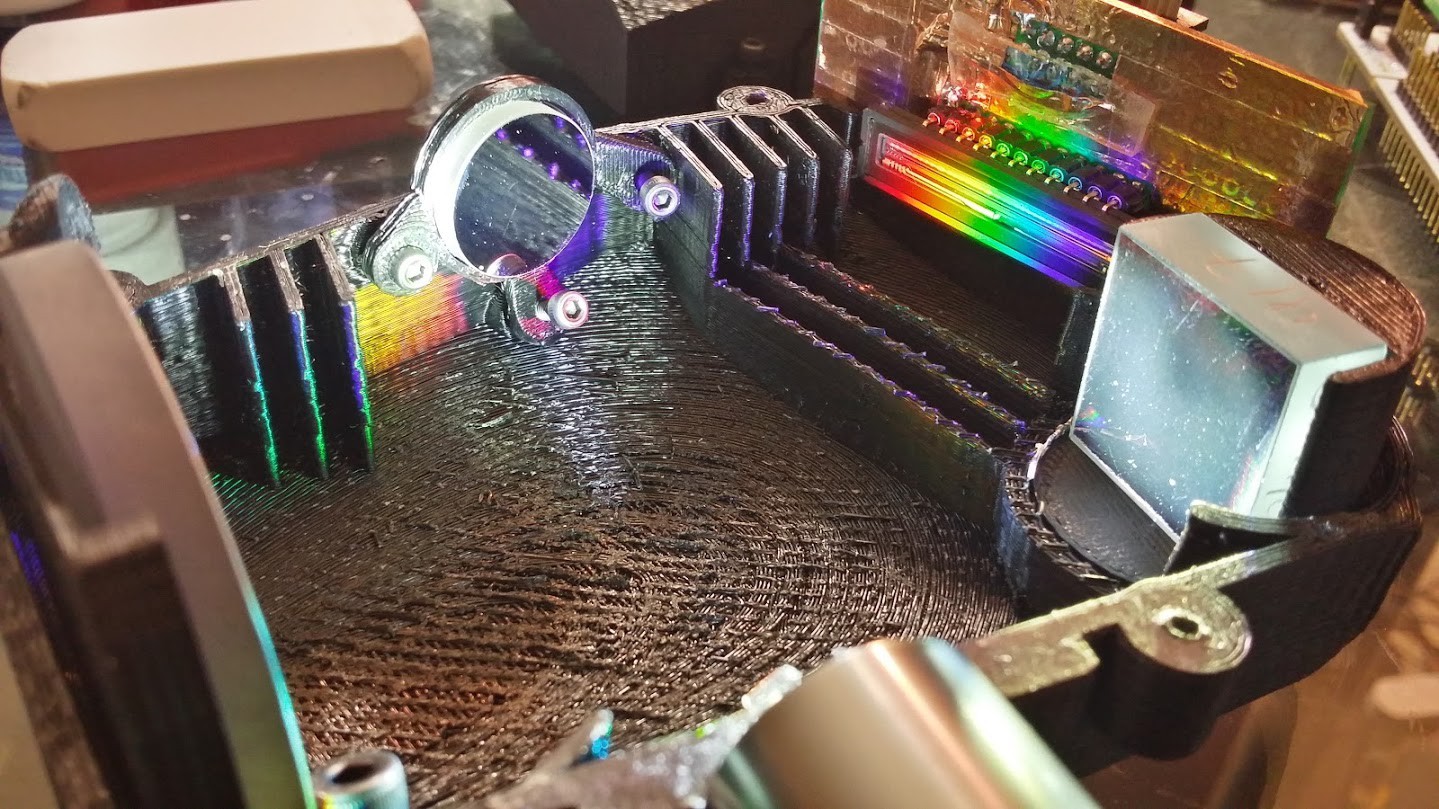
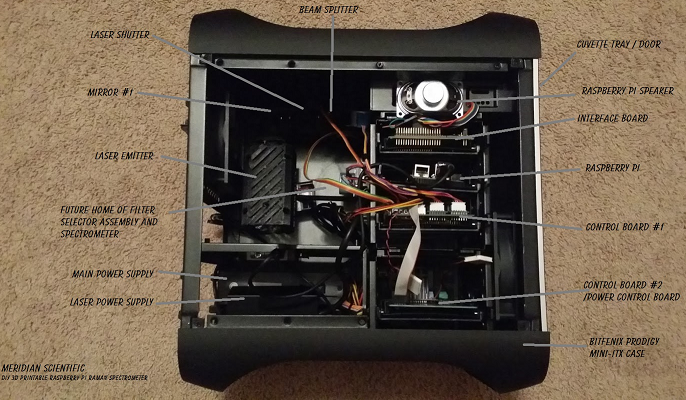
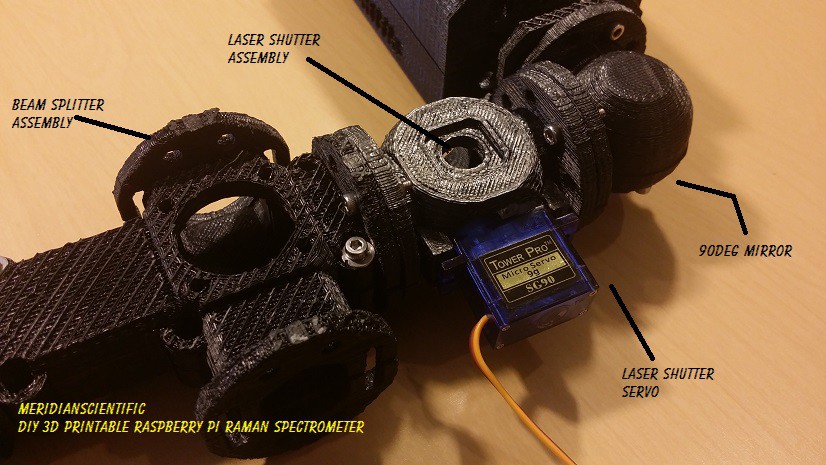
The majority of the raman portion of the system. Includes the laser emitter, mirror, shutter, splitter, objective lens, and filter wheel assembly.. Missing are the spectrometer and beam dump.
The actual raman portion of the system.
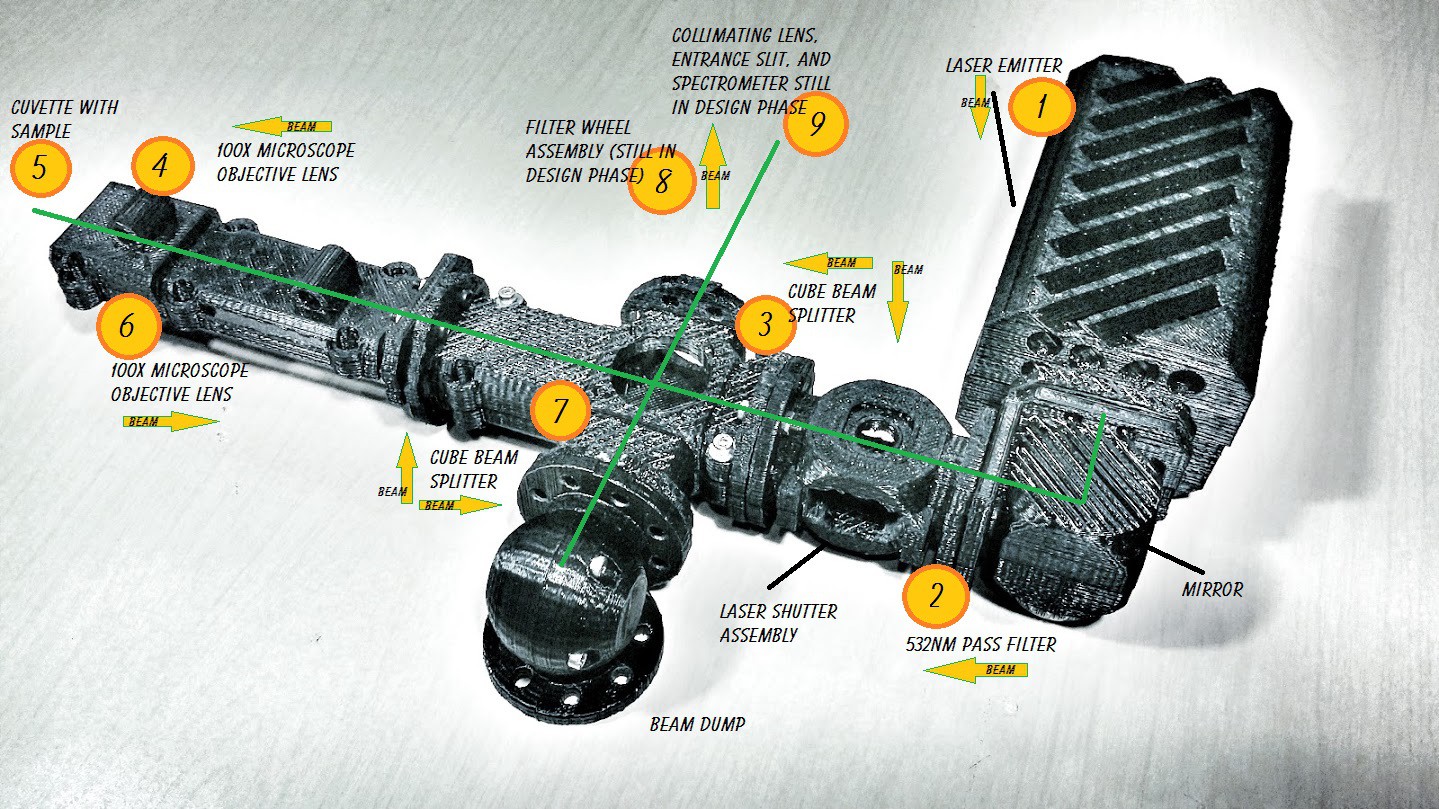
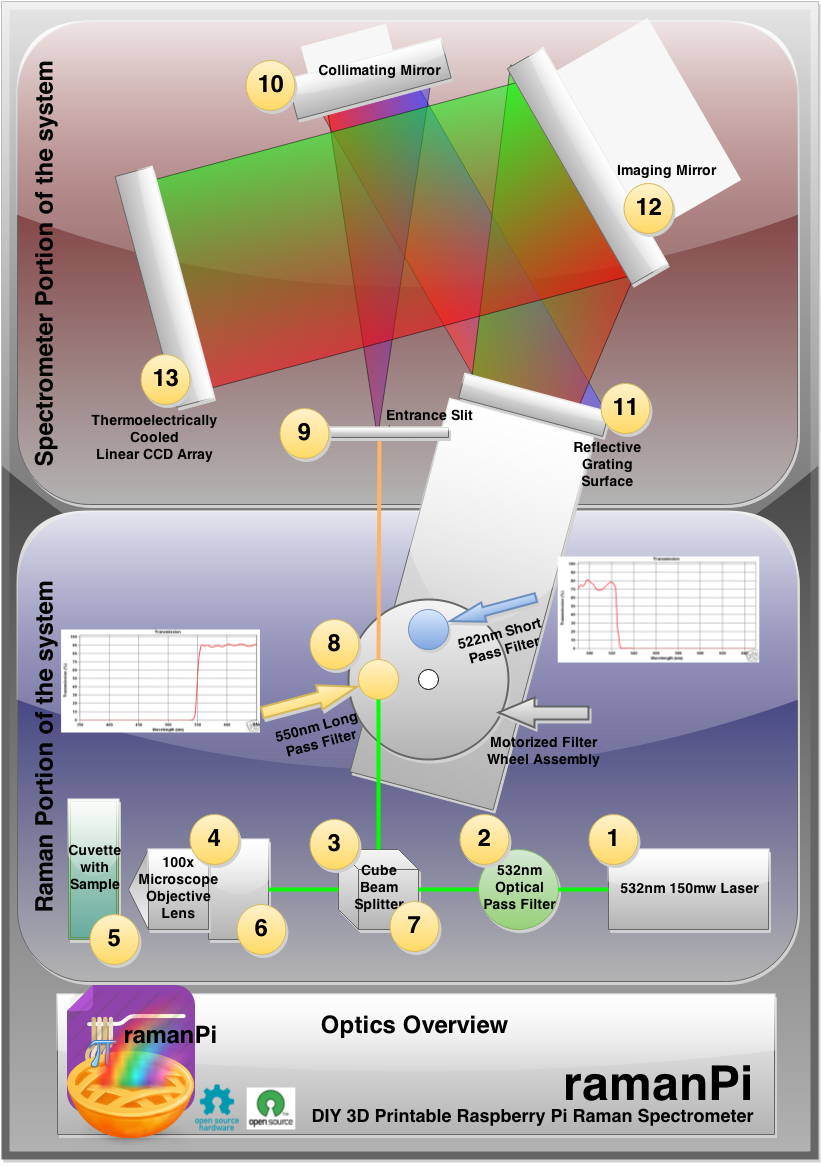
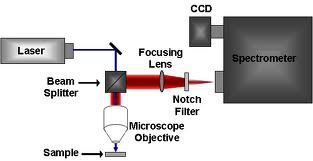
The following is what happens at each point in the optical system.
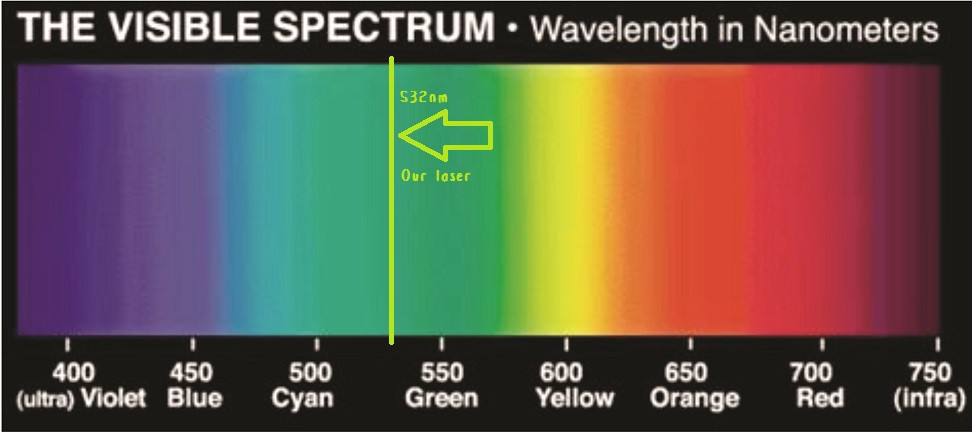
1. The laser emits a 532nm (green) beam of light.
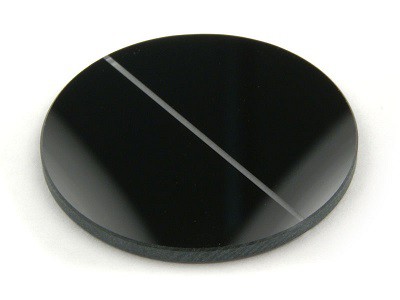
2. The 532nm Pass Filter only allows the 532nm (green) light to pass, and filters out anything else.
3. The Cube Beam Splitter passes half of the light on to the Objective Lens, and the other half into the Beam Dump.
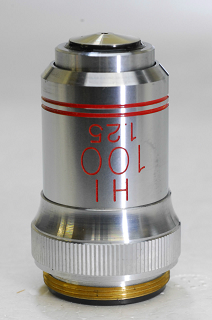
4. The Objective Lens focuses the light down to a tiny point in the sample.
5. The light in the sample interacts with the molecules, and depending on vibrations, bond angles, etc. the light is shifted from 532nm (green) to other colors/frequencies.
6. Some of the shifted light and a lot of the original laser light is reflected back into the Objective Lens and is collimated back to the Cube Beam Splitter.
7. The Cube Beam Splitter reflects half of the light to the Filter Assembly and half back into the laser.
8. The Filter Assembly contains two Edge Filters which block the 532nm (green) laser light and allow the other colors to pass. Since this is a low cost system, two edge filters are used instead of one Notch Filter...and so two separate exposures are taken and the images are stacked.
9. The Vertical Aperture (slit) controls the amount of light that enters the spectrometer section, and is a determining factor in spectral resolution.
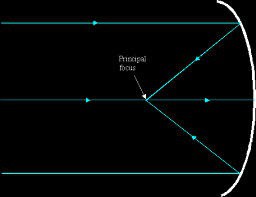
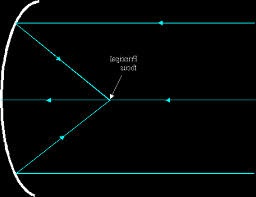
10. The light from the slit is reflected off the Collimating Mirror on its way to the Diffraction Grating.
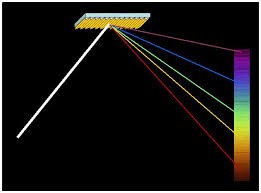
11. The Diffraction Grating acts like a Prism and divides the light into separate colors. Since the light originated as 532nm (green), and the shift is typically fairly minor, this light may be close to the original color...but also may be red (lower frequency) or even blue (higher frequency).
12. The light reflected from the Diffraction Grating is reflected by the Imaging or Focusing Mirror onto the Detector Array..
13. The spectra derived from the above process is reflected by the Imaging Mirror onto the CCD Array where it is captured by the raspberryPi for processing.. One image is taken with the first Edge Filter, then another exposure with the next Edge Filter and then some software to stack the images is used together along with some signal processing and possibly multiple exposures to gain as much brightness as possible so the computer can correctly analyze the spectra...
Originally I started out with a different configuration for mounting the optics. Since then, I decided to go with a much better solution where the optics are enclosed in a contiguous structure that eliminates stray beams and keeps ambient light out. It is also easier to set up, and should stay aligned longer in addtion to being more shock resistant and will reduce resonance.. The system is comprised of a number of individual modules, most of which are based around the optics listed above.
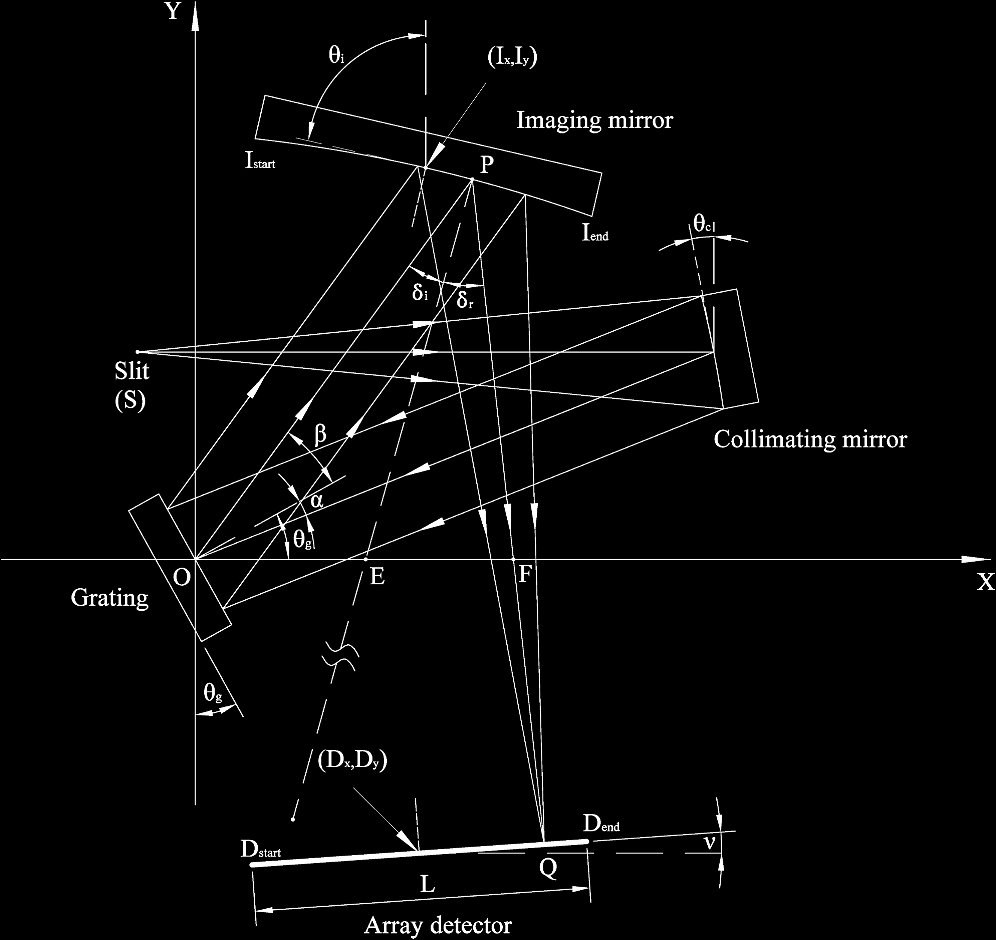
The spectrometer portion uses the Crossed Czerny-Turner Configuration shown below.

The full system with spectrometer installed.. These parts were all designed using openSCAD and printed in ABS on a daVinci 1.0 3D Printer. This section of the project contains the optics as described above in the optics section. To print them, it requires about 1800grams of filament and several days.
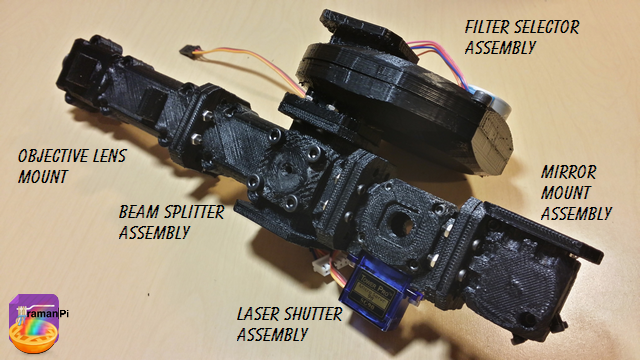
Here without the laser and the spectrometer..
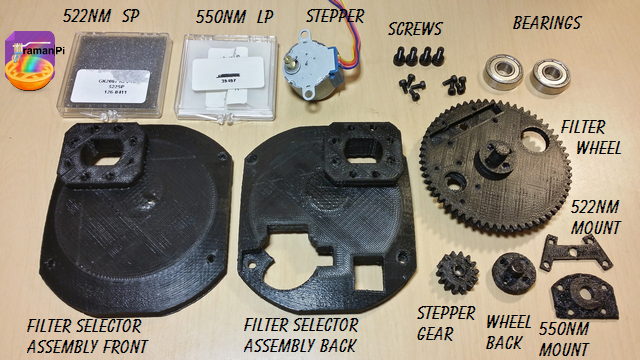
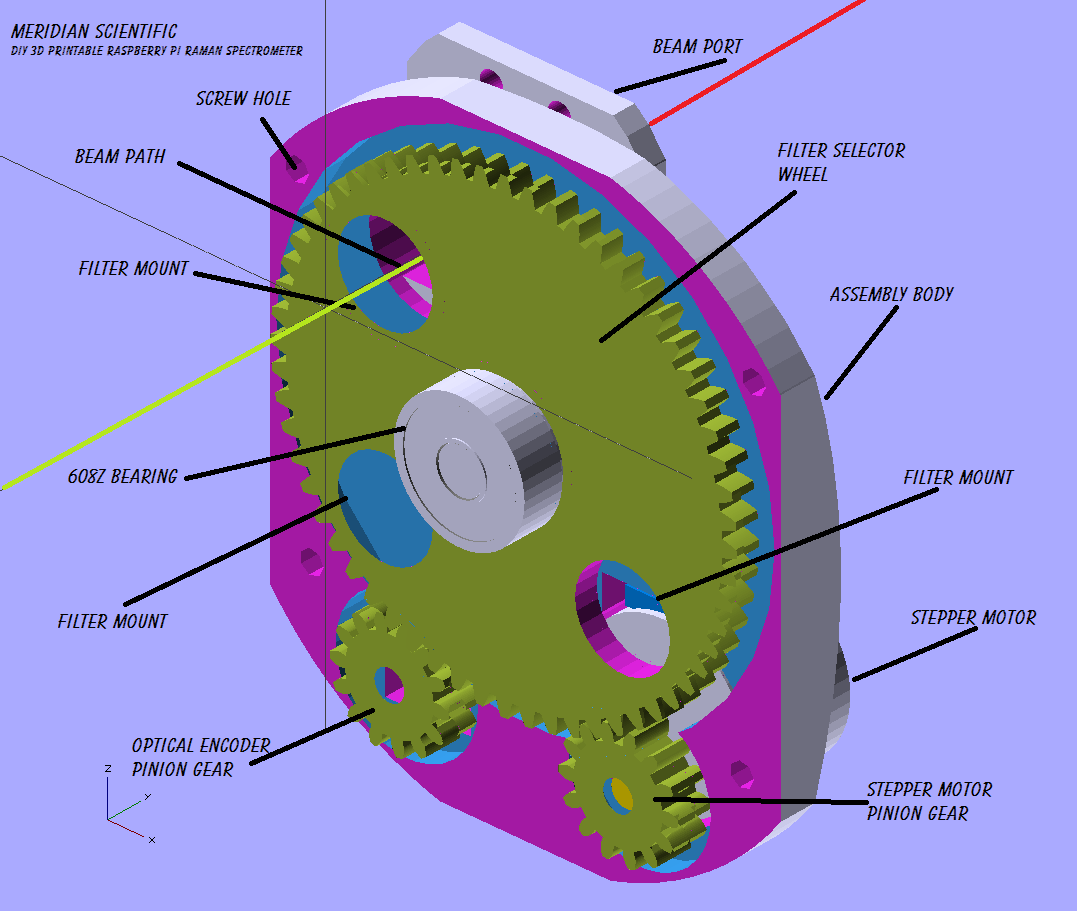
The parts that make up the filter selector assembly..
The filter selector assembly with the front removed..

A closeup of the inside of the spectrometer.. The fins are light baffles that keep reflections inside the device to a minimum.
Another closeup detailing the collimating mirror mount inside the spectrometer..

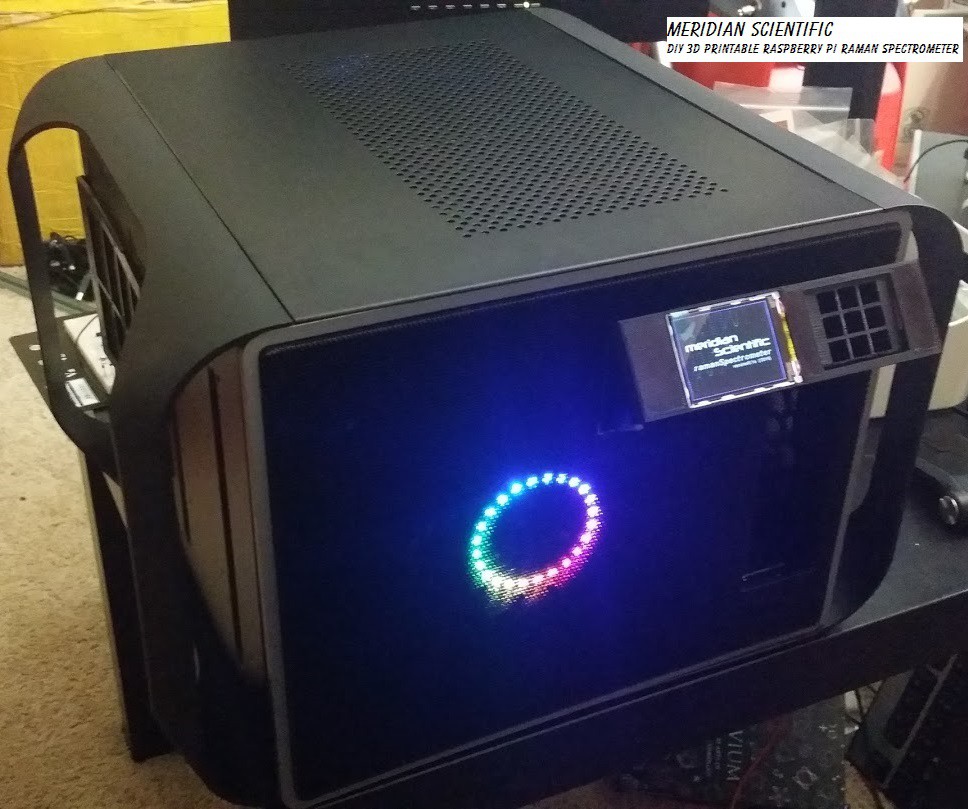
A view from the outside... The whole thing fits in a Prodigy mini ITX case by BitFenix..
 |
|
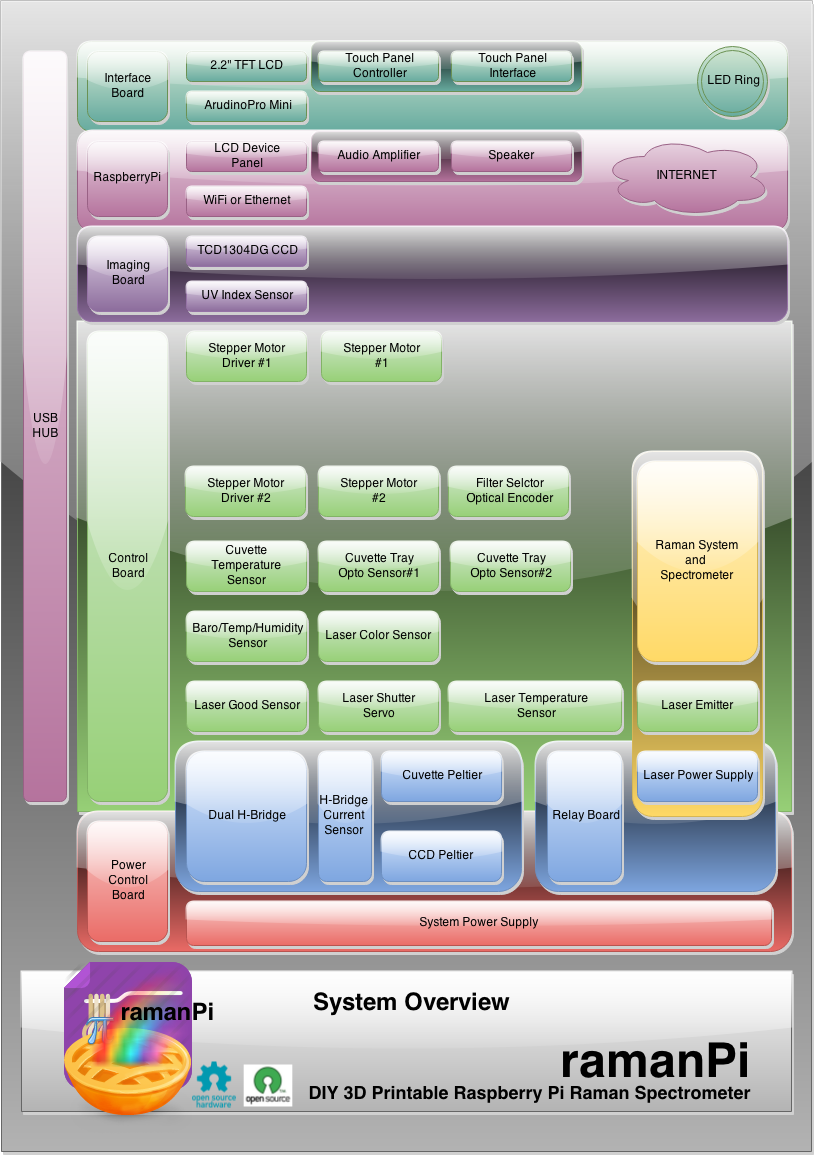
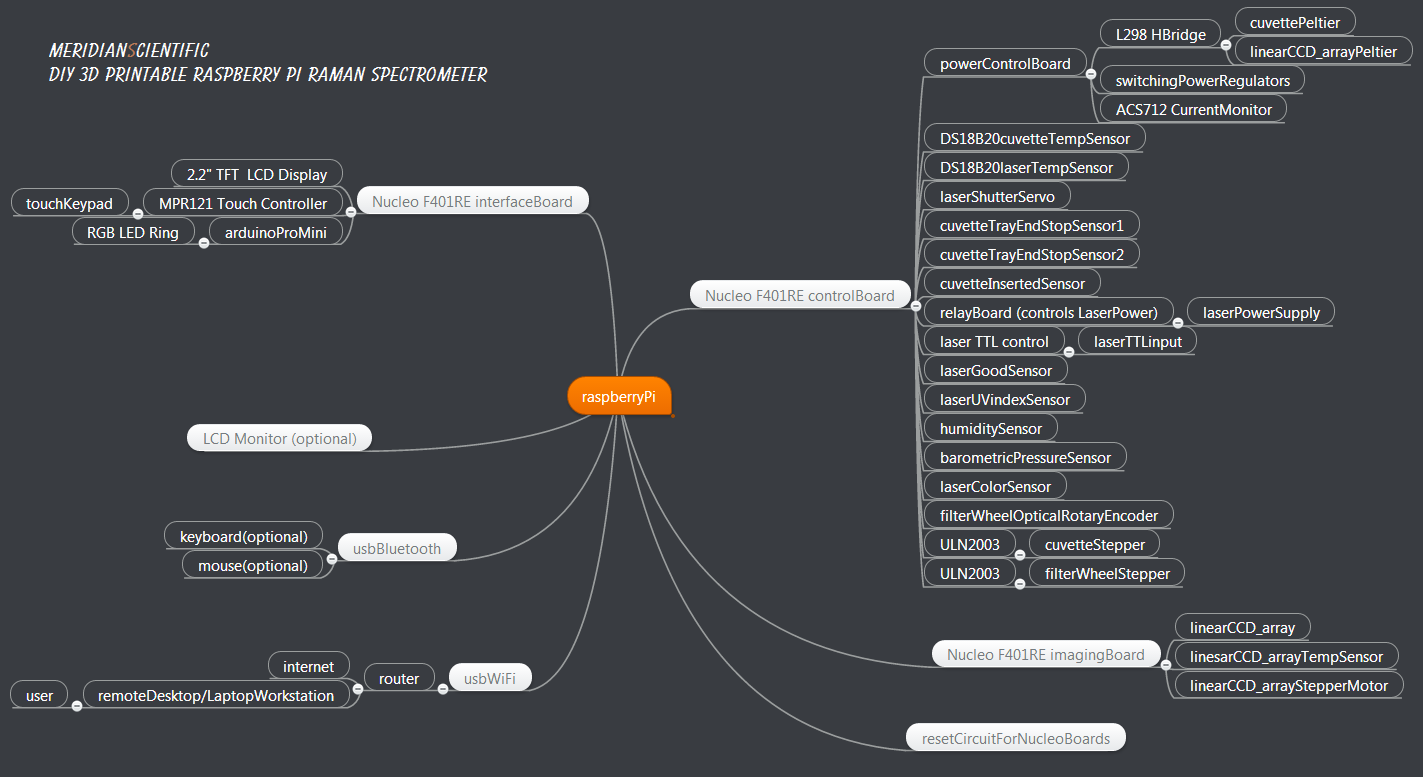
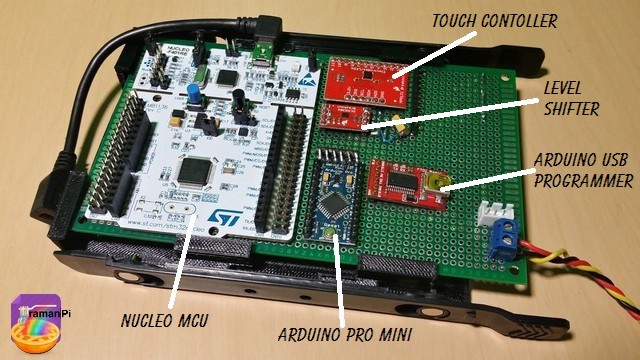
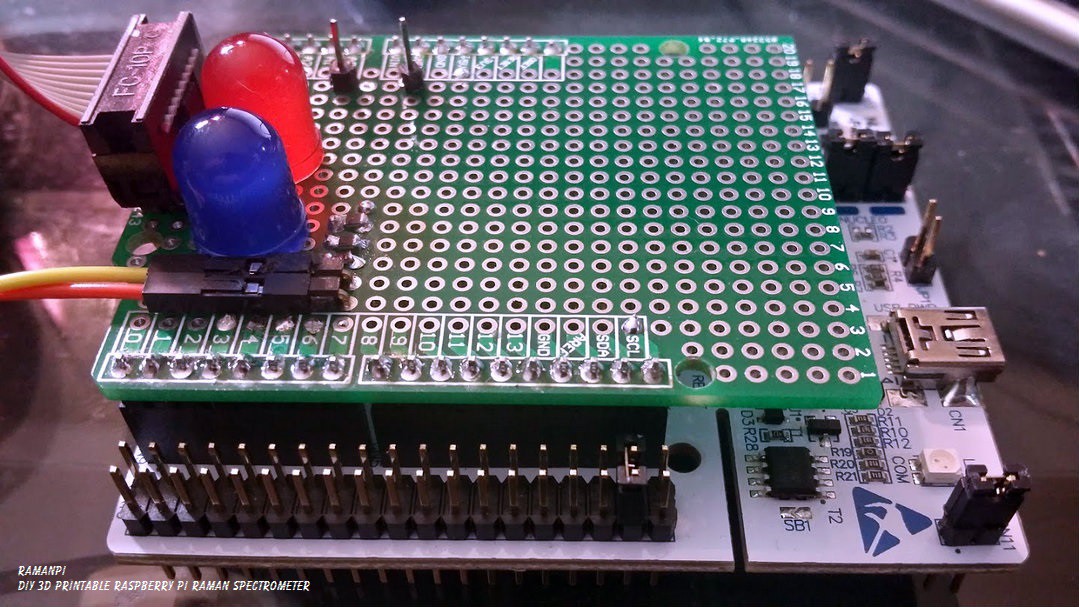
The electronics are centered around a raspberryPi. There are three microcontrollers tied to the raspi through rs-232.. The controlBoard, the interfaceBoard and the imagingBoard.. The controlBoard is also tied to the power control board... and at this time, the imagingBoard and the interfaceBoard may be living on the same PCB..
All three boards are based on the ST Microelectronics Nucleo F401RE STM32F401RE MCU and fit into what used to be hard drive trays that slide into the case..using a 3D printed adapter..
The Nucleo F401RE is just one of many platforms supported by mBed.. The boards shown below are prototypes, I'll be publishing the Eagle files for the new boards when I get the bugs worked out with these..
I am using the mBed online IDE to program them.. Say what you will, it works great.. gitHub to firmware..

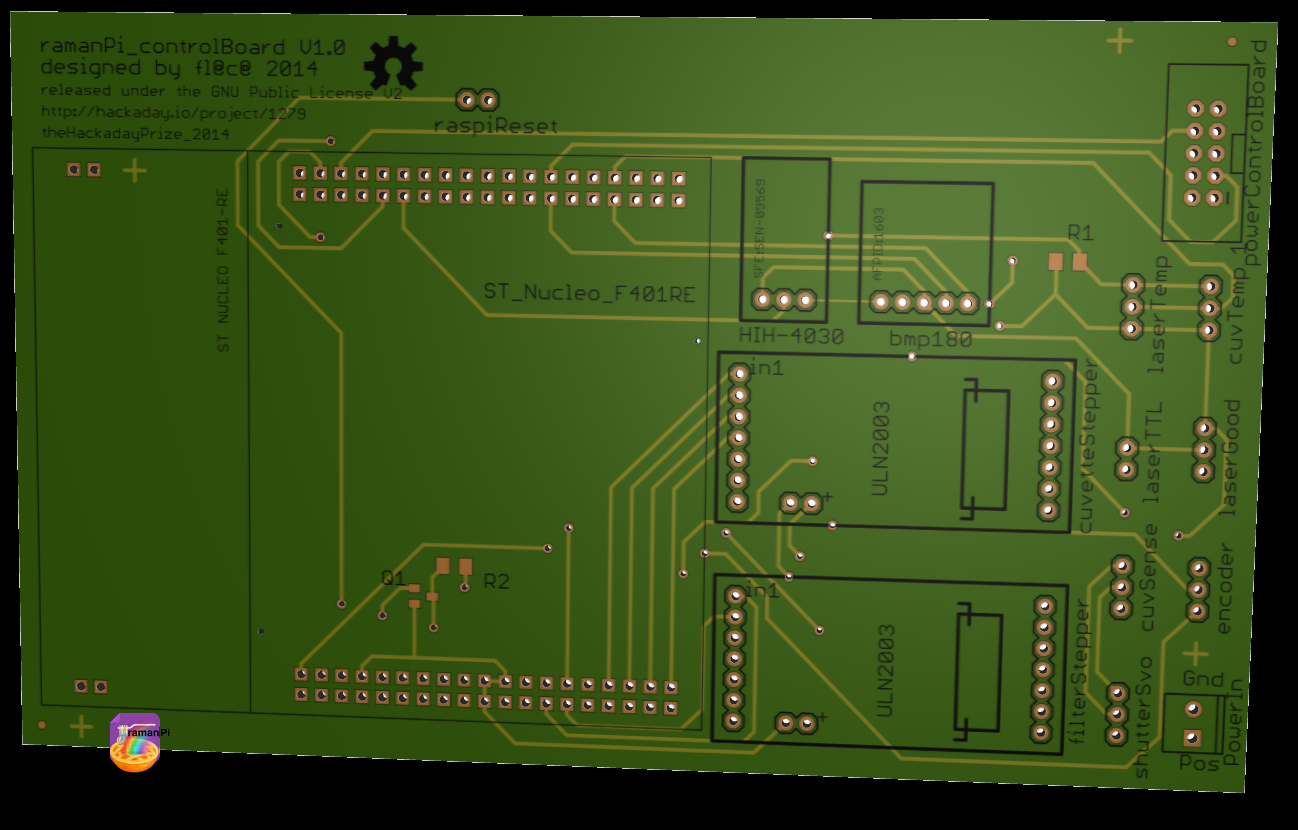
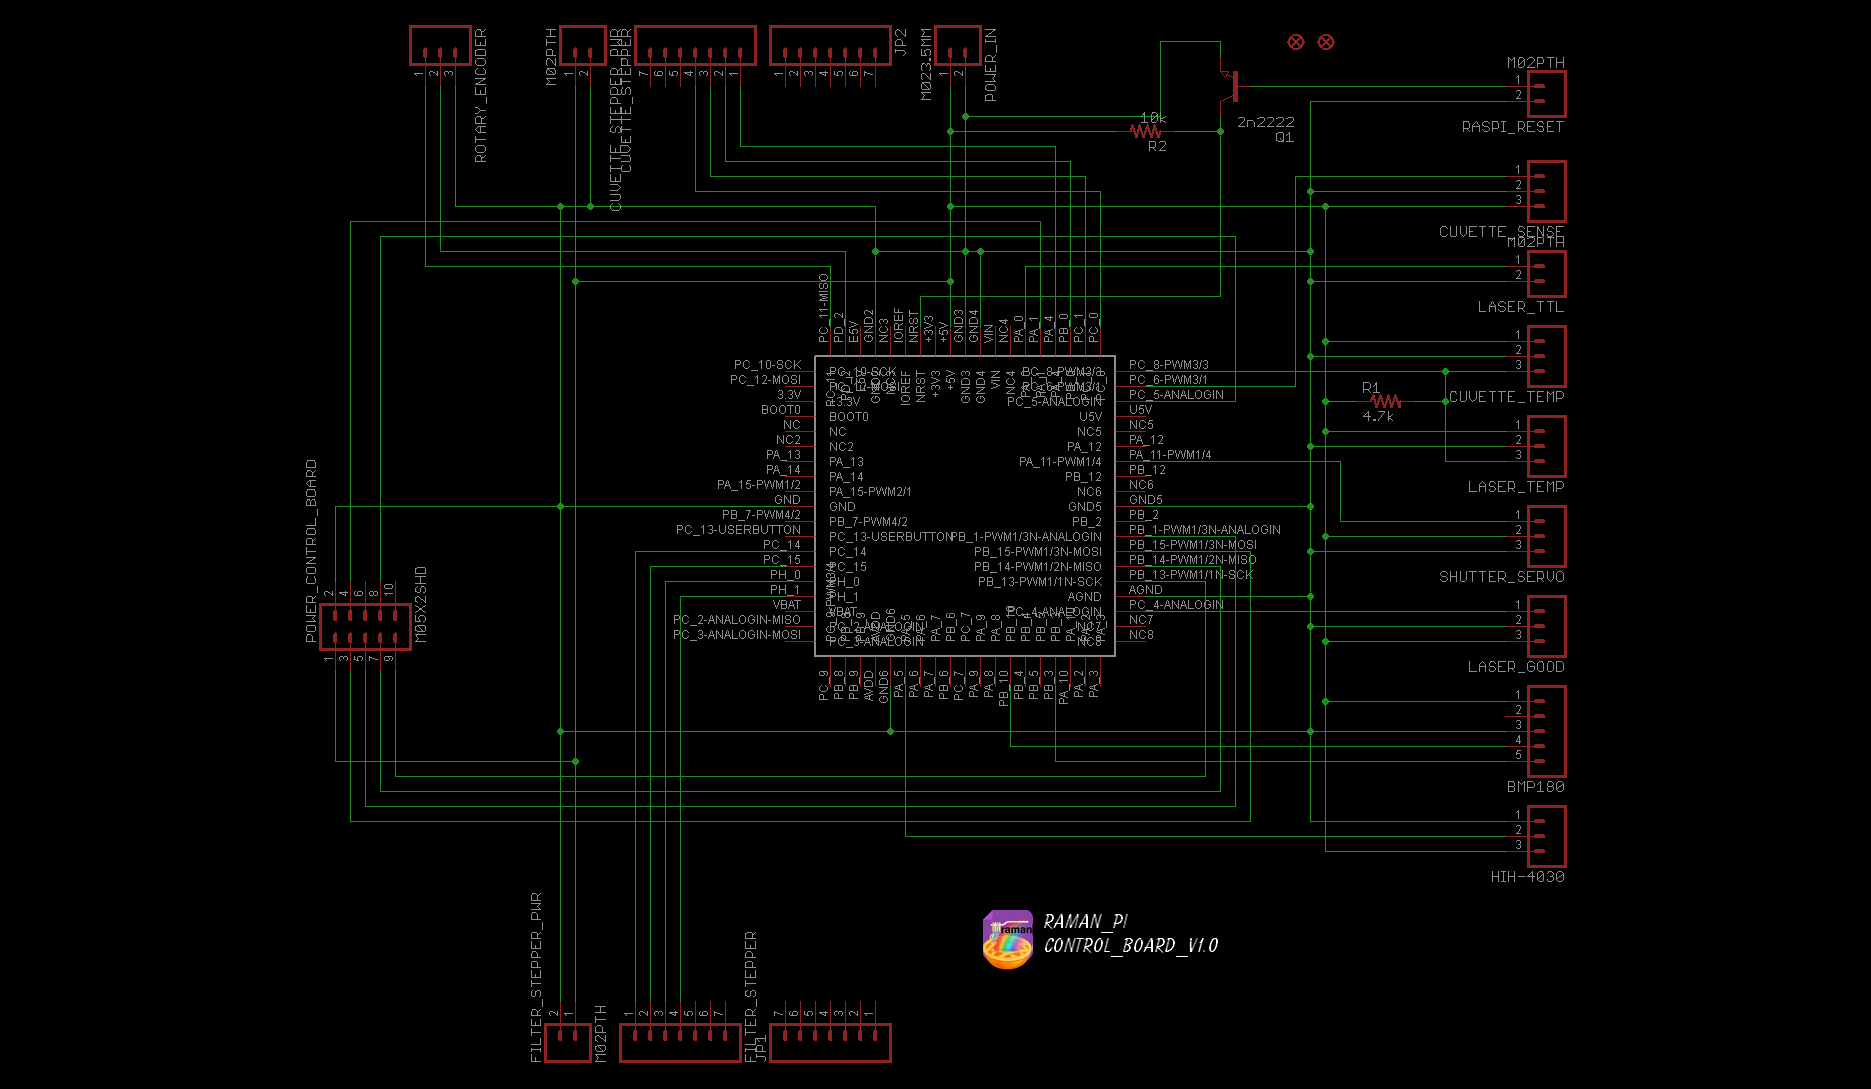
Schematics, board information and firmware can be found here.
More can be found here.
- Power Relay for Laser
- TTL Control for Laser
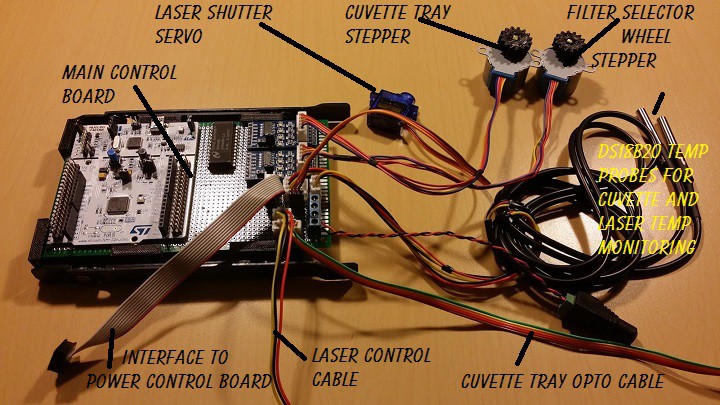
- Monitor Temperature for Laser using DS18B20 sensor
- BMP180 Barometric Pressure Sensor for integration into compensations
- HIH-4030 Humidity Sensor also for integration into compensations
- Control L298 HBridge for Heating/Cooling of peltiers on CCD Array and Cuvette
- PID Monitor and control Cuvette temperature using DS18B20 and L298 HBridge
- Monitor current draw from peltiers on CCD Array and Cuvette using ACS712 current sensor
- Control Beam Shutter using a standard 9gram hobby servo
- Detect Laser Good (verify beam is reaching destination) using a TEMT6000 ambient light sensor
- Open and close Cuvette Tray using stepper motors driven by ULN2003, with optical end stops
- Rotate Filter Wheel Assembly to change from 522nmSP to 550nmLP filters using ULN2003
- Detect Filter Wheel Assembly position using rotary encoder
- Monitor Cuvette Holder for presence of cuvette in tray using a optical proximity sensor

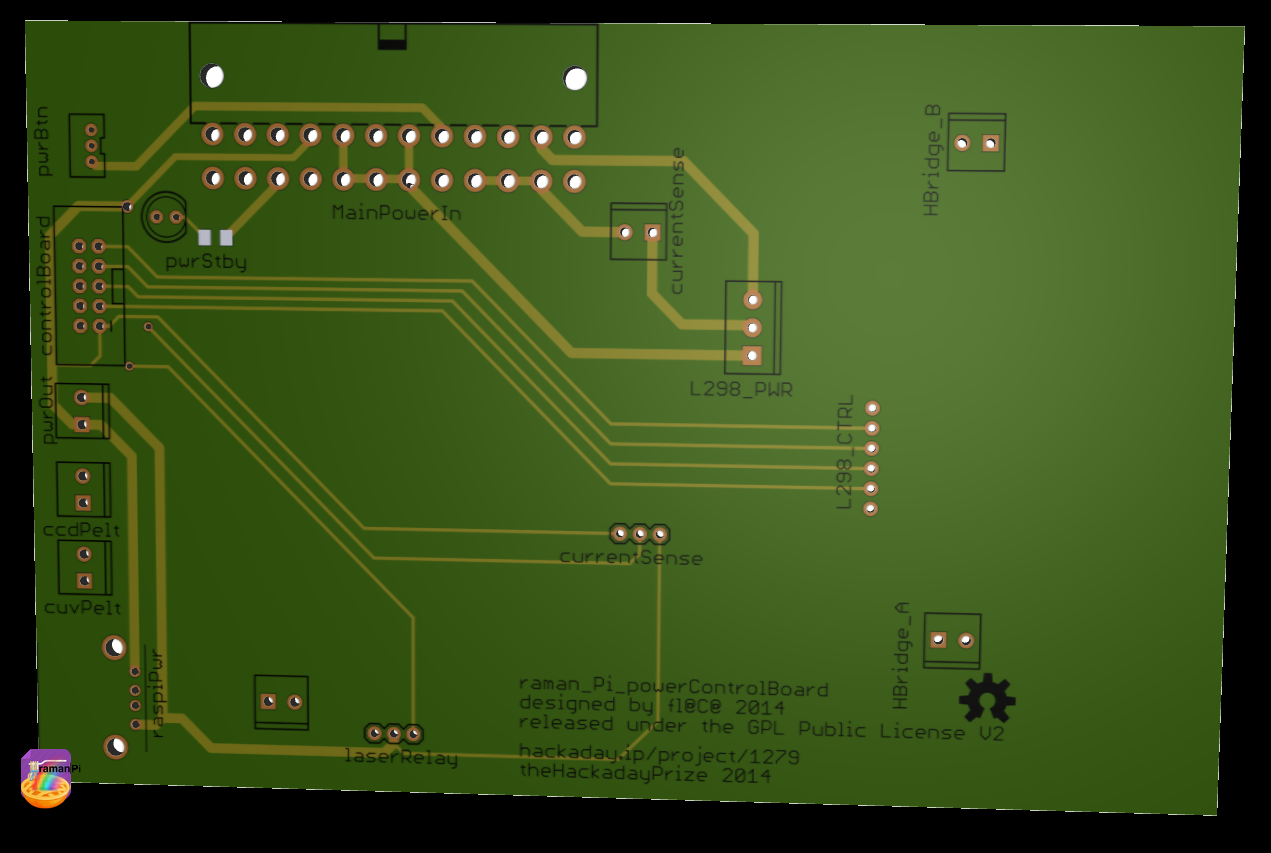
 Board information and schematics can be found here.
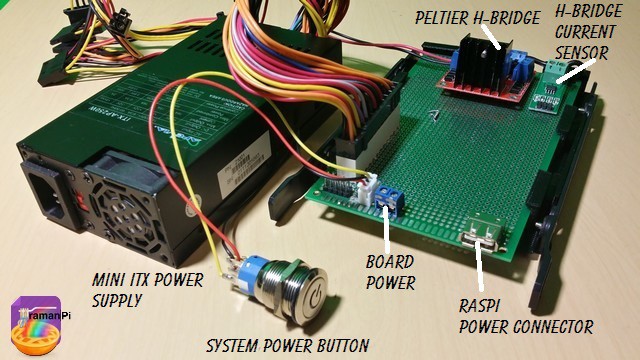
- Accepts power from main power supply and distributed it to other boards
- Contains the L298 HBridge for the imaging and cuvette peltiers
- Current Sensor monitors peltier current draw

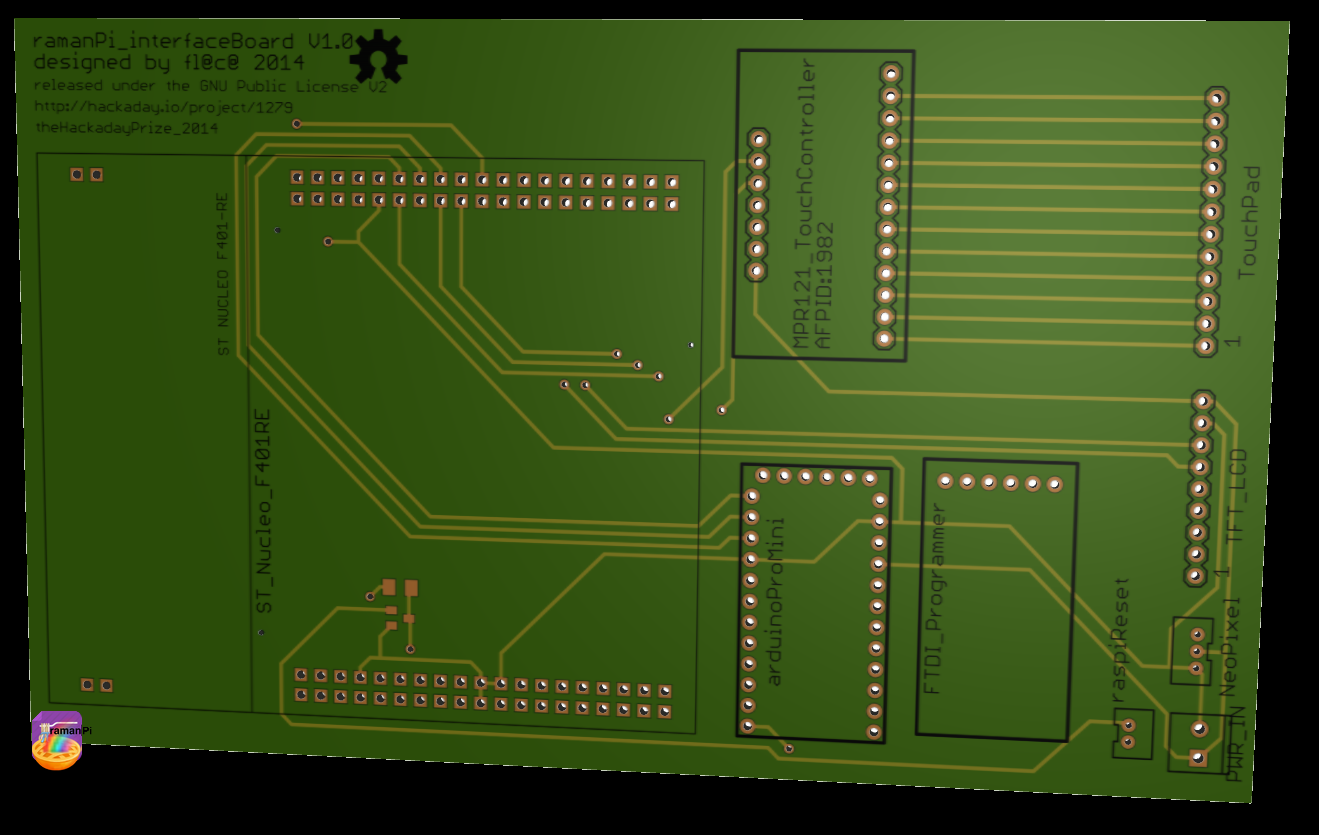
Schematics, board information and firmware can be found here.
- Arduino Pro Mini (for Adafruit RGB LED Ring which animates depending on activity)
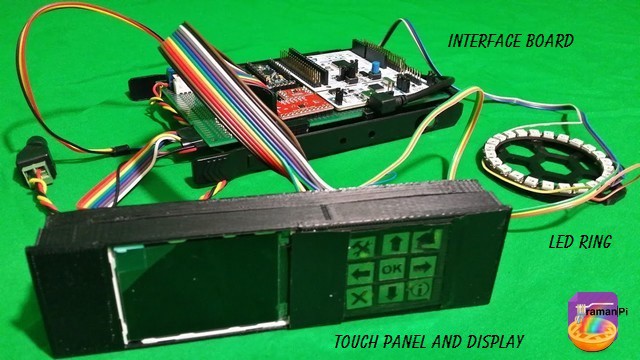
- ILI9341 2.2" TFT LCD Color Display
- Capacitive Touch Panel with 12 'Buttons' using MPR121 touch controller
- Displays system status and mini control interface
- Accepts user input to open/close cuvette tray, etc..
- LED Ring provides feedback regarding status, etc..

Current Schematics, Firmware and other details for the imagingBoard can be found in the project log located HERE.....or in the gitHub repository..
imagingBoard main board schematic
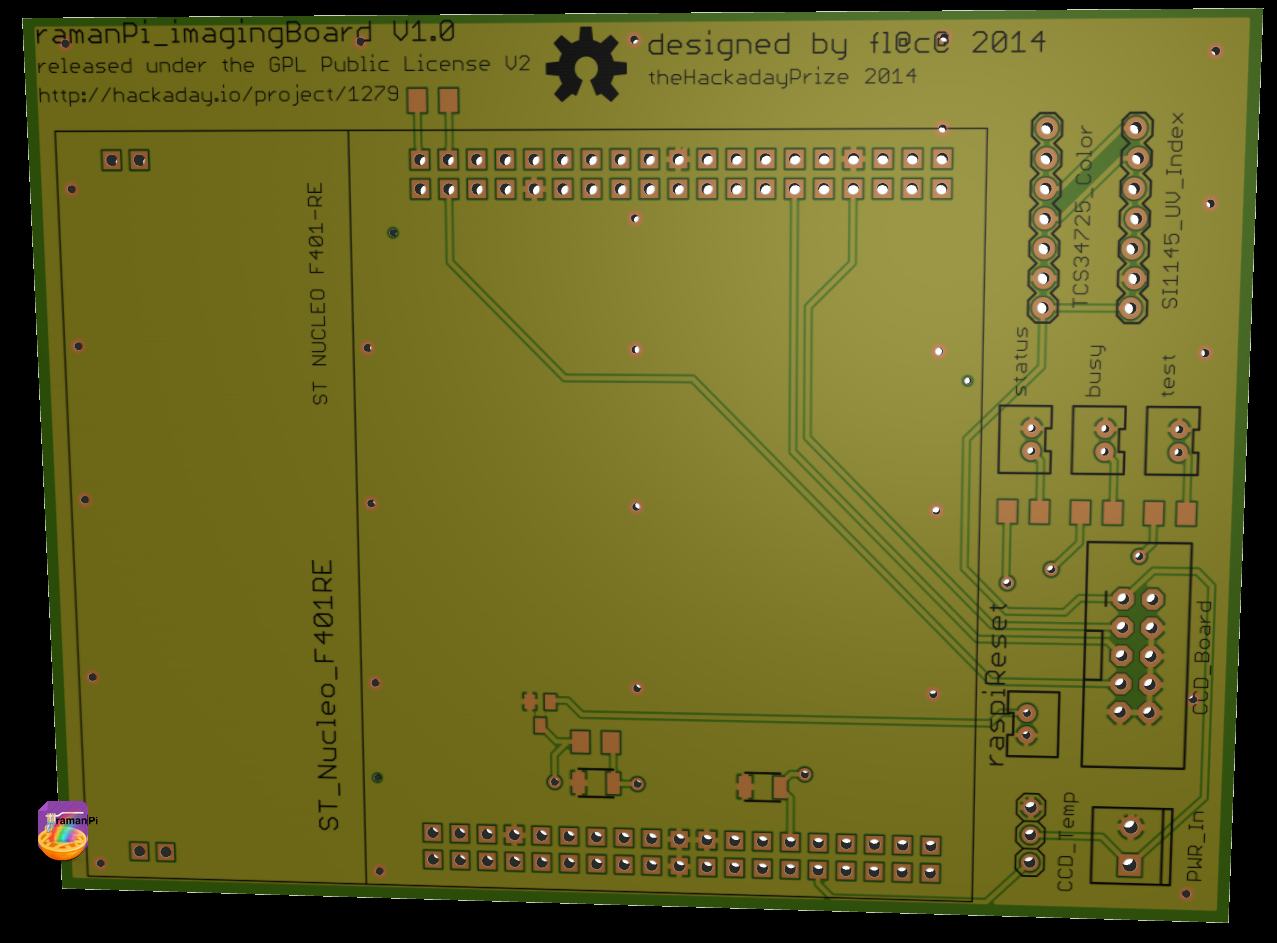
imagingBoard_ccd board schematic..
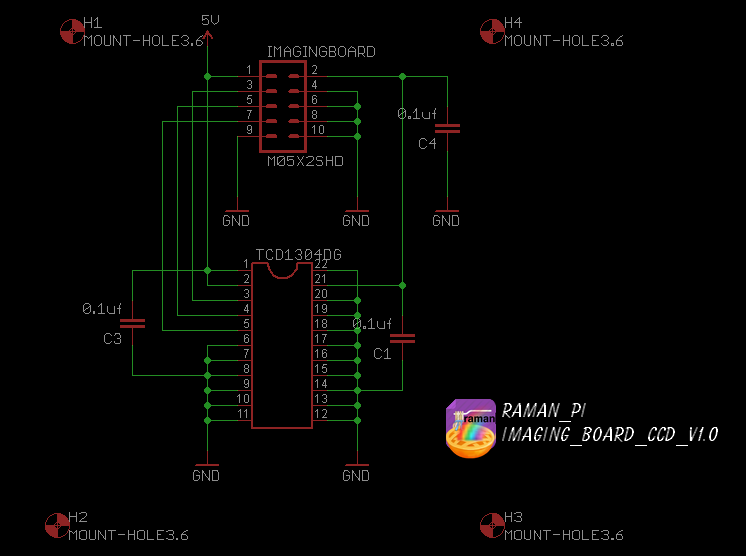
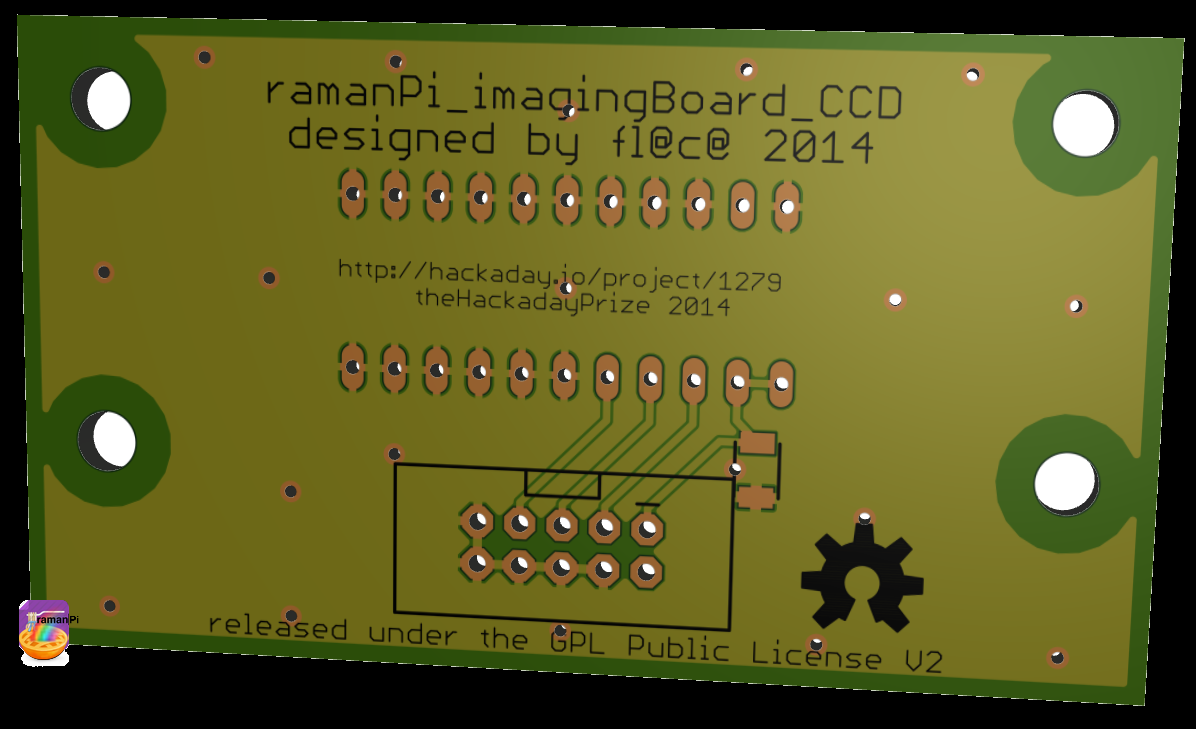
Schematics, board information and firmware can be found here.
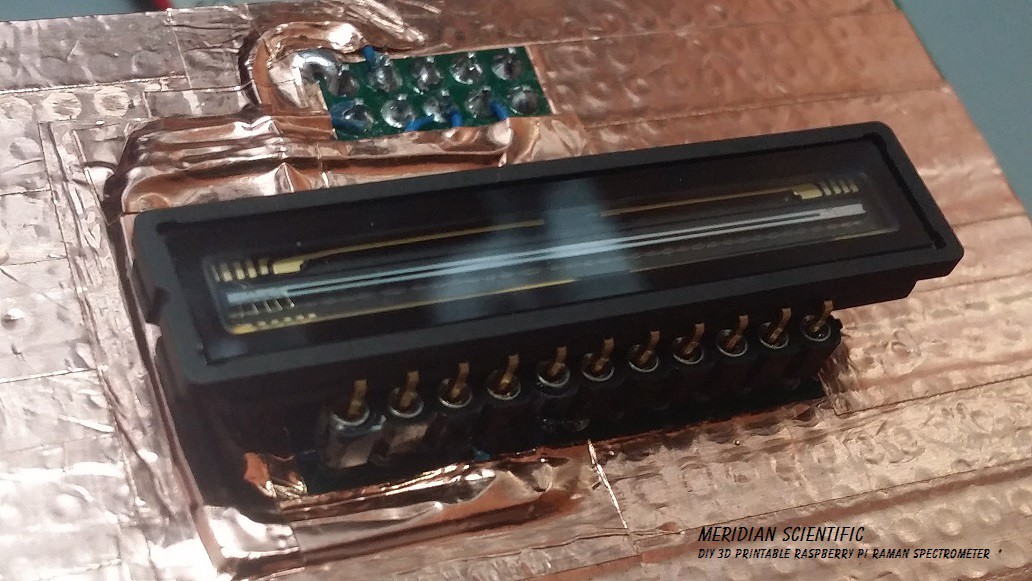
- Controls Toshiba TCD1304DG Linear CCD
- Monitors Linear CCD Detector Array Temperature via DS18b20 temperature sensor
- Monitors UV index and IR with a SI1145 UV Index Sensor to detect fluorescence and IR.
- *Might, at least in future update control the Linear CCD sliding, which can be used to increase resolution.
- Transmits CCD data to raspberryPi for processing

I will start by saying, there is no secret sauce to this project.. I am committed to sharing every detail of how this project works, how to build it and how to get it working...and hopefully how to modify it to suit your needs!
The entire system is based on a raspberryPi.. And uses 4 microcontrollers to accomplish its tasks.
Firmware for the controlBoard, interfaceBoard and the imagingBoard can be found either on the gitHub repo or directly at the mBed.org site...
controlBoard: http://mbed.org/users/flatcat/code/ramanSpectrometer_controlBoard/
interfaceBoard: http://mbed.org/users/flatcat/code/ramanSpectrometer_interfaceBoard/
imagingBoard: http://mbed.org/users/flatcat/code/ramanSpectrometer_imagingBoard/
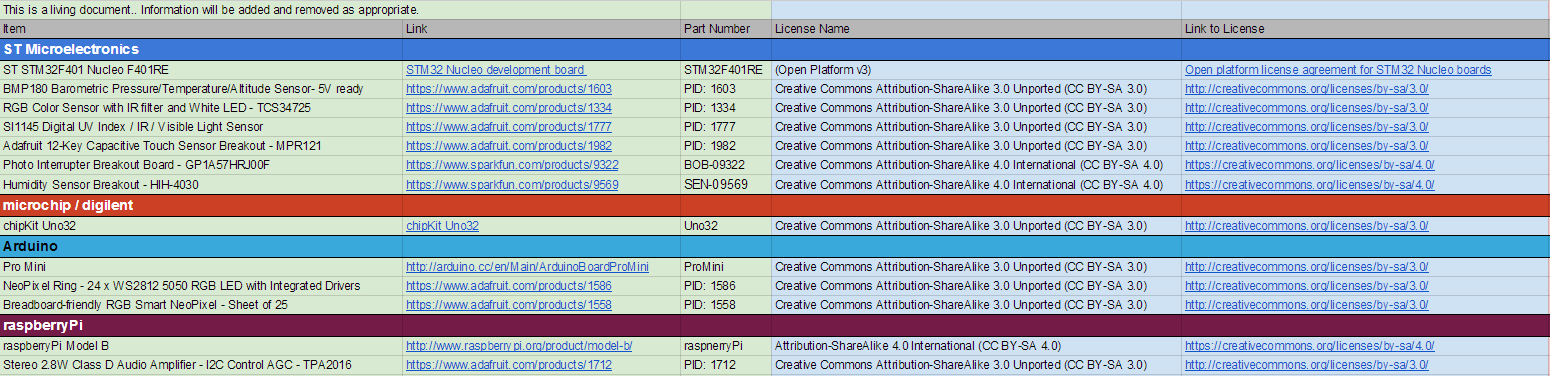
The open source hardware information:
The open source software and library information:
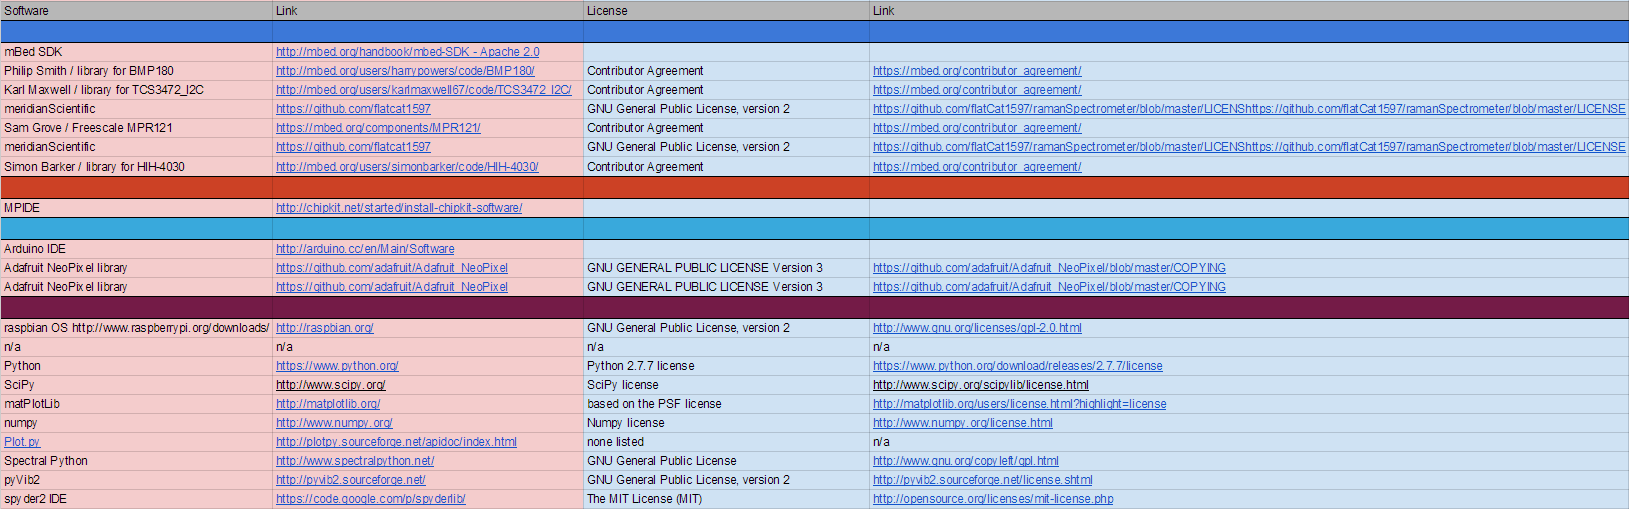
For a more readable version of this, check the gitHub location.. I tried forever to figure out how to get this information on here in a readable format, but there just doesn't seem to be any way..
The device firmware for the controlBoard, interfaceBoard and imagingBoard are located in the gitHub under software and are in 4 formats..Three of which are zip files.. There are the actual C++ files and then the exports from the online compiler...which you should be able to import and compile without issue.. There is the Keil uVision4 .zip file, the mBed online IDE (mBed Tools) .zip file, and the zip archive (With Repositories) version.. As soon as I have some worthwhile code to share, I will start putting the pre-comiled .bin files on gitHub as well...that way you can just drag and drop them to your Nucleo board without concern..

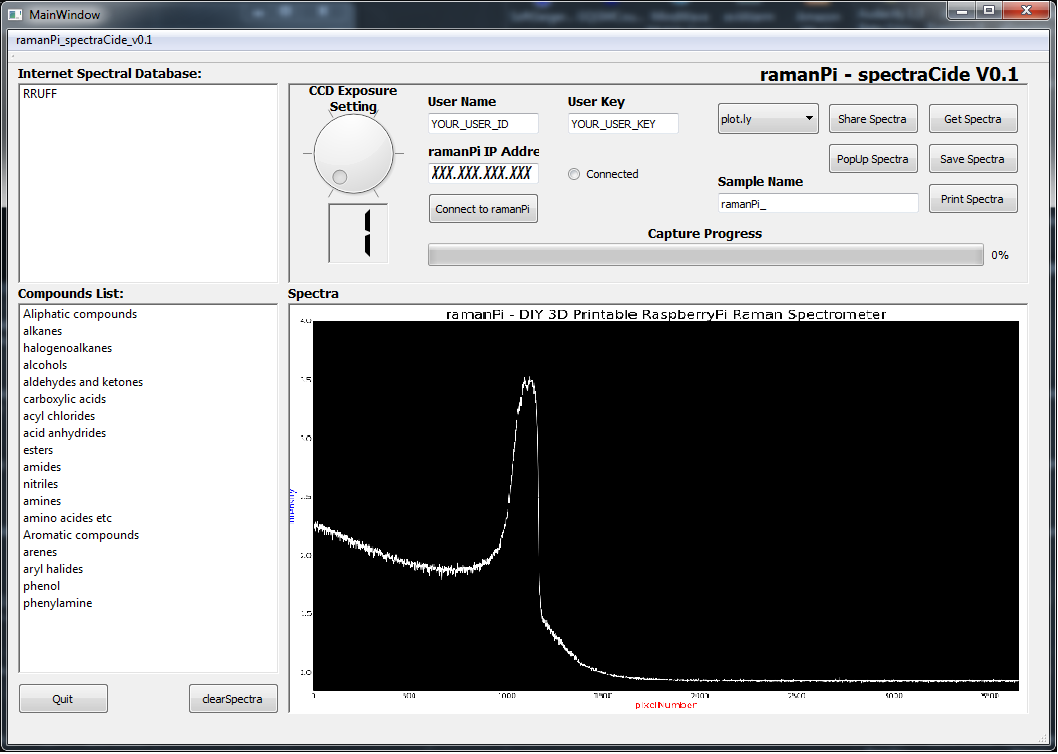
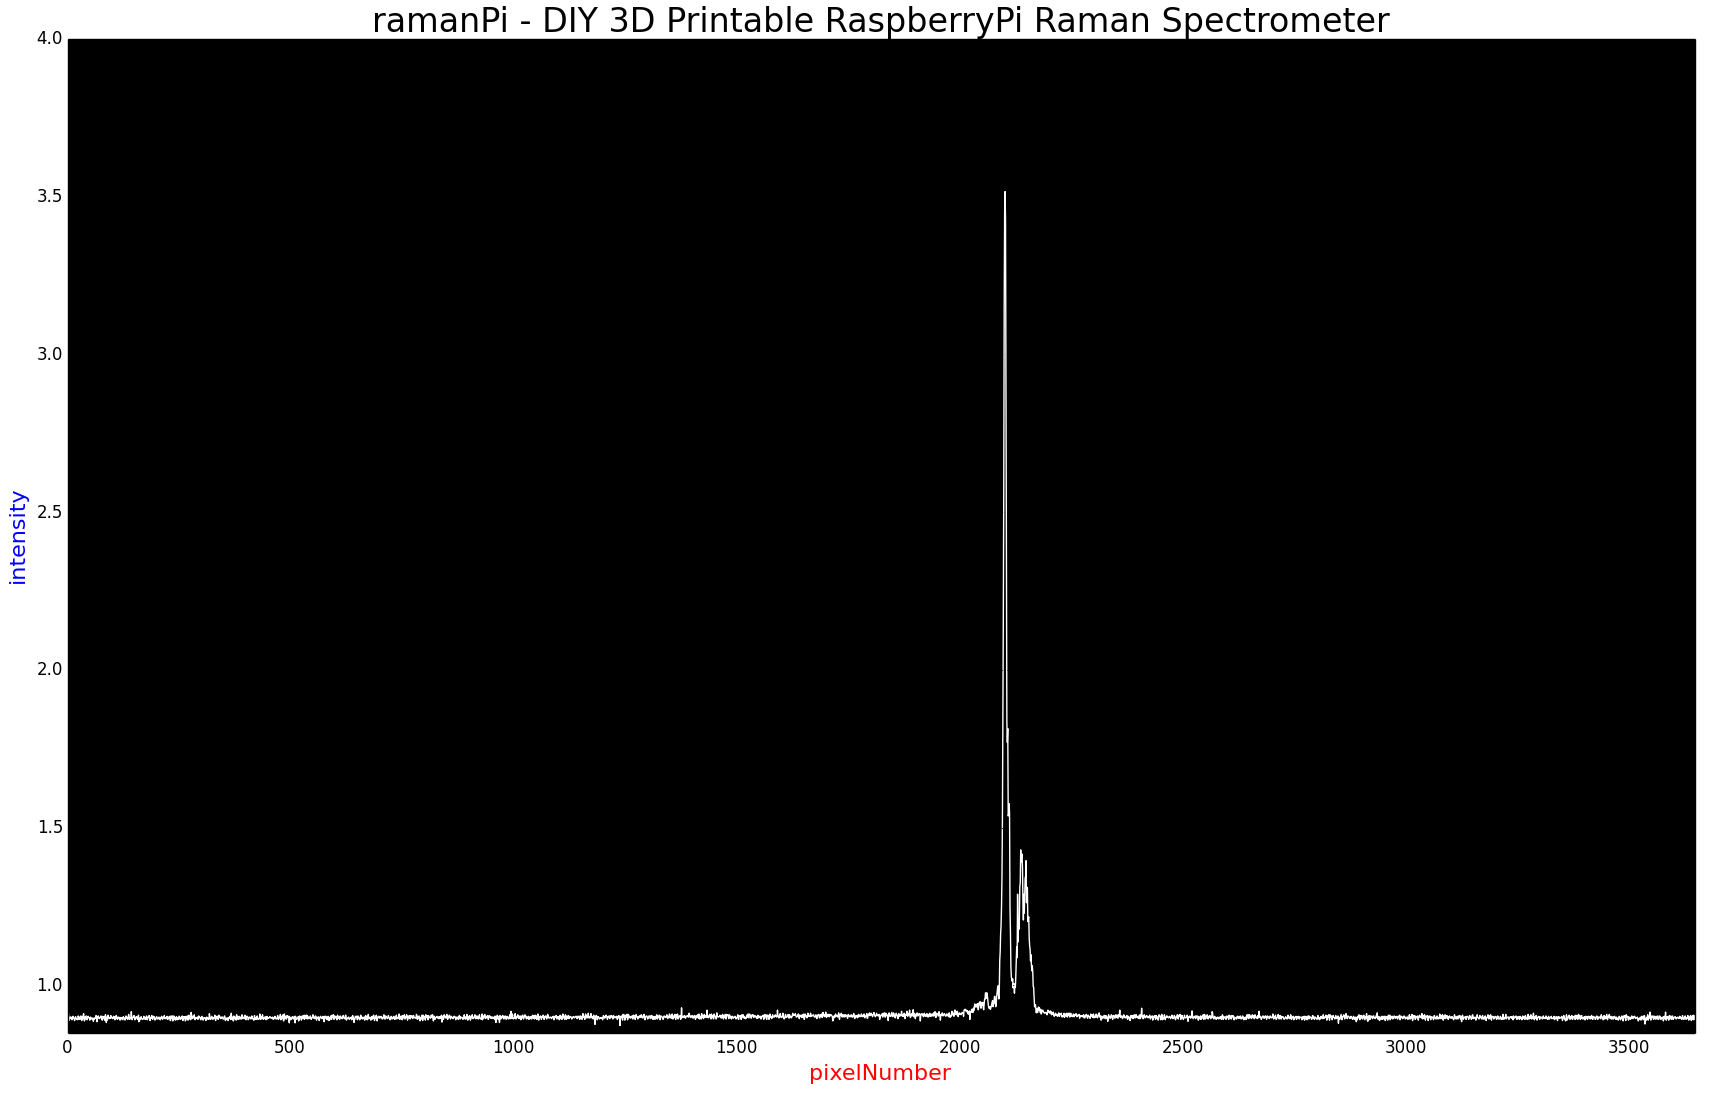
The software consists of a server application that runs on the raspberryPi, the client software that runs on the remote machine you are using to perform tasks and view the spectra, and the firmware for the microcontrollers if you count that.. Above it the first version of the client software for the remote terminal...it is written in python and uses PyQt4 for the interface..It also uses matplotlib and numpy to plot the spectra.. It also uses the plot.ly API for posting the data to the internet for sharing... There will be a large amount of development with this soon.. Accessing the RRUFF online raman spectral database is coming, and many other features.. Since it's written in python, and uses PyQT4... it runs in linux and windows both.. Happy about that too..
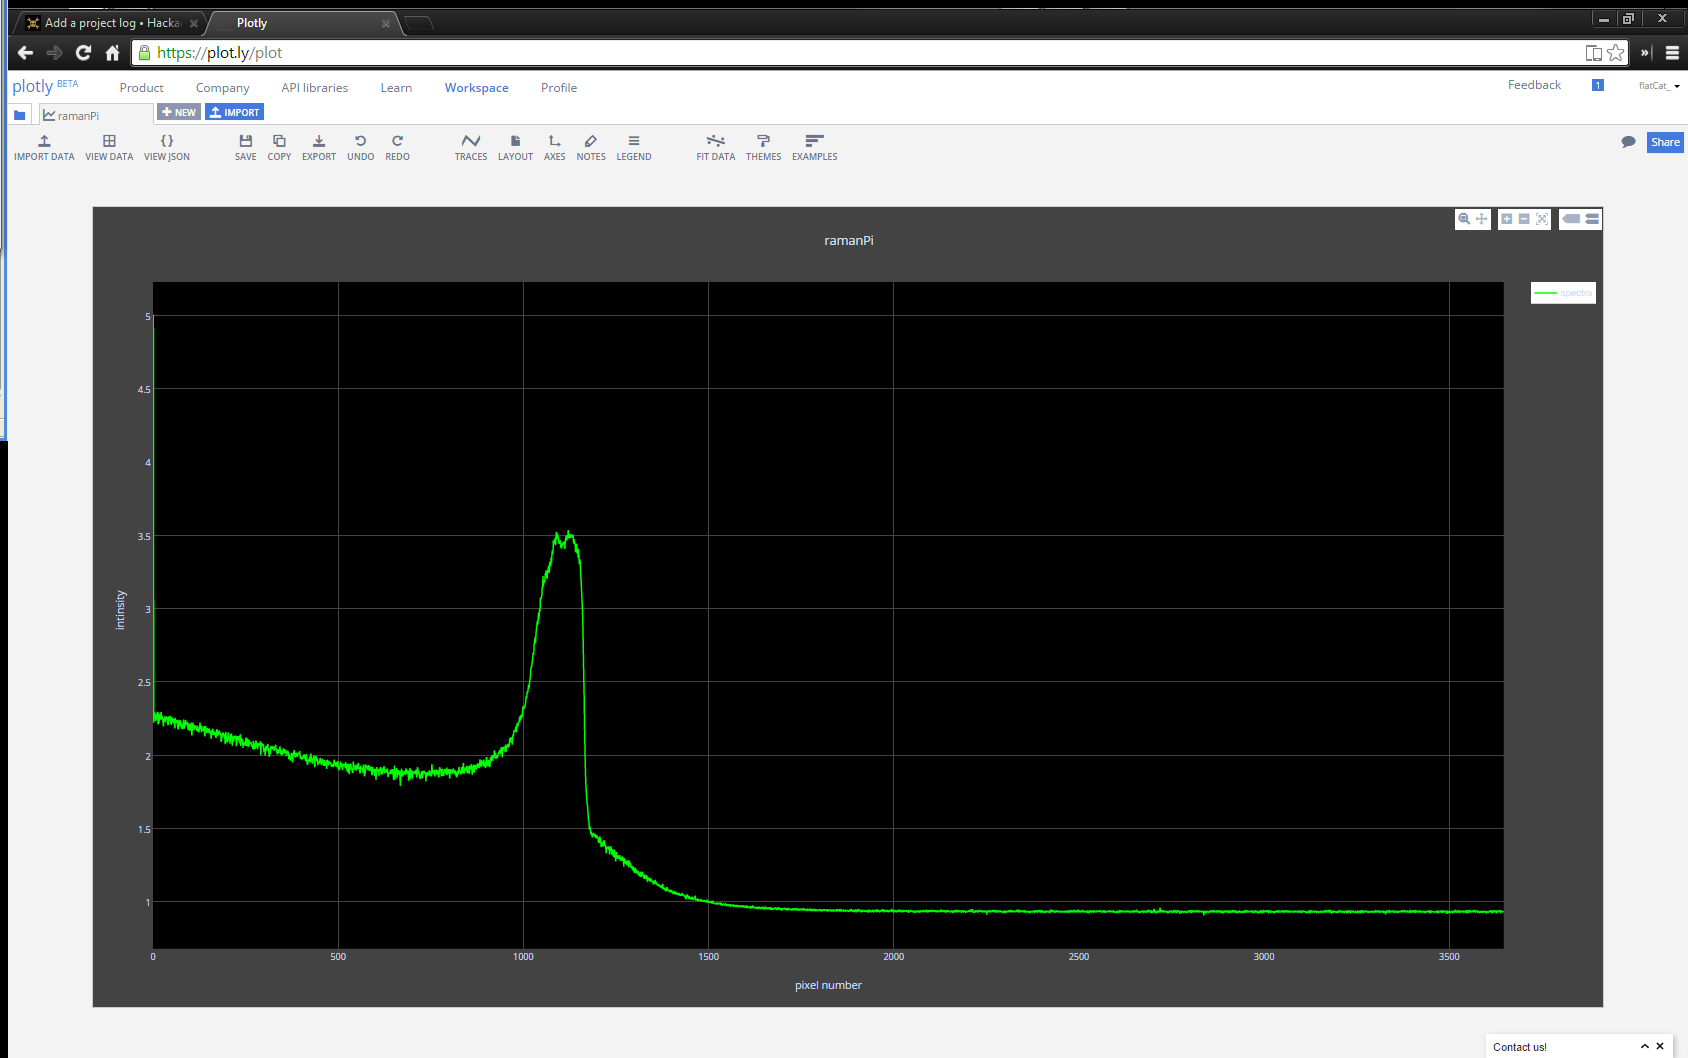
Here's the plot.ly view of the same spectra shown above..this time from a web browser, which could be on your phone (I've tested it, works great), chromebook, tablet or whatever... This is something I wanted to include from day one..I'm very excited I was able to get this done so well. I plan on expanding to other data sharing sites too...
So, the process is pretty well explained above...in 'the process'.... But basically, the server software on the raspi doesn't really have a gui... it just runs and does what it needs to do.. The client connects via the IP network....you decide to take a sample...so you put your sample in..move over to your client machine...click 'get sample' it send a command to the raspberryPi across the network...the raspberryPi send various commands to the microcontrollers and begins the process of taking a sample... it might need to take several images, and process them, etc.... then it crunches some data... and sends it to your client.. now, before you clicked get sample.. the raspberryPi determined if you are on a PC or some other device... if you're on a PC it just spits the regular spectra to you and your client software goes out and does the spectral search through the databases, etc.. and obtains its match and displays it to you, etc... if you're on a less powerful device, say a smart phone.. the raspberryPi does the search and crunching, comparisons, etc. itself and spits out the resulting match to you...and a plot.ly graph.. How is that for simple?

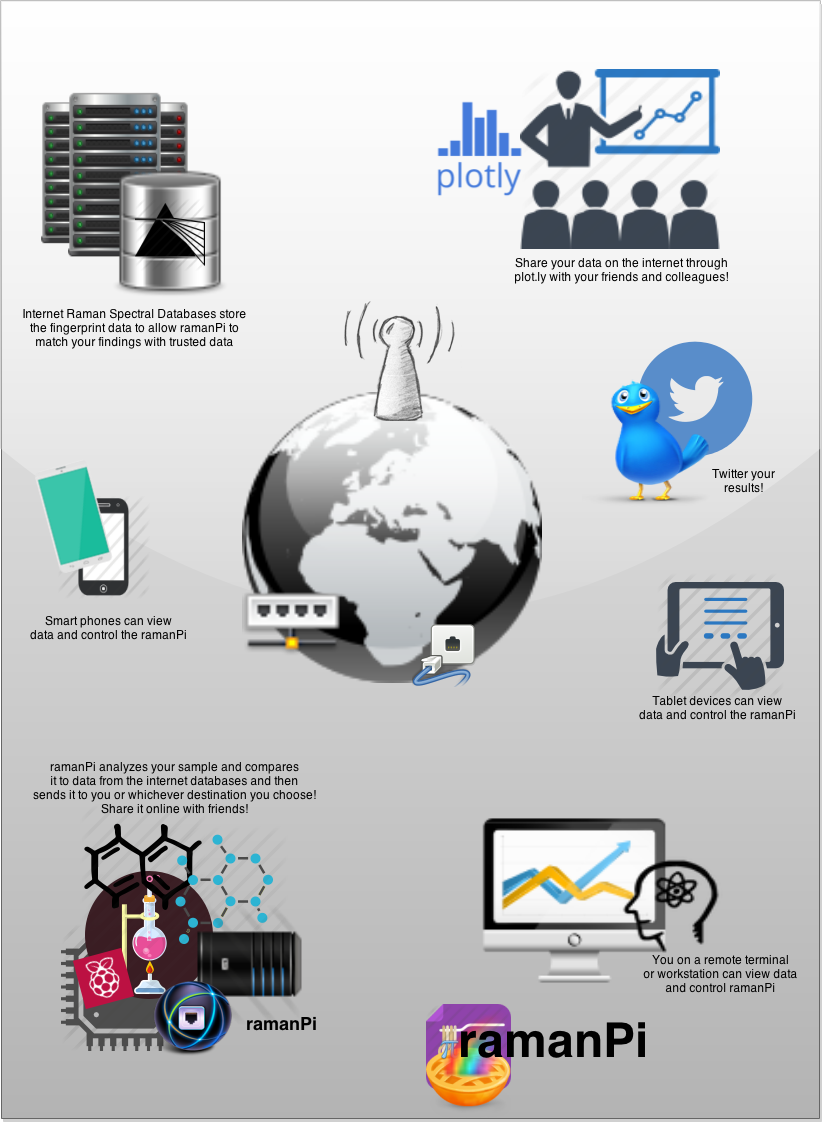
Connectedness might be a subjective term.....but ramanPi meets or beats any expectation in this department... Being connected to the internet is central to the system.. Without internet access, ramanPi would not be able to identify the compounds under test as maintaining a local spectral database is hardly short of insanity. ramanPi also isn't a standalone device..it requires a workstation with client software which displays the spectra, etc.. In short, ramanPi is a lab instrument that analyzes samples of compounds in cuvettes inserted into the system through the cuvette tray...ramanPi can take commands through the integrated touch panel and display to do certain things like open and close the cuvette tray, configure some items, show system status, etc.. A remote workstation running the client software connects to ramanPi through the network and requests that it start the analysis, or a number of other tasks..the remote workstation is ultimately where the spectra is displayed...you can also send that data to plot.ly to share it on the internet either from the workstation or a smart phone or other portable device.. You can also configure ramanPi to tweet your latest data when you're done! If you're looking at ramanPi in the IoT (internet of things) perspective... then set up the system with a flow cuvette and set up a job to do a periodic sample of your homes incoming water supply, and then have it post that data to twitter and plot.ly when it detects abnormal levels of dangerous compounds! There's a ton of applications where you could configure ramanPi to monitor dangerous levels of certain compounds and alert you...how about a text message or email when your home brew is just right or has gone bad!?!?!

Please read more about how raman spectroscopy and this system works!

The following is from wikipedia on Raman Spectroscopy: link
Raman spectroscopy
From Wikipedia, the free encyclopedia
Raman spectroscopy (/ˈrɑːmən/; named after Sir C. V. Raman) is a spectroscopic technique used to observe vibrational, rotational, and other low-frequency modes in a system.[1] It relies on inelastic scattering, or Raman scattering, of monochromatic light, usually from a laser in thevisible, near infrared, or near ultraviolet range. The laser light interacts with molecular vibrations,phonons or other excitations in the system, resulting in the energy of the laser photons being shifted up or down. The shift in energy gives information about the vibrational modes in the system. Infrared spectroscopy yields similar, but complementary, information.
Typically, a sample is illuminated with a laser beam. Light from the illuminated spot is collected with a lens and sent through a monochromator. Wavelengths close to the laser line due to elastic Rayleigh scattering are filtered out while the rest of the collected light is dispersed onto a detector.
Spontaneous Raman scattering is typically very weak, and as a result the main difficulty of Raman spectroscopy is separating the weak inelastically scattered light from the intense Rayleigh scattered laser light. Historically, Raman spectrometers used holographic gratings and multiple dispersion stages to achieve a high degree of laser rejection. In the past,photomultipliers were the detectors of choice for dispersive Raman setups, which resulted in long acquisition times. However, modern instrumentation almost universally employs notch or edge filters for laser rejection and spectrographs either axial transmissive (AT), Czerny–Turner (CT) monochromator, or FT (Fourier transform spectroscopy based), and CCD detectors.
There are a number of advanced types of Raman spectroscopy, including surface-enhanced Raman, resonance Raman, tip-enhanced Raman, polarised Raman, stimulated Raman (analogous to stimulated emission), transmission Raman, spatially offset Raman, and hyper Raman.
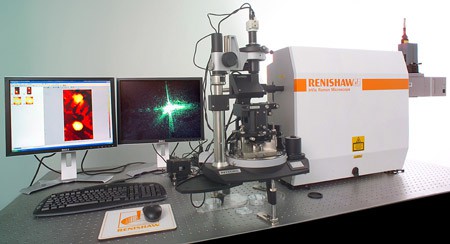
A Raman Spectrometer at Monash University
A simple example similar to my system…

I just want to make a note about safety here, before reading on...
You will probably want to seriously consider eye protection before working with lasers...especially if you go for the 150mw laser...your eyes are important...


So basically,
1. There is a 150mw 532nm laser…
2. The laser shines through a 532nm pass filter which only allows the 532nm laser light through…this cleans up any instability in the laser due to it's eBayness and whatever temperature variations, etc..
2a. The beam goes through and may be stopped by the laser shutter.. The laser shutter is a servo operated 3D printed device that allows the beam to be stopped without the laser being shut off...This is useful for opening the cuvette tray, or changing filters in between exposures.
3. The laser beam then passes through the cube beam splitter..half is deflected into oblivion and the rest goes straight through to our next stop..

4. The laser having gone through the cube beam splitter travels into the 100x microscope objective lens..then focuses the beam down to a very small point at our next stop….

5. The cuvette holding the sample..be it water, coffee or whatever.. the laser light is scattered, shifted and reflected based on several details we'll outline later… some of that light makes it back through the microscope objective lens and is collimated back toward the cube beam splitter…
 |  |
6. Some of the reflected and scattered light enters back into the objective lens and is collimated back to the beam splitter again..
7. That light comes back and hits the cube beam splitter where half goes straight through and back into the laser..after passing through the pass filter, etc… The other half is reflected by the cube beam splitter to our next stop…
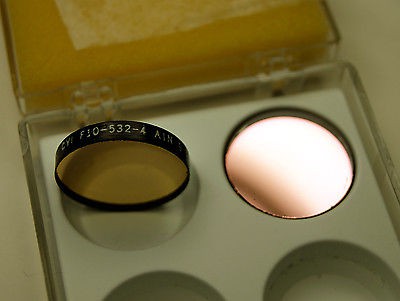
8. The retractable lens assembly..has been replaced.. but this part of the system is a cost cutting attempt because a regular notch filter is too expensive for most of us.. So instead of using a normal notch filter, I use two pass(edge) filters…. The new design now uses a rotating wheel with the filters mounted around the center..
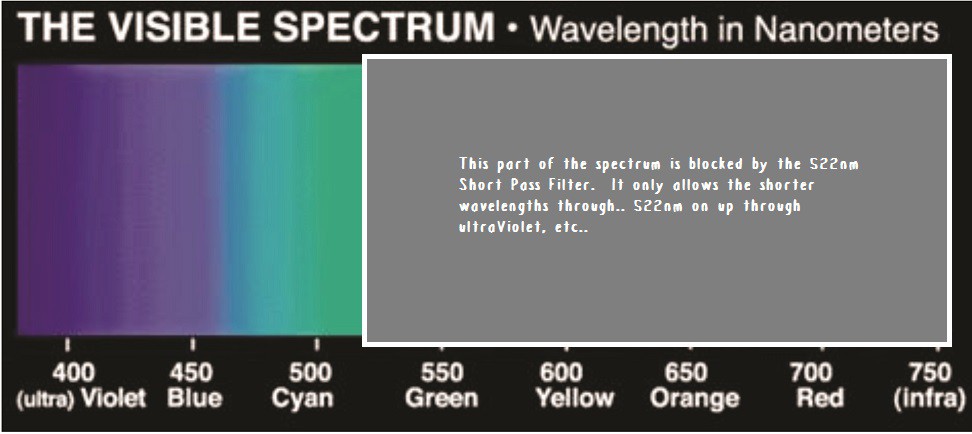
The first pass filter is the 522nm short pass filter.. This filter cuts out any light from 522nm to everything longer (lower frequency – basically from 550nmGreen down through red and infrared)..
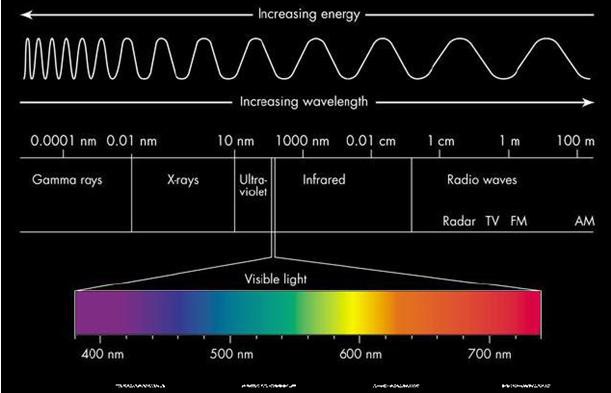
Here is a easy to follow diagram showing wavelength vs. color...
This graph shows the transmission qualities of the 522nm short pass filter at the various frequencies(colors)….Transmission percentage sharply rises at 522nm allowing only the shorter wavelengths.. blues up through ultraViolet, etc..
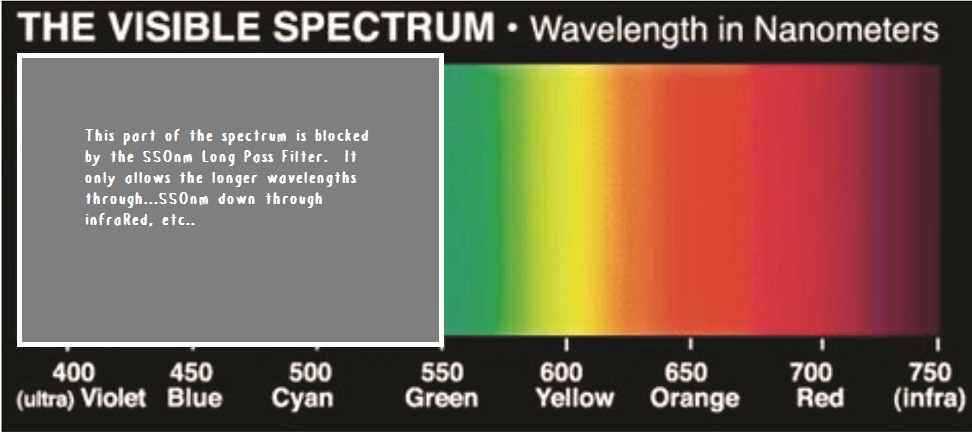
Then once an exposure is taken with that filter, it is moved it out of the way and then the 550nm long pass filter is rotated into the beam.. This filter cuts out any light from 550nm to everything shorter (higher frequency – basically from 522nmGreen up through violet and UV)…
This graph shows the transmission qualities of the 550nm long pass filter at the various frequencies(colors)… Transmission percentage sharply rises at 550nm down through 640nm and on to infraRed etc…
Another exposure is taken with this filter in place and then this information is processed..we'll get to that later..but basically what is left over is a small range in the middle between 522nm and 550nm that is filtered out… and everything else gets to pass through…
This is done because you want to get rid of the 532nm laser light and see what light has shifted as a result of being exposed to our sample.. Read more on raman spectroscopy to understand this…
As you can see here, the result is an overlap in the middle right at our 532nm wavelength… The combination of these filters creates a blocked dead zone…a little wider than is perfect…about 28nanometers…but is pretty good for the cost savings we achieved..
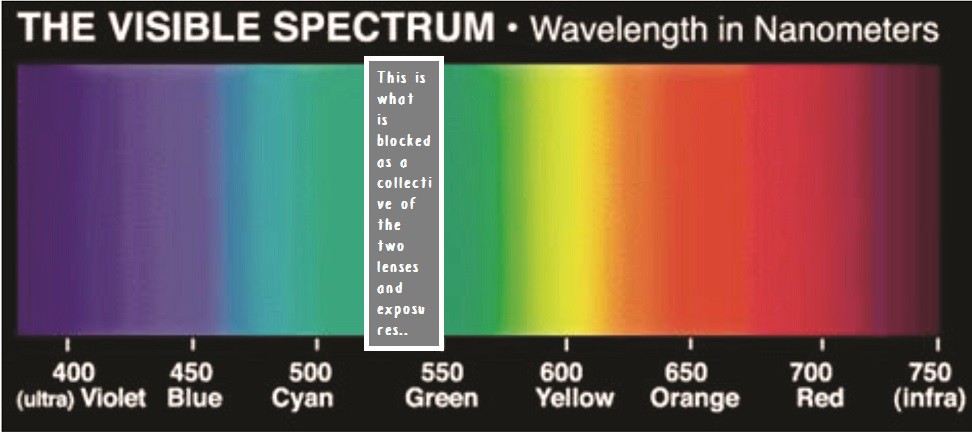
The laser light lives right in the middle (mostly) of the overlapping blocked region..effectively cutting out any laser light from passing on to the diffraction grating and sensor…which would overwhelm it and produce unusable results.
9. The light passes through the vertical aperture (entrance slit) on its way to a collimating mirror….this prevents the light from entering at a range of angles.. allowing you to determine the position of a spectral line..
10. The collimating mirror basically reflects and directs the light in one direction to our next stop…
11. That light is then reflected off of the reflective grating surface…Diffraction grating, etc.. This spreads the light into an evenly spaced rainbow... onto the next stop...
12. The imaging mirror... This mirror reflects and collimates the spectrum onto the CCD array in a linear spectra..
13. The Linear CCD Array.. The spectra is digitized here and sent to the raspberryPi for processing..
15. So from there image stacking is done, then some software analysis and a spectra is derived from whatever chemical you've tested.. It's all quite nice..

 ramanPi by fl@C@ is licensed under a Creative Commons Attribution-ShareAlike 4.0 International License.
Based on a work at https://hackaday.io/project/1279-ramanpi-raman-spectrometer.