Light availability is an important characteristic of aquatic ecosystems and is particularly important for photosynthesizing organisms, like submerged aquatic vegetation, and organisms which rely on them for food and/or shelter. Changes in light availability can significantly impact ecosystem functioning in both freshwater and marine environments. The causes of changes in light availability are numerous but can commonly be attributed to algal blooms, suspended sediments or dissolved substances. These phenomena can be caused by both natural events, like nutrient upwelling, or human activity, such as increases nutrient deposition (fertilizers, sewage discharge…) and sediment laden runoff from impervious surfaces. Despite the importance of light availability, directly and accurately measuring the optical properties of water is costly due to the expensive equipment required, furthermore many current instruments are large and unwieldy making operation offshore difficult without boat. PULSE will allow citizens to actively monitor important properites of their local waterbodies for changes that may have damaging ecological effects and allow for more rapid mitigation.
References
Kirk J.T.O. (2011). Light and Photosynthesis in Aquatic Ecosystems 3rd Ed. Cambridge University Press.
Design
The instrument will consist of two components: a base station and a profiler.
Base station
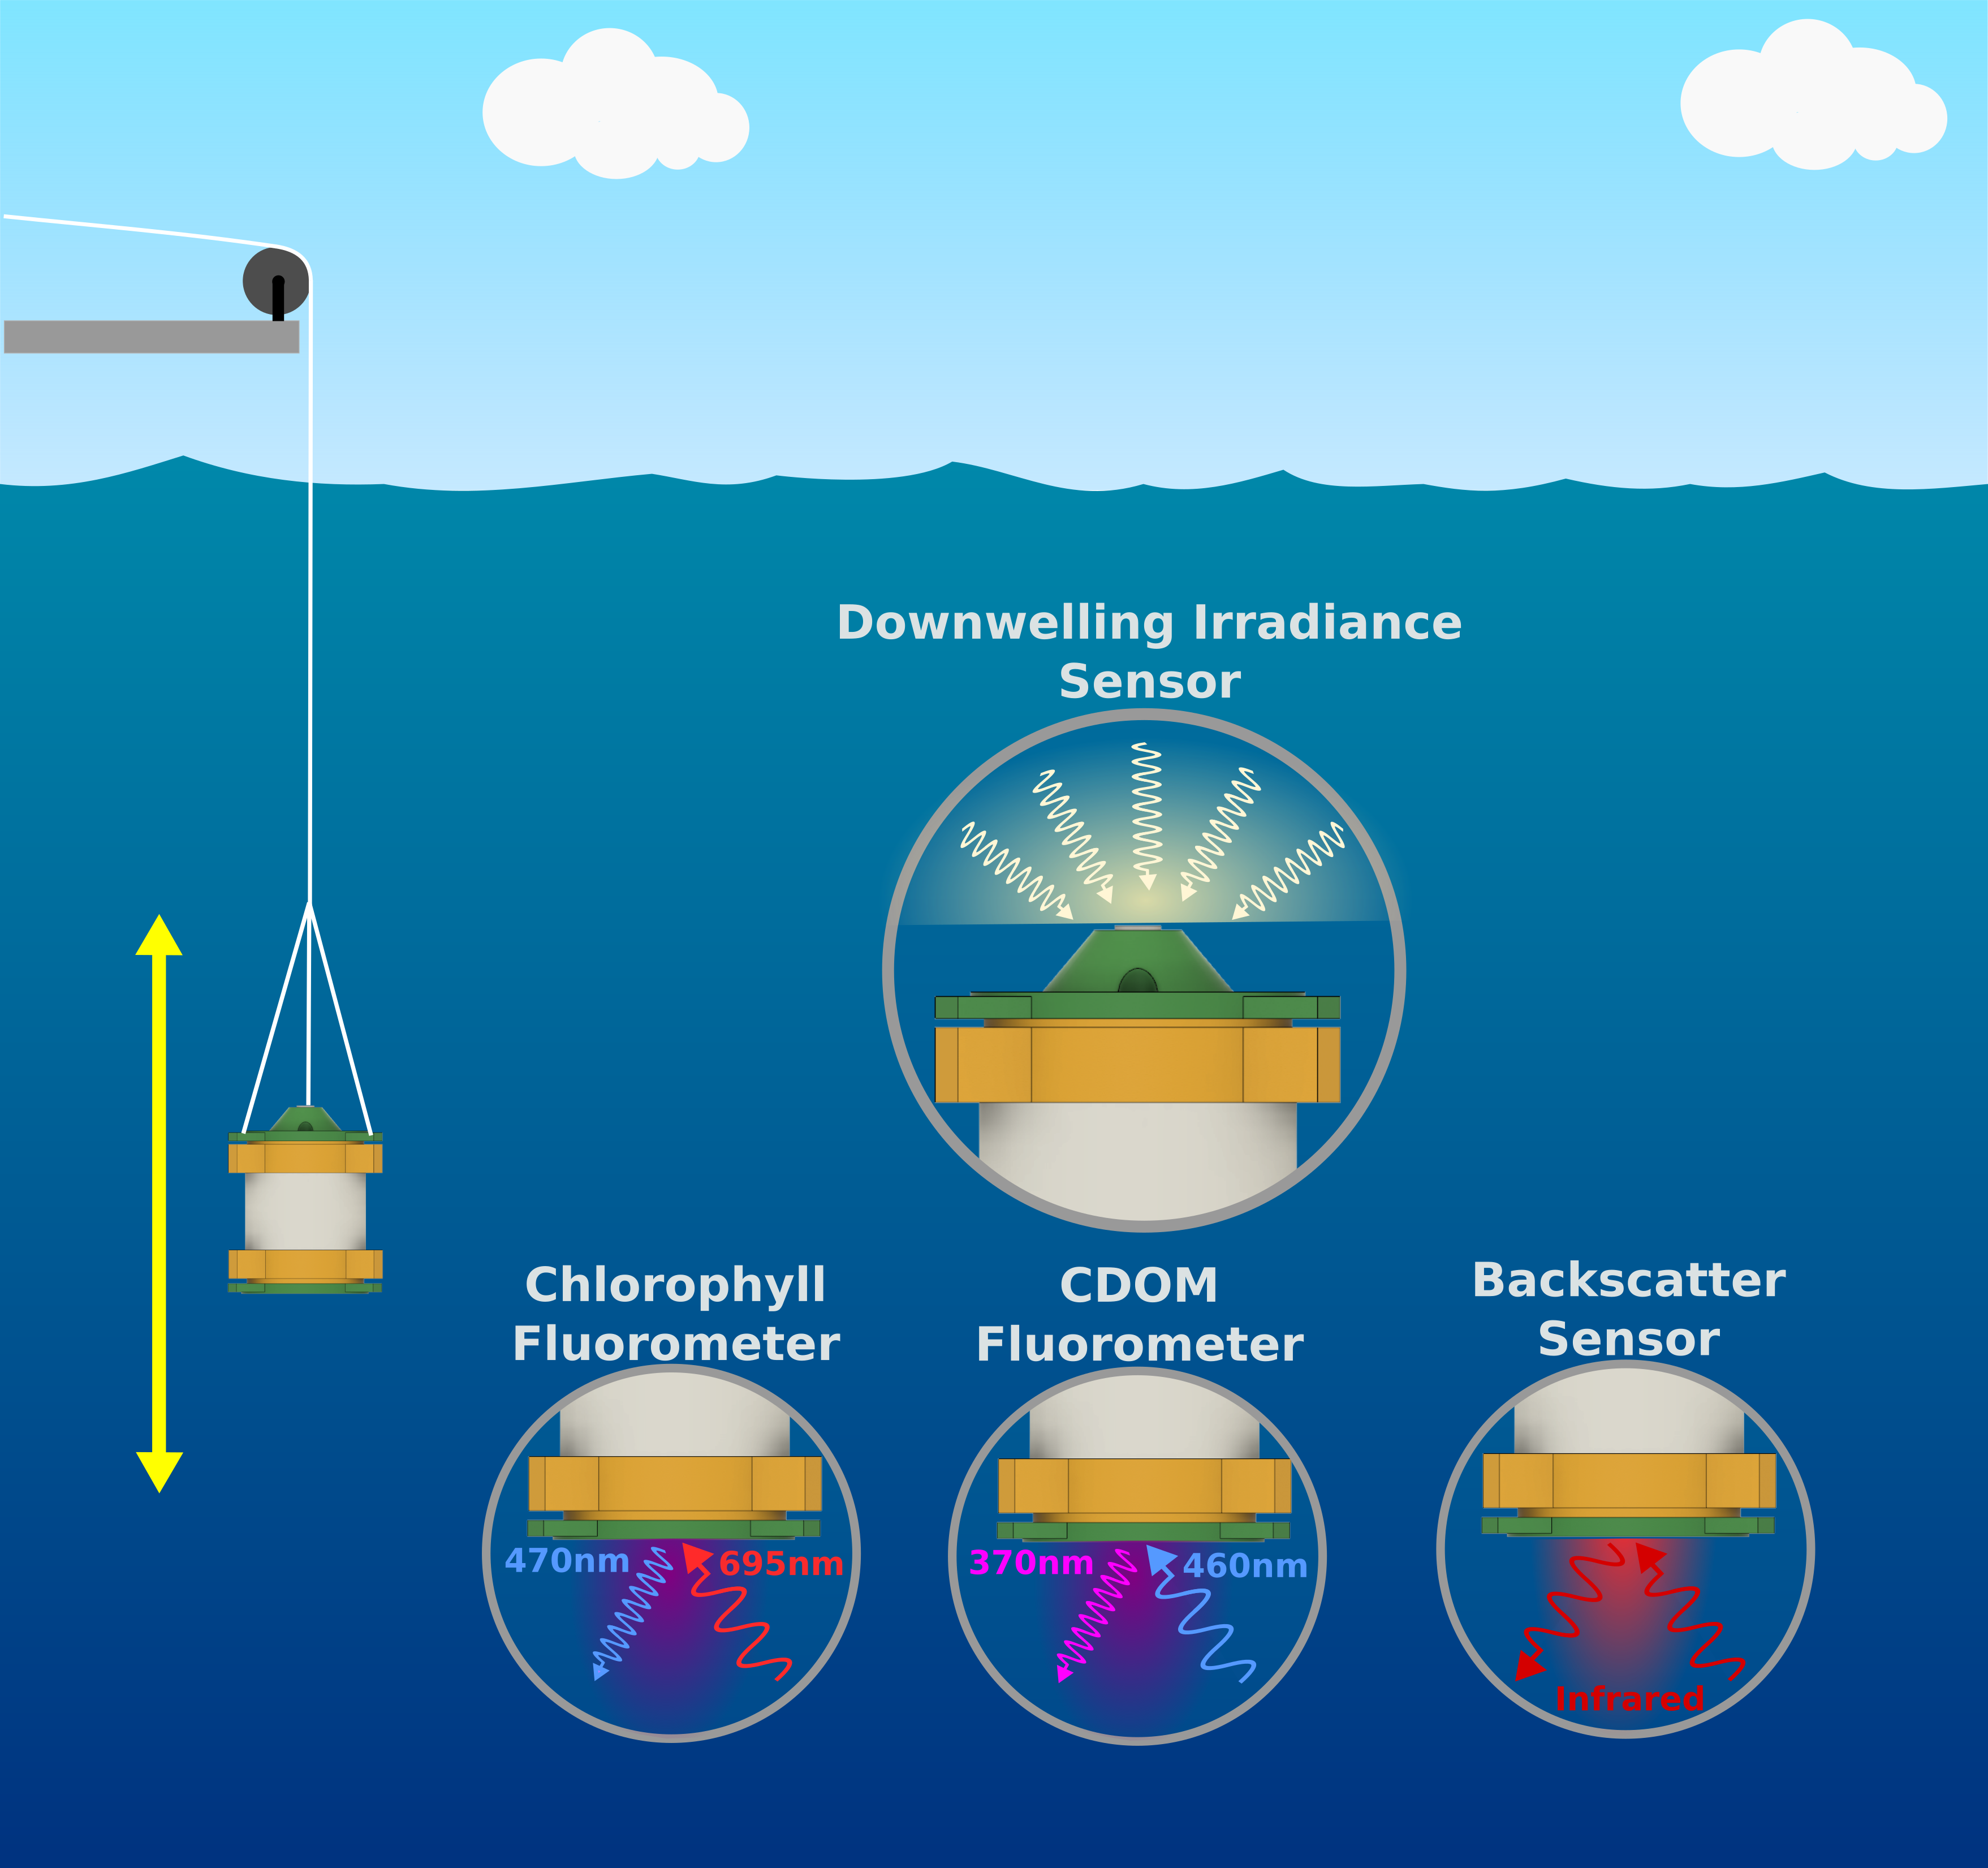
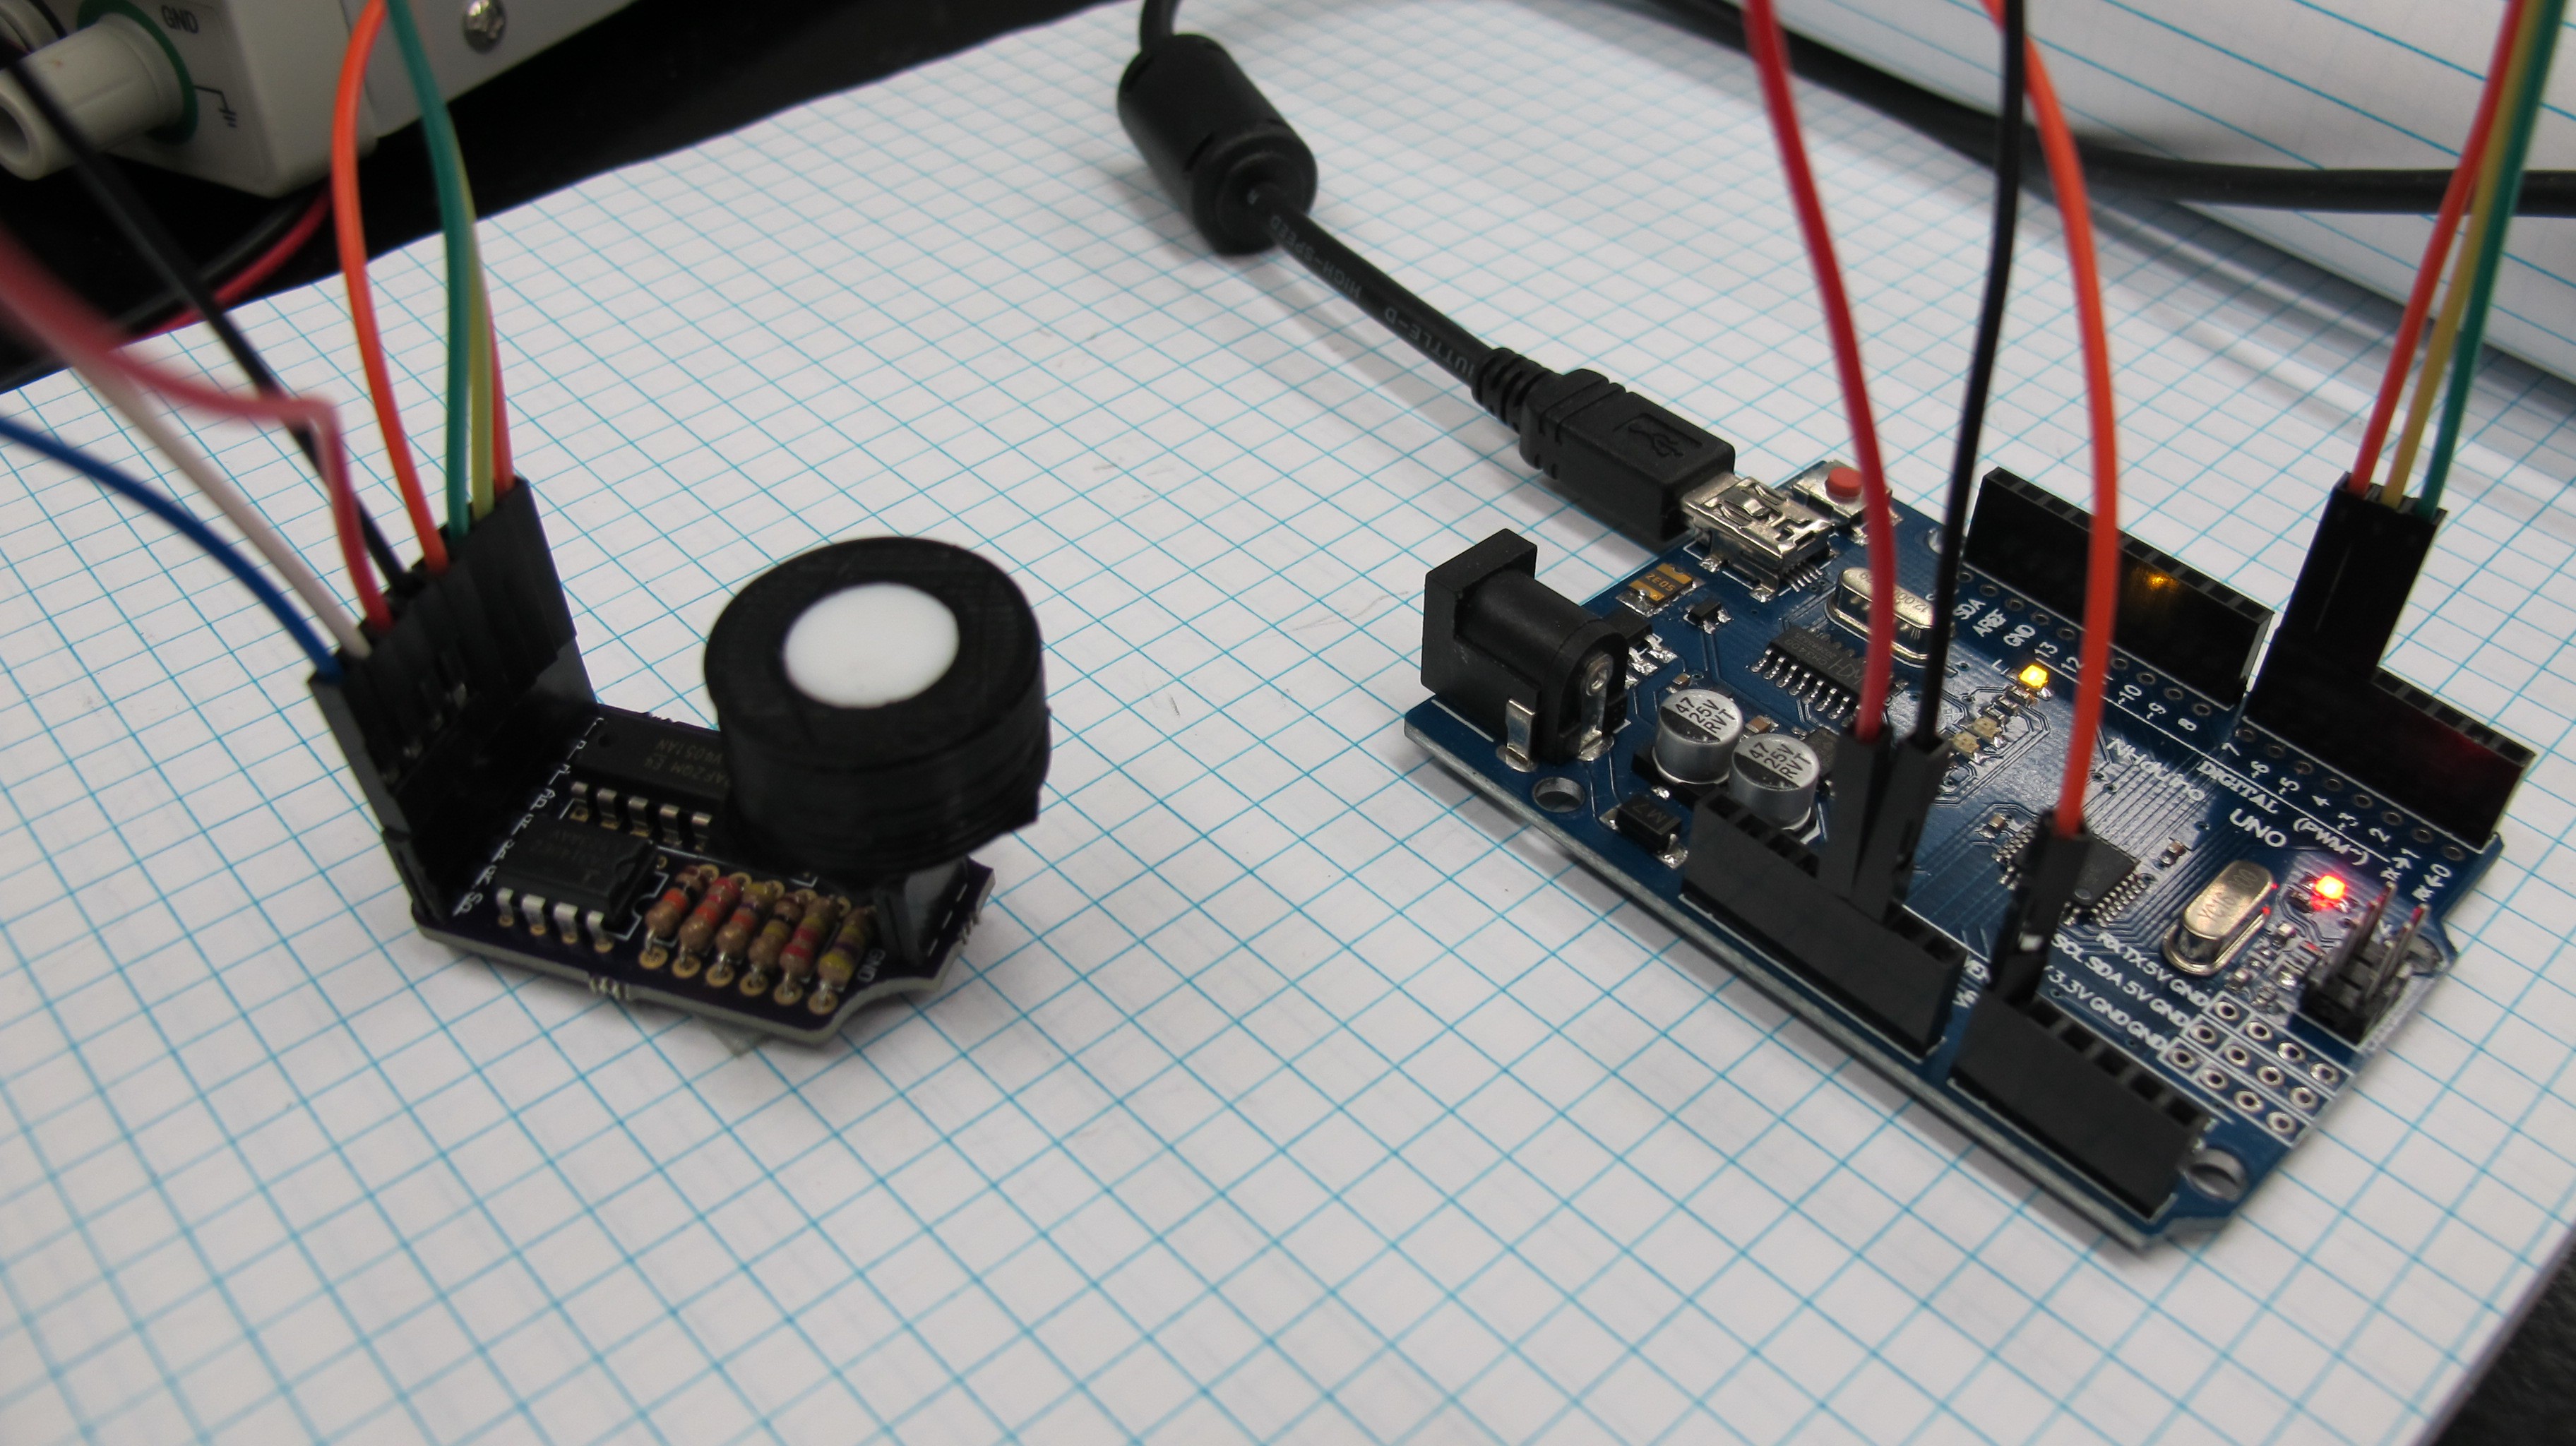
The base station serves two functions, the first is to concurrently measure light intensity at the surface while the profiler is traversing the water column and to record the measurement location using a GPS receiver. In theory, under unchanging sky conditions, a base station isn’t necessary because we can use the above water irradiance values from the profiler. However perfectly clear skies are not common therefore being able to account for these changes during measurement is important.
Profiler
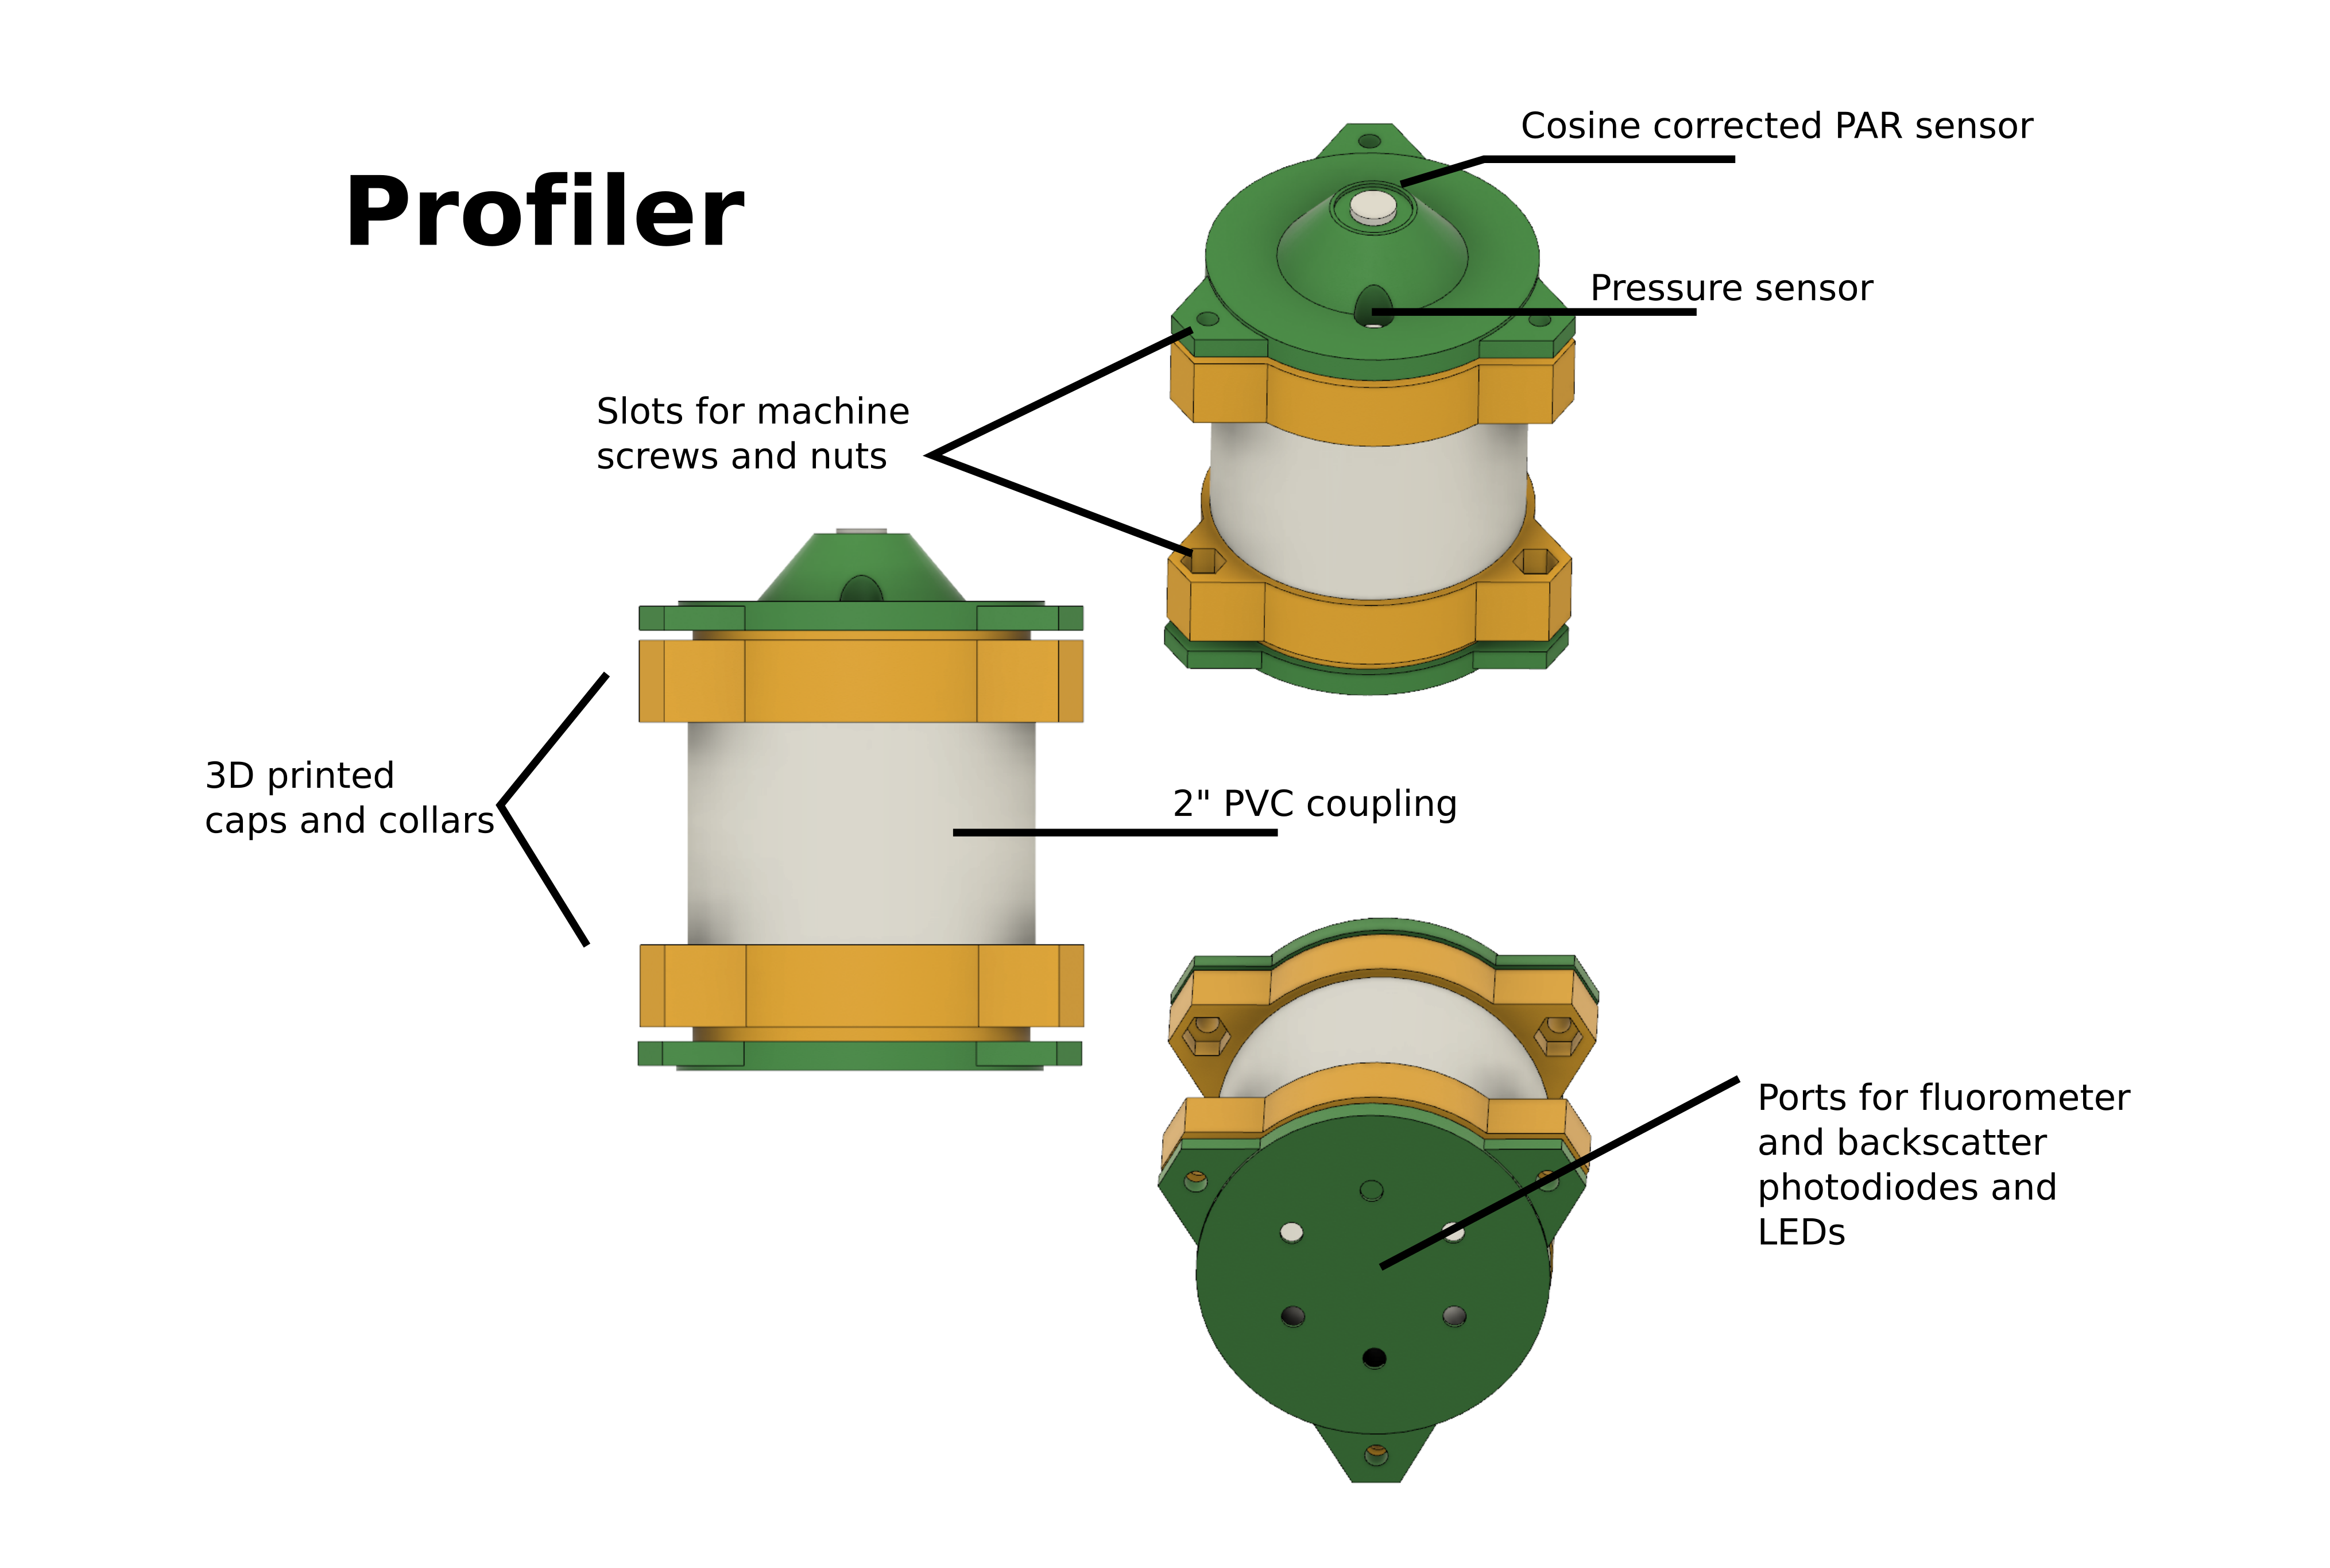
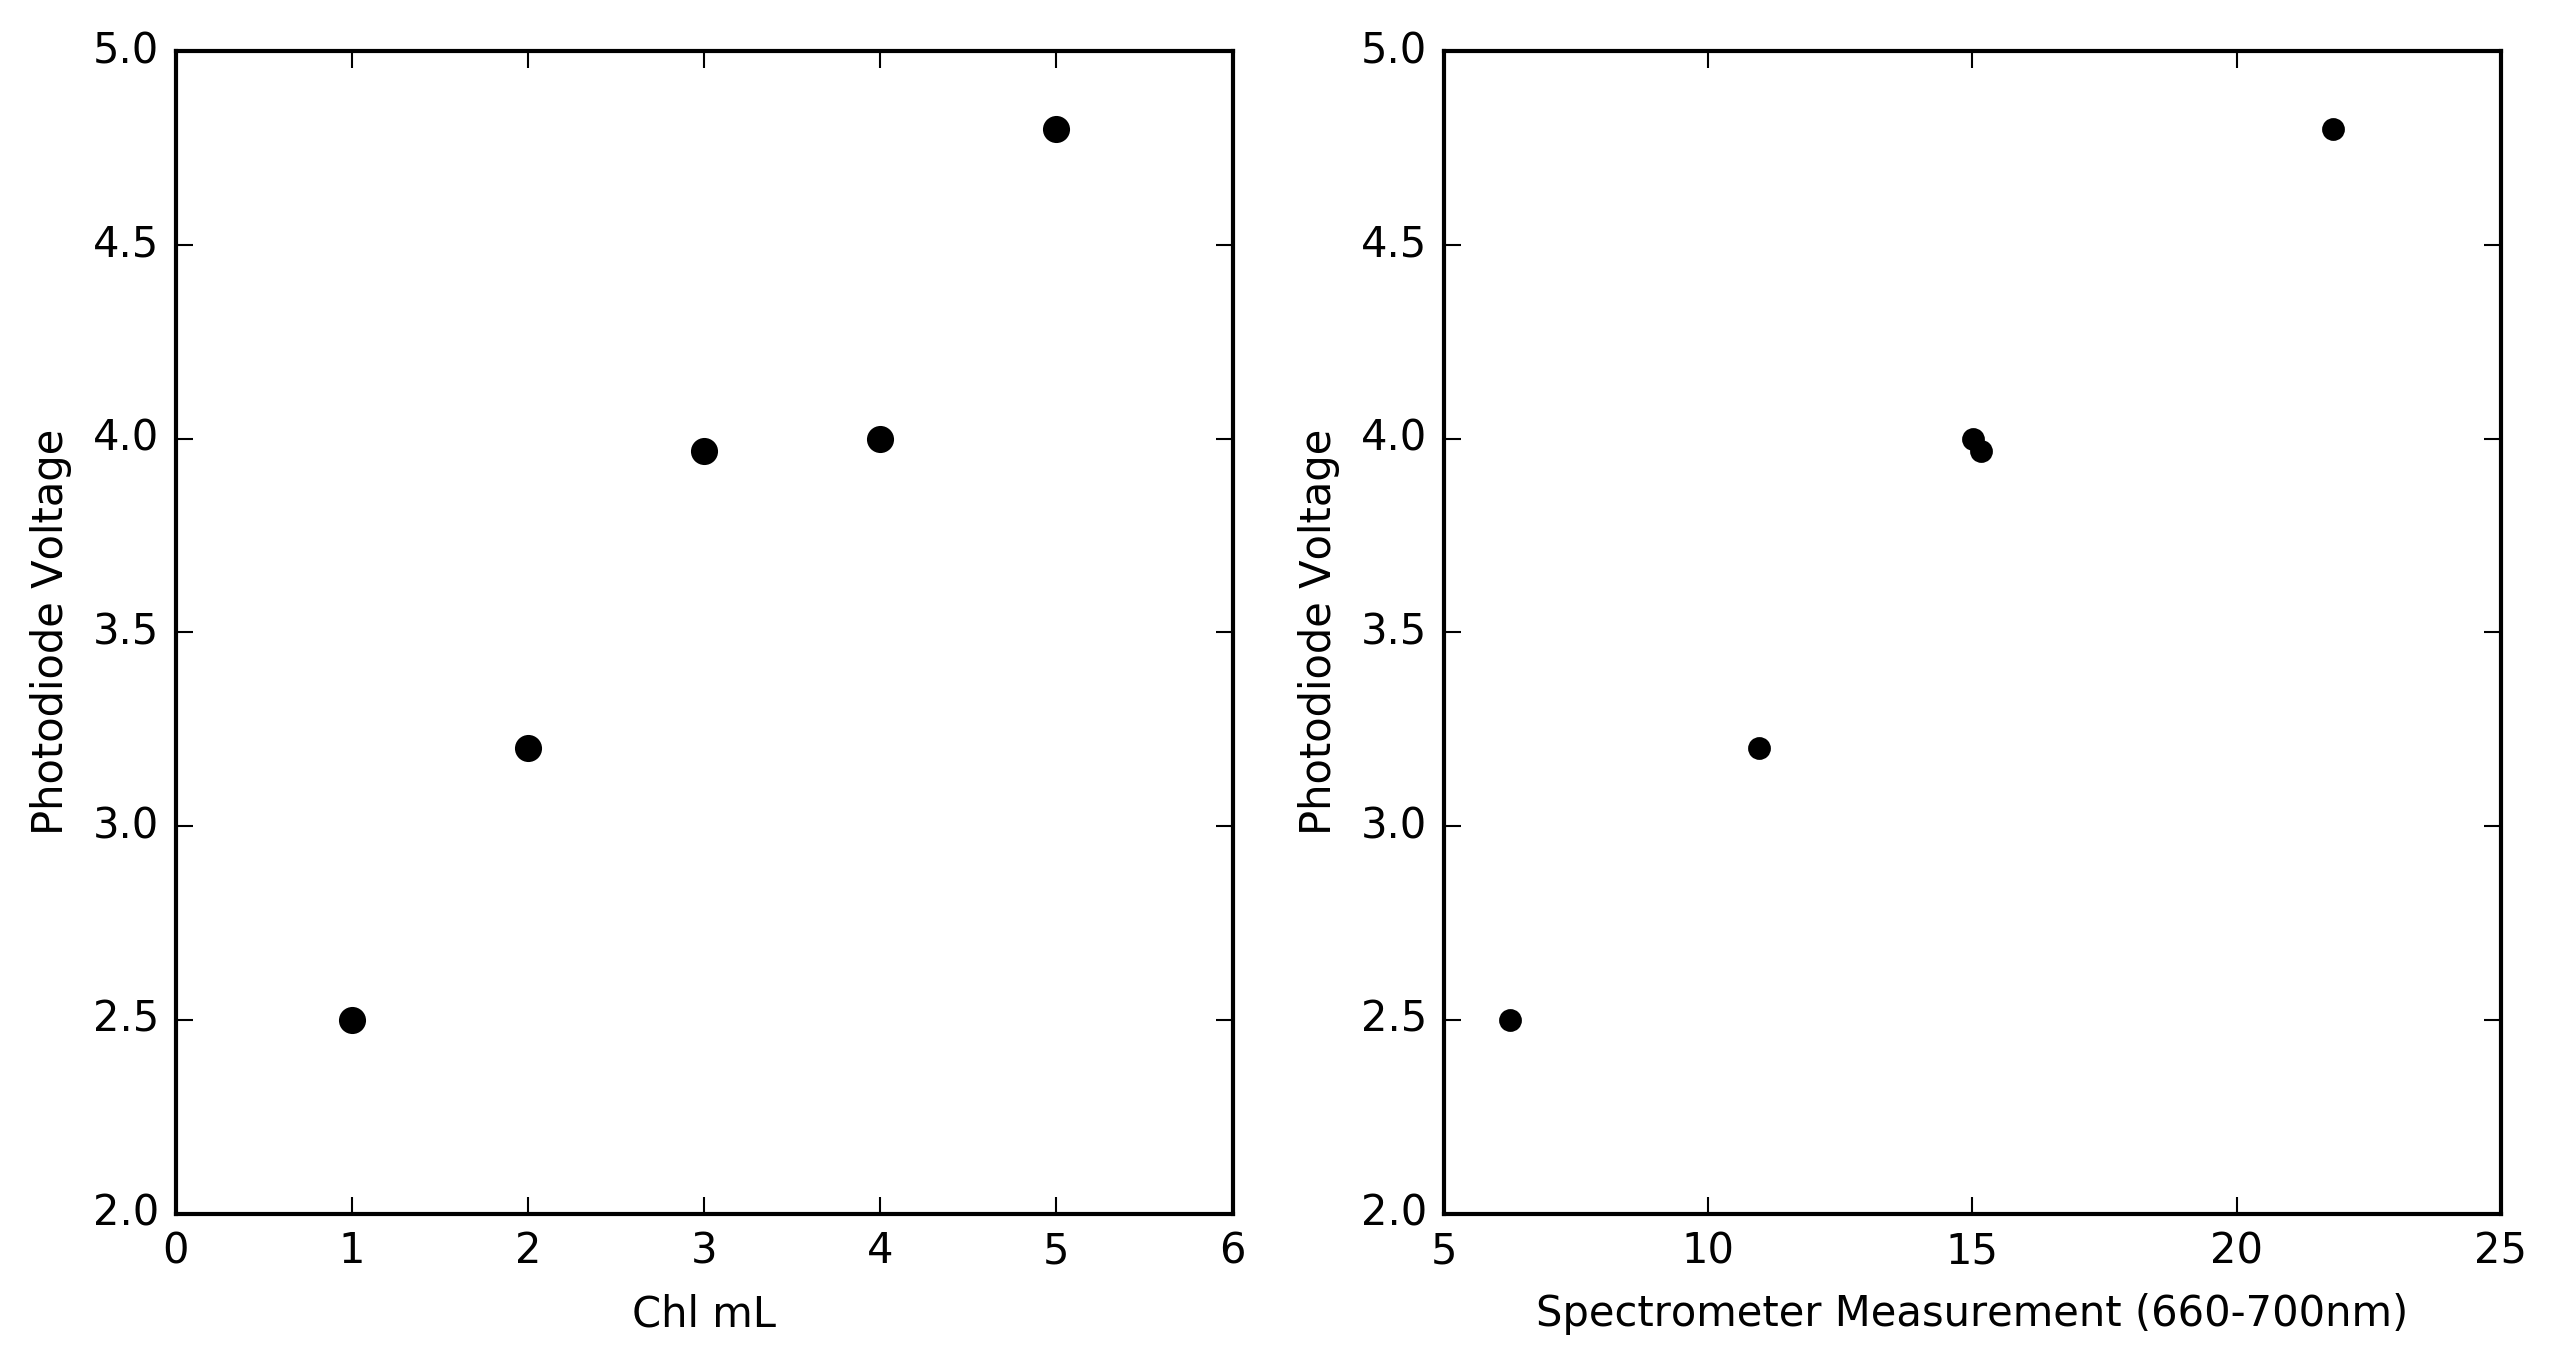
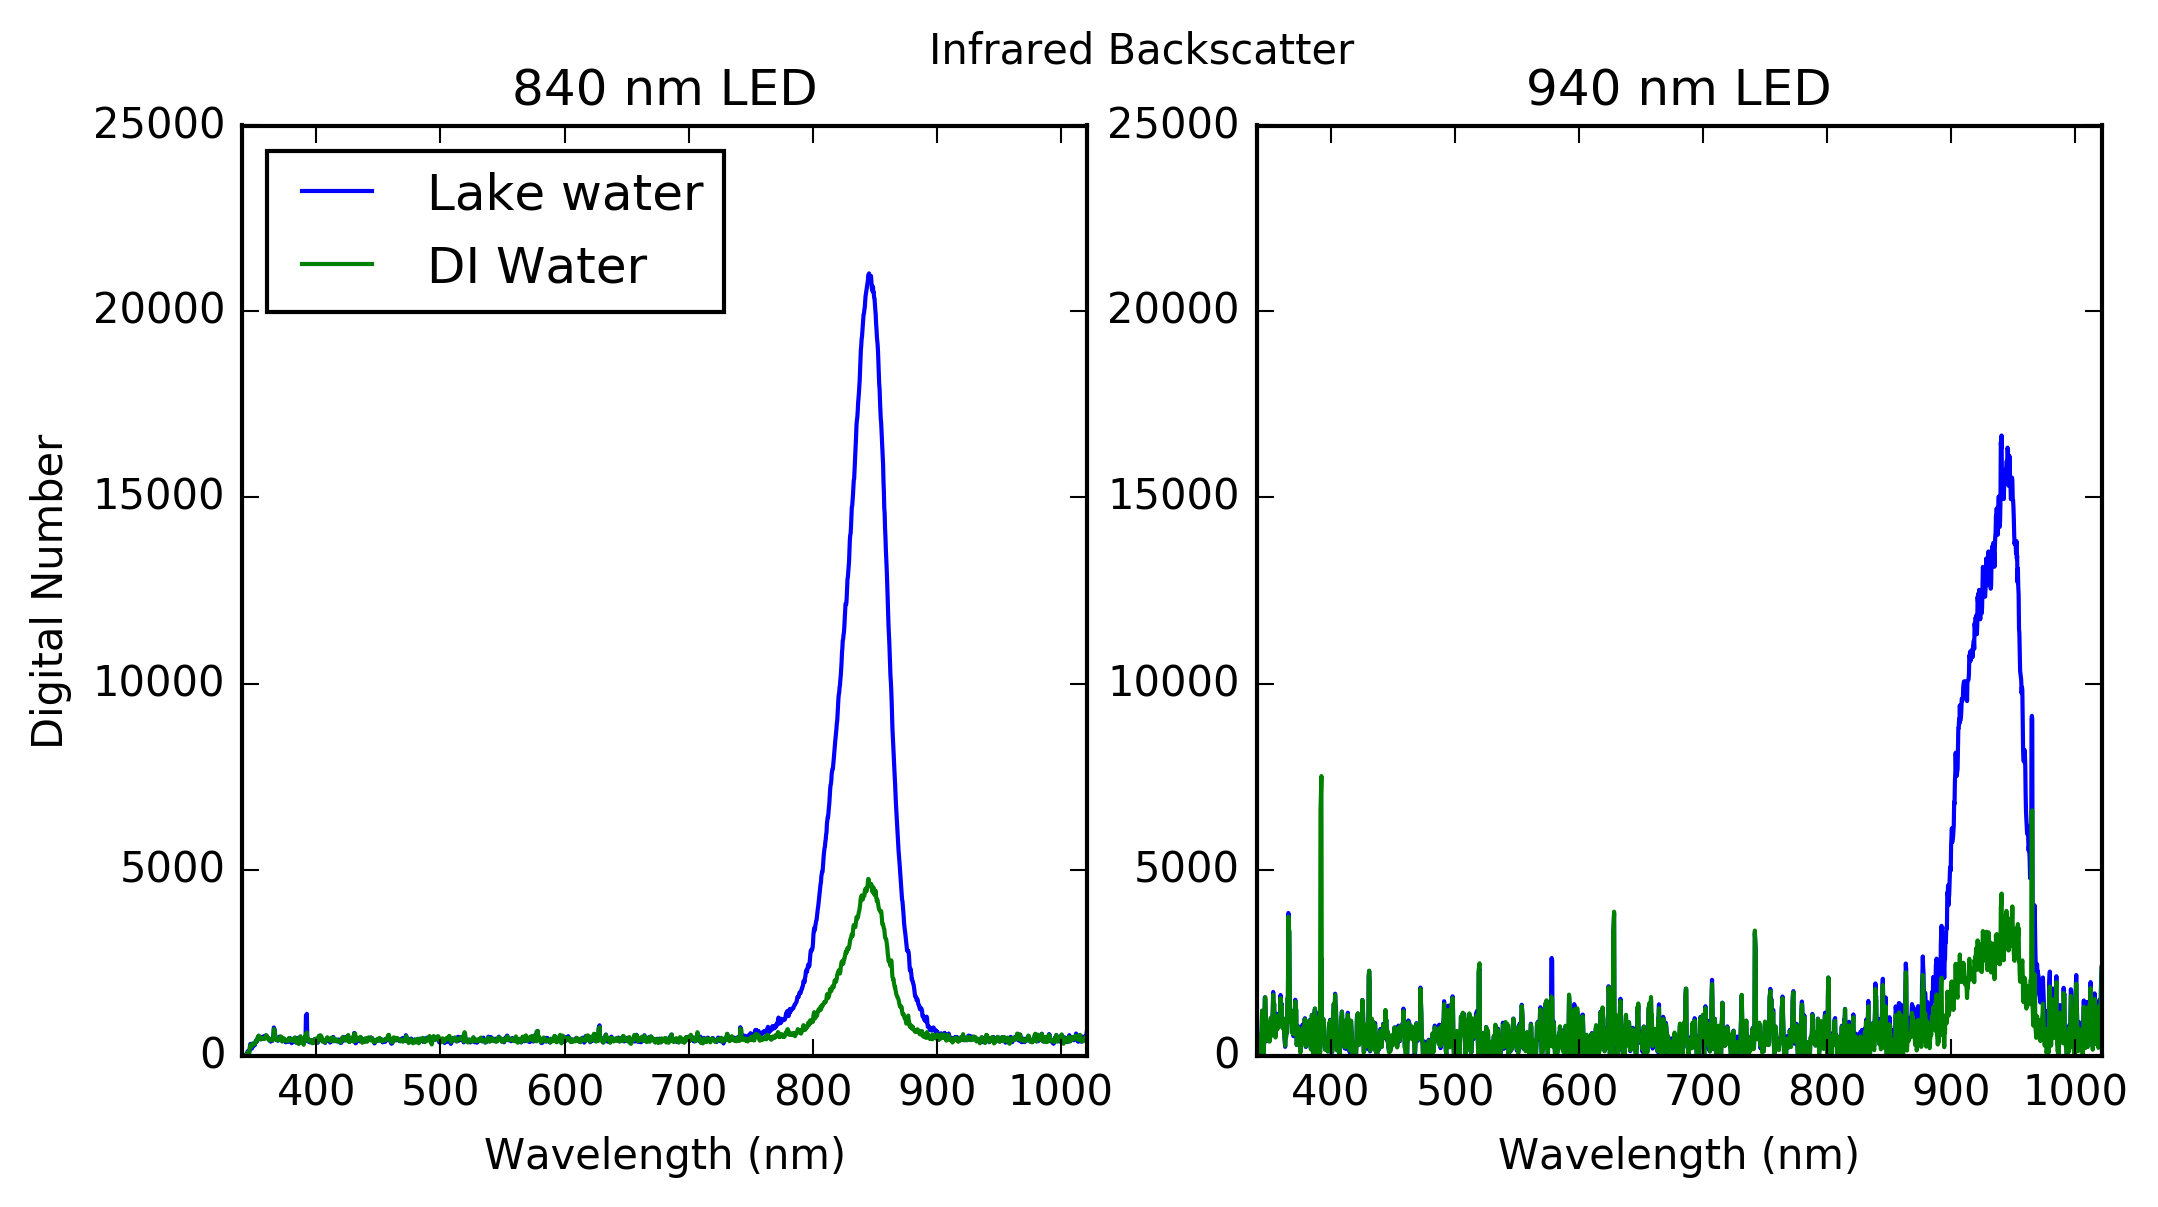
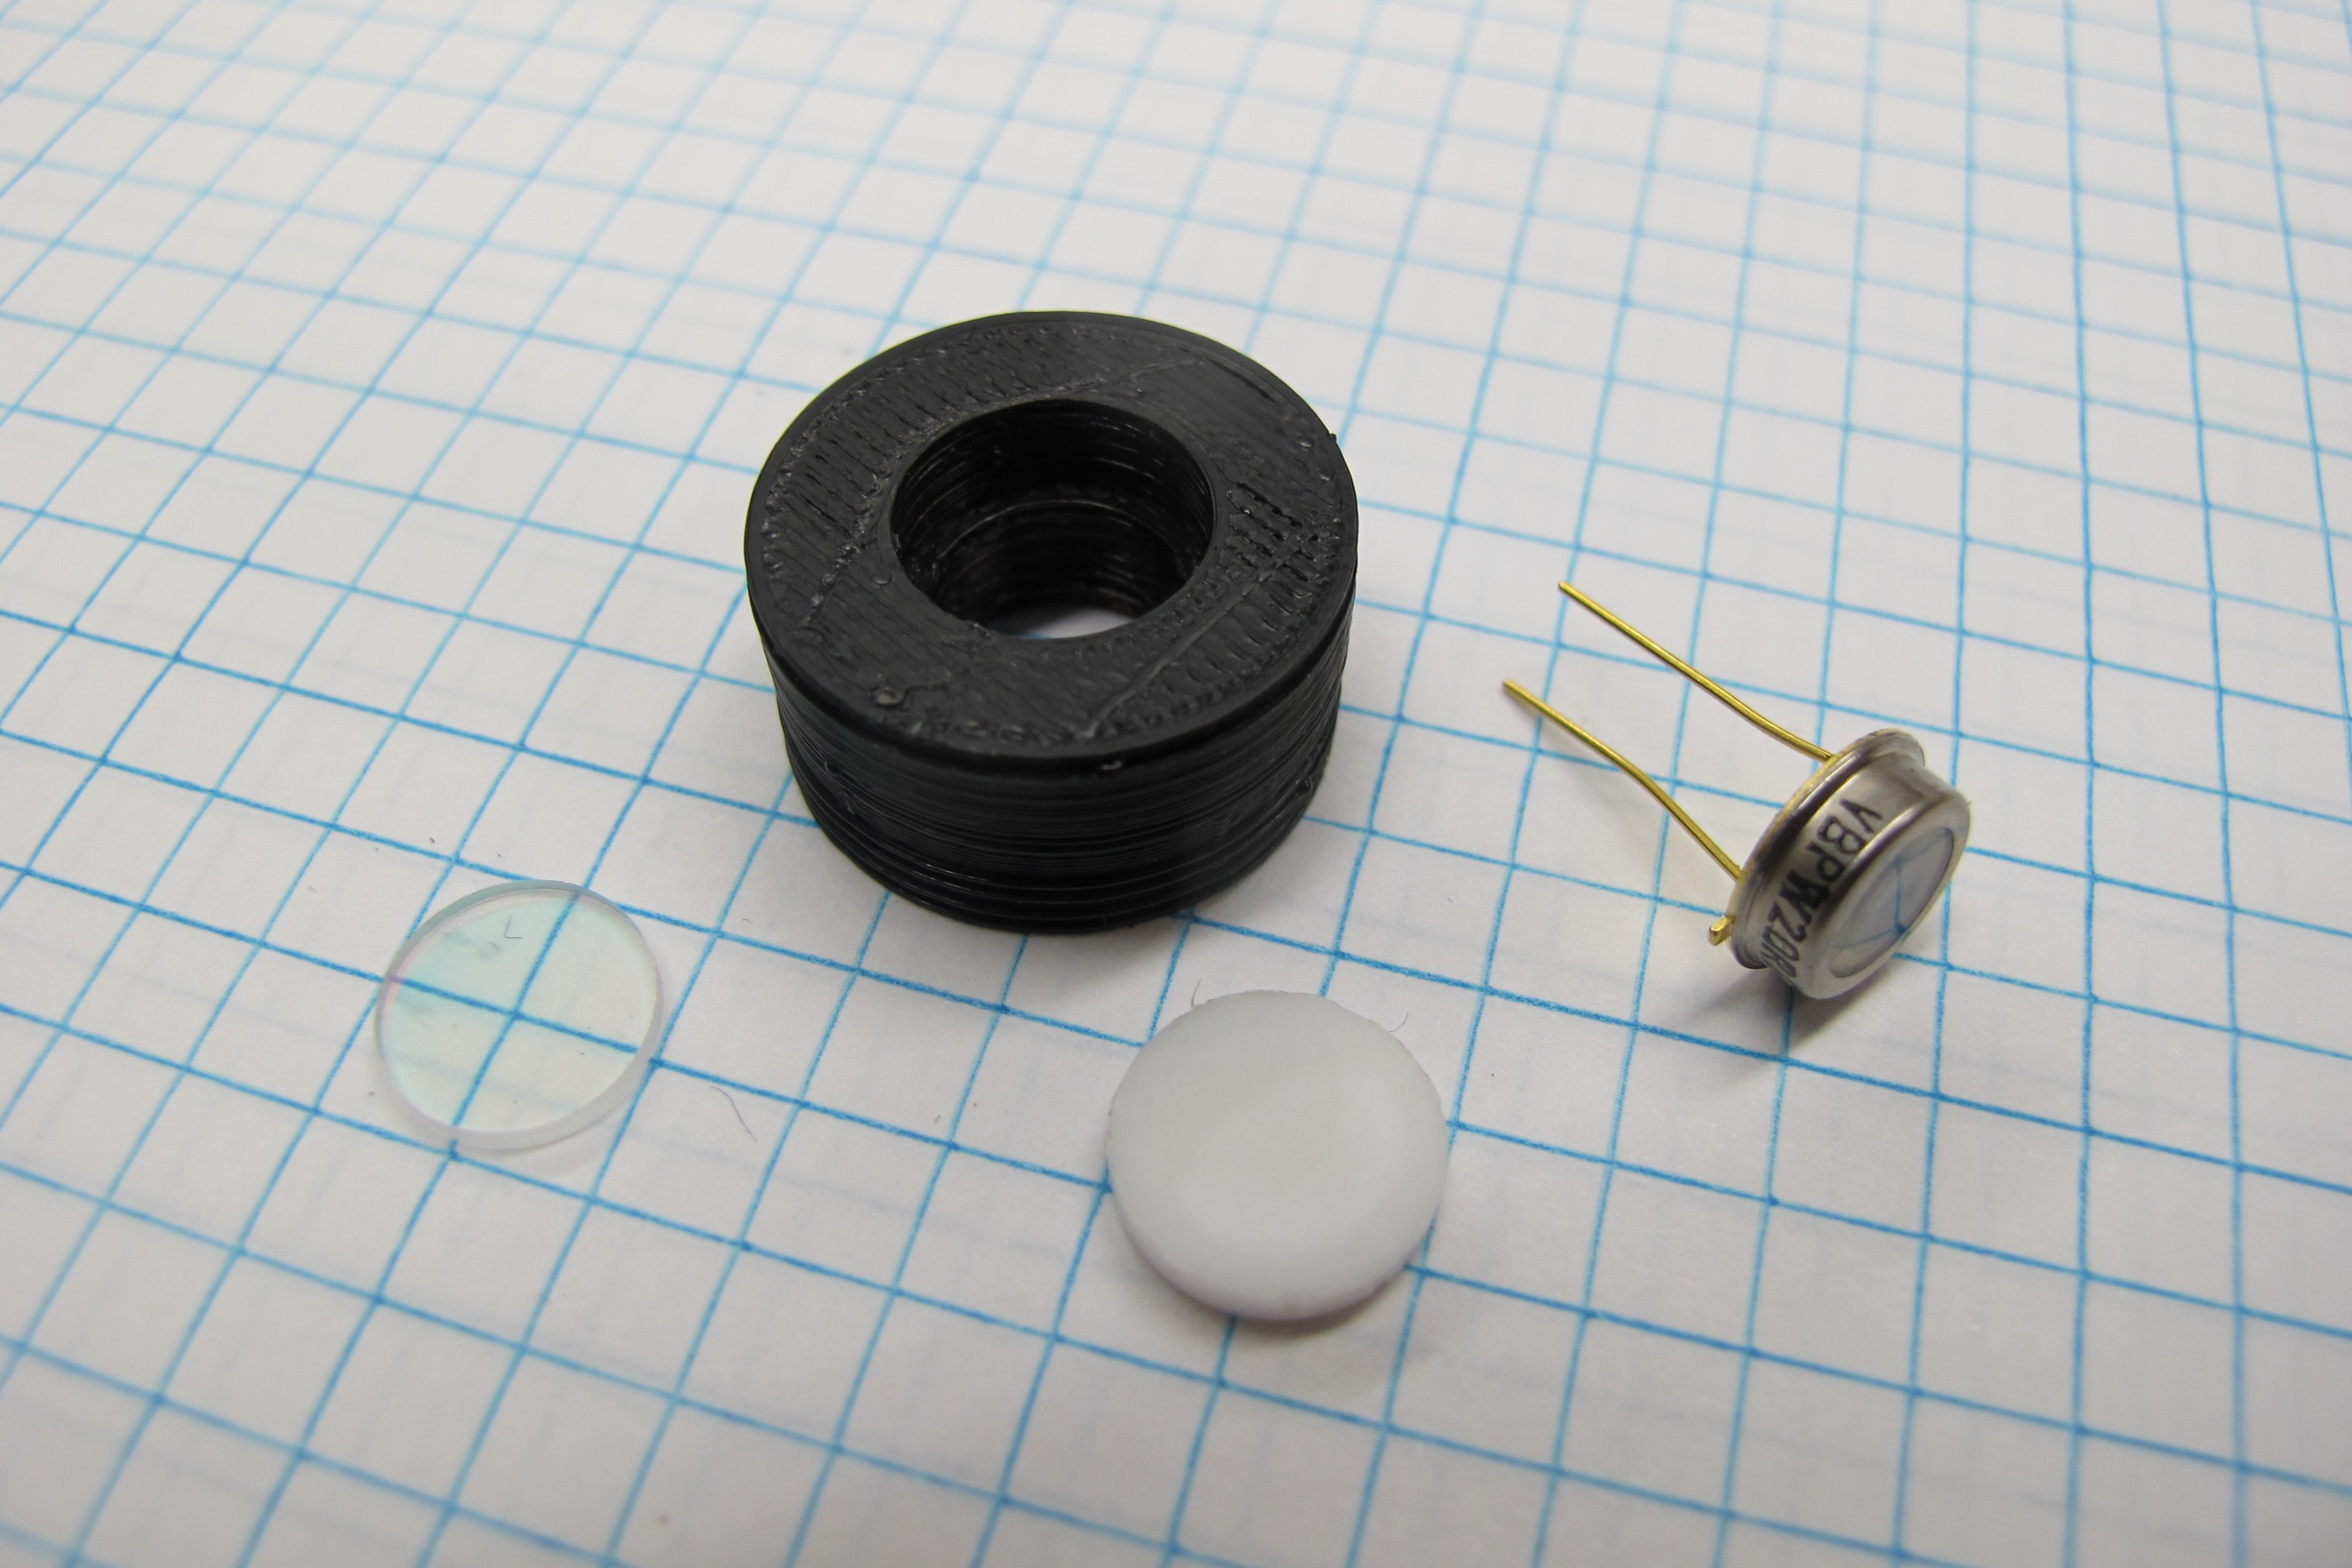
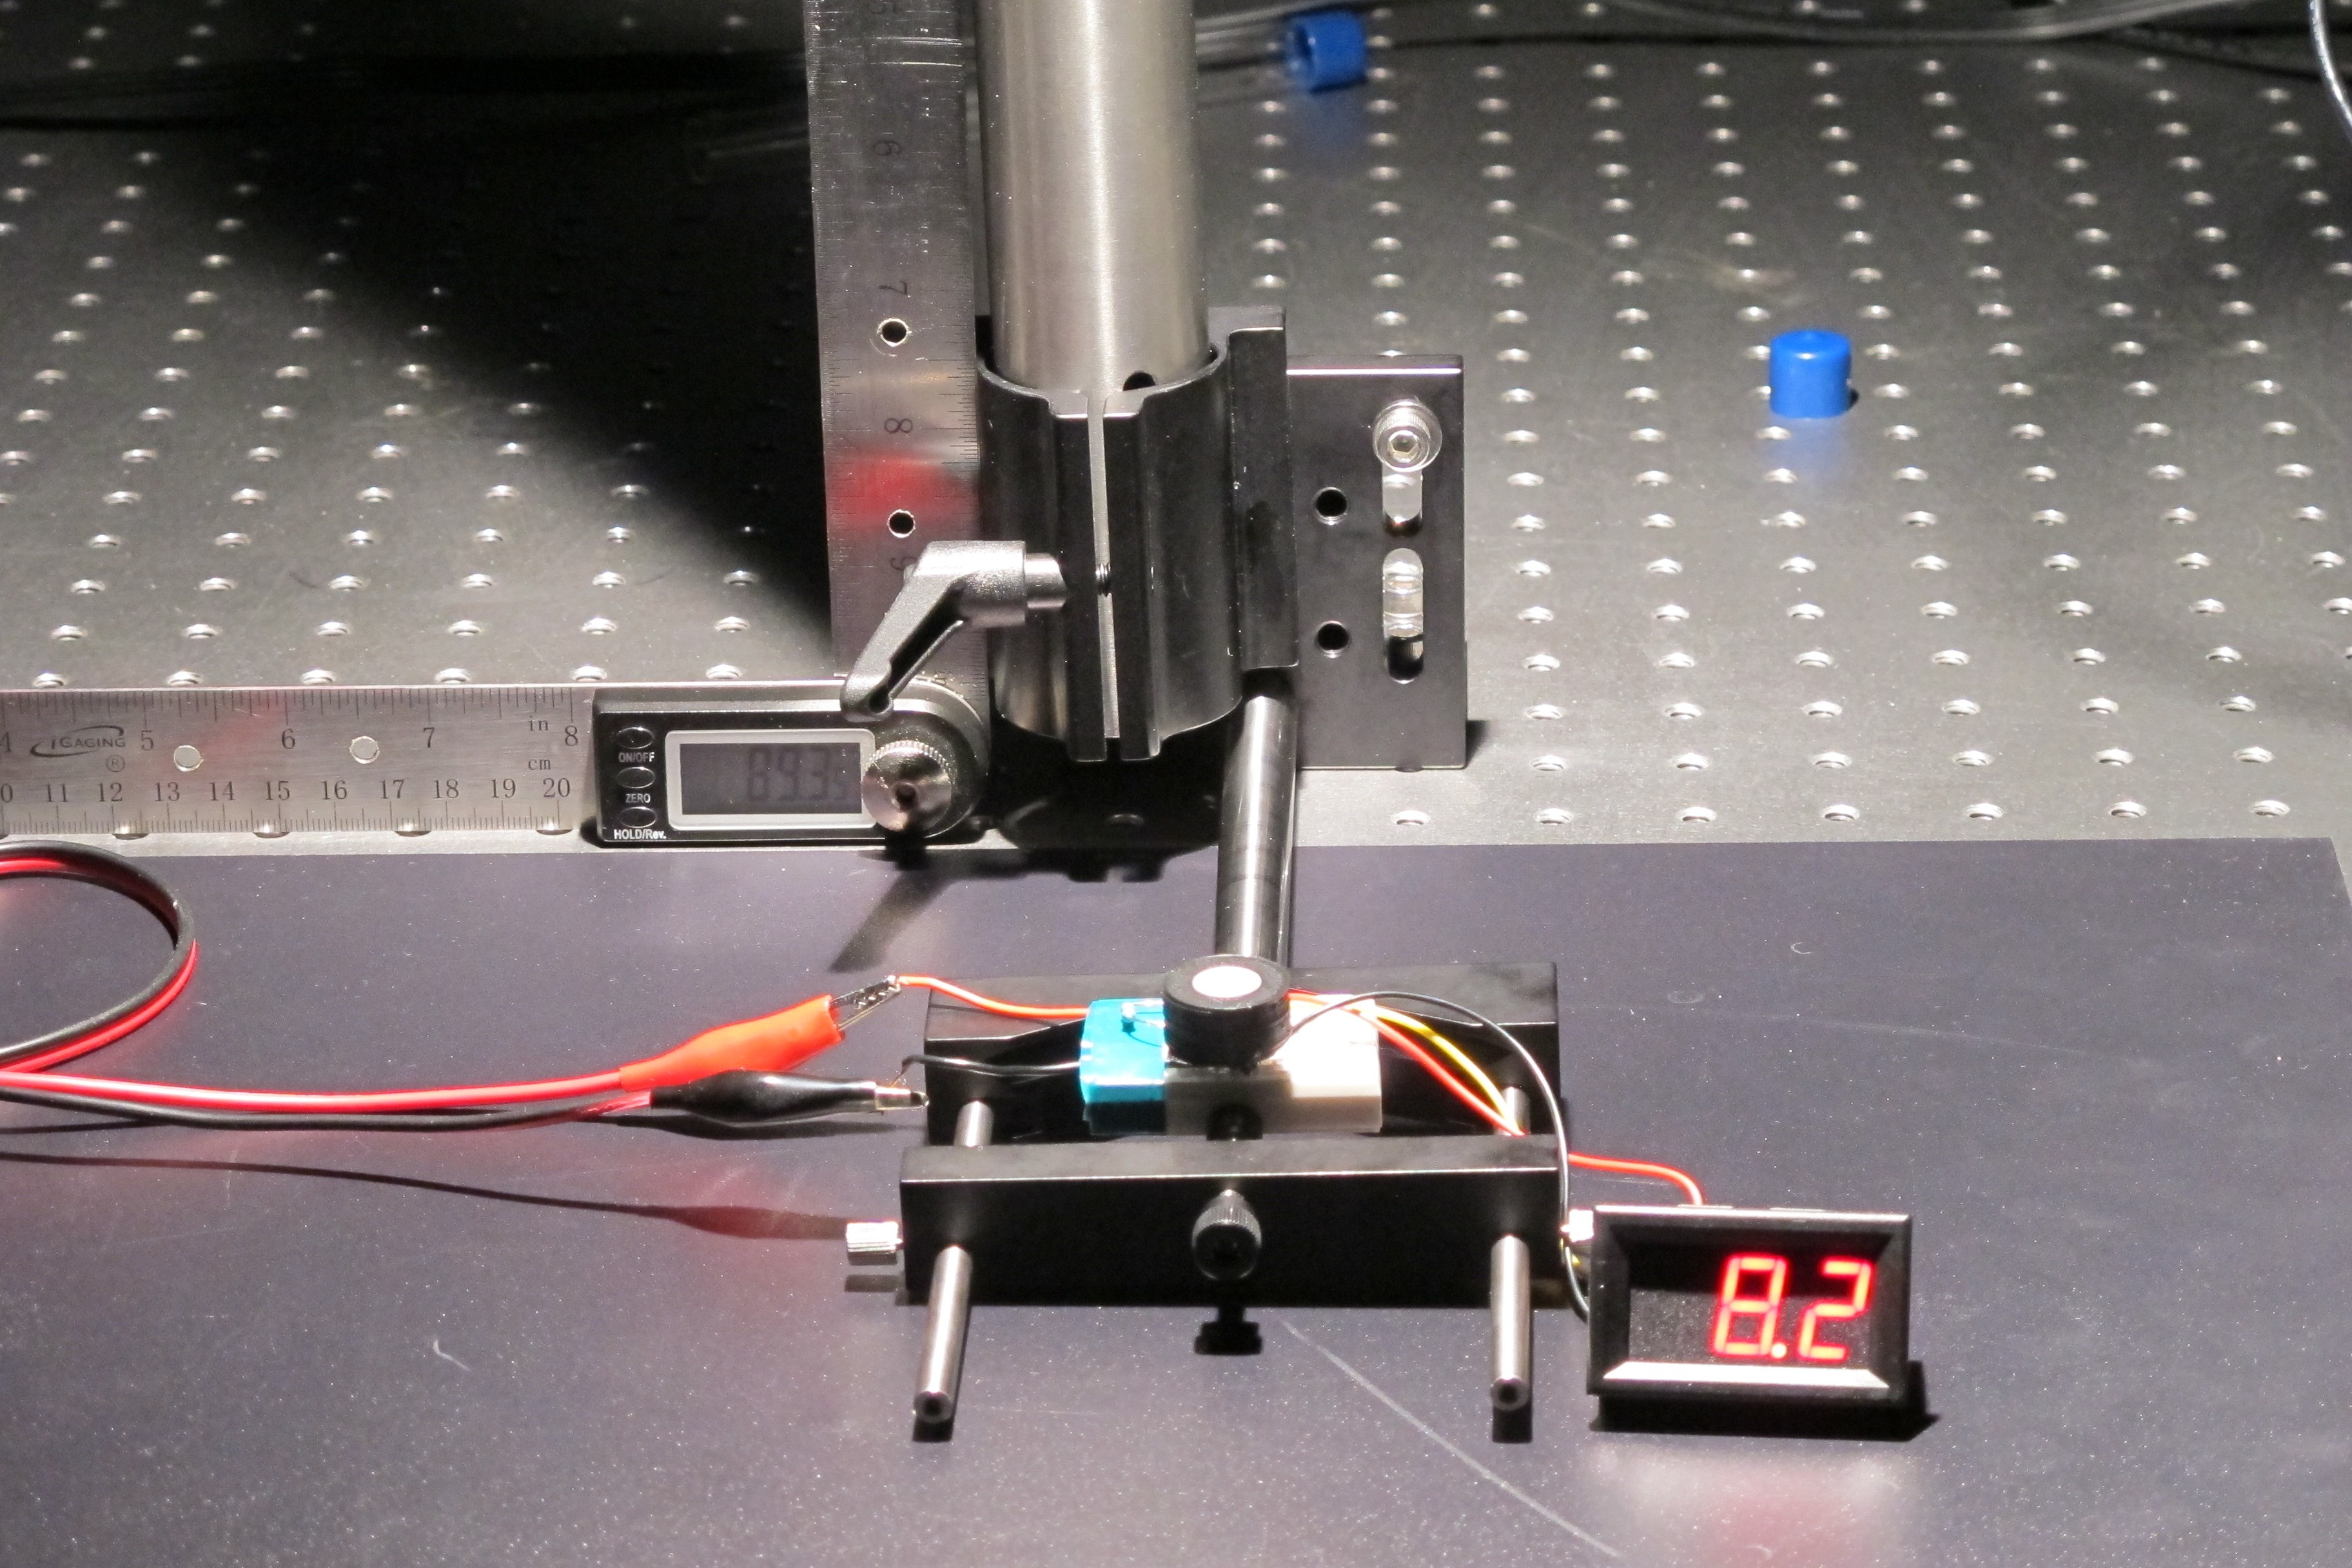
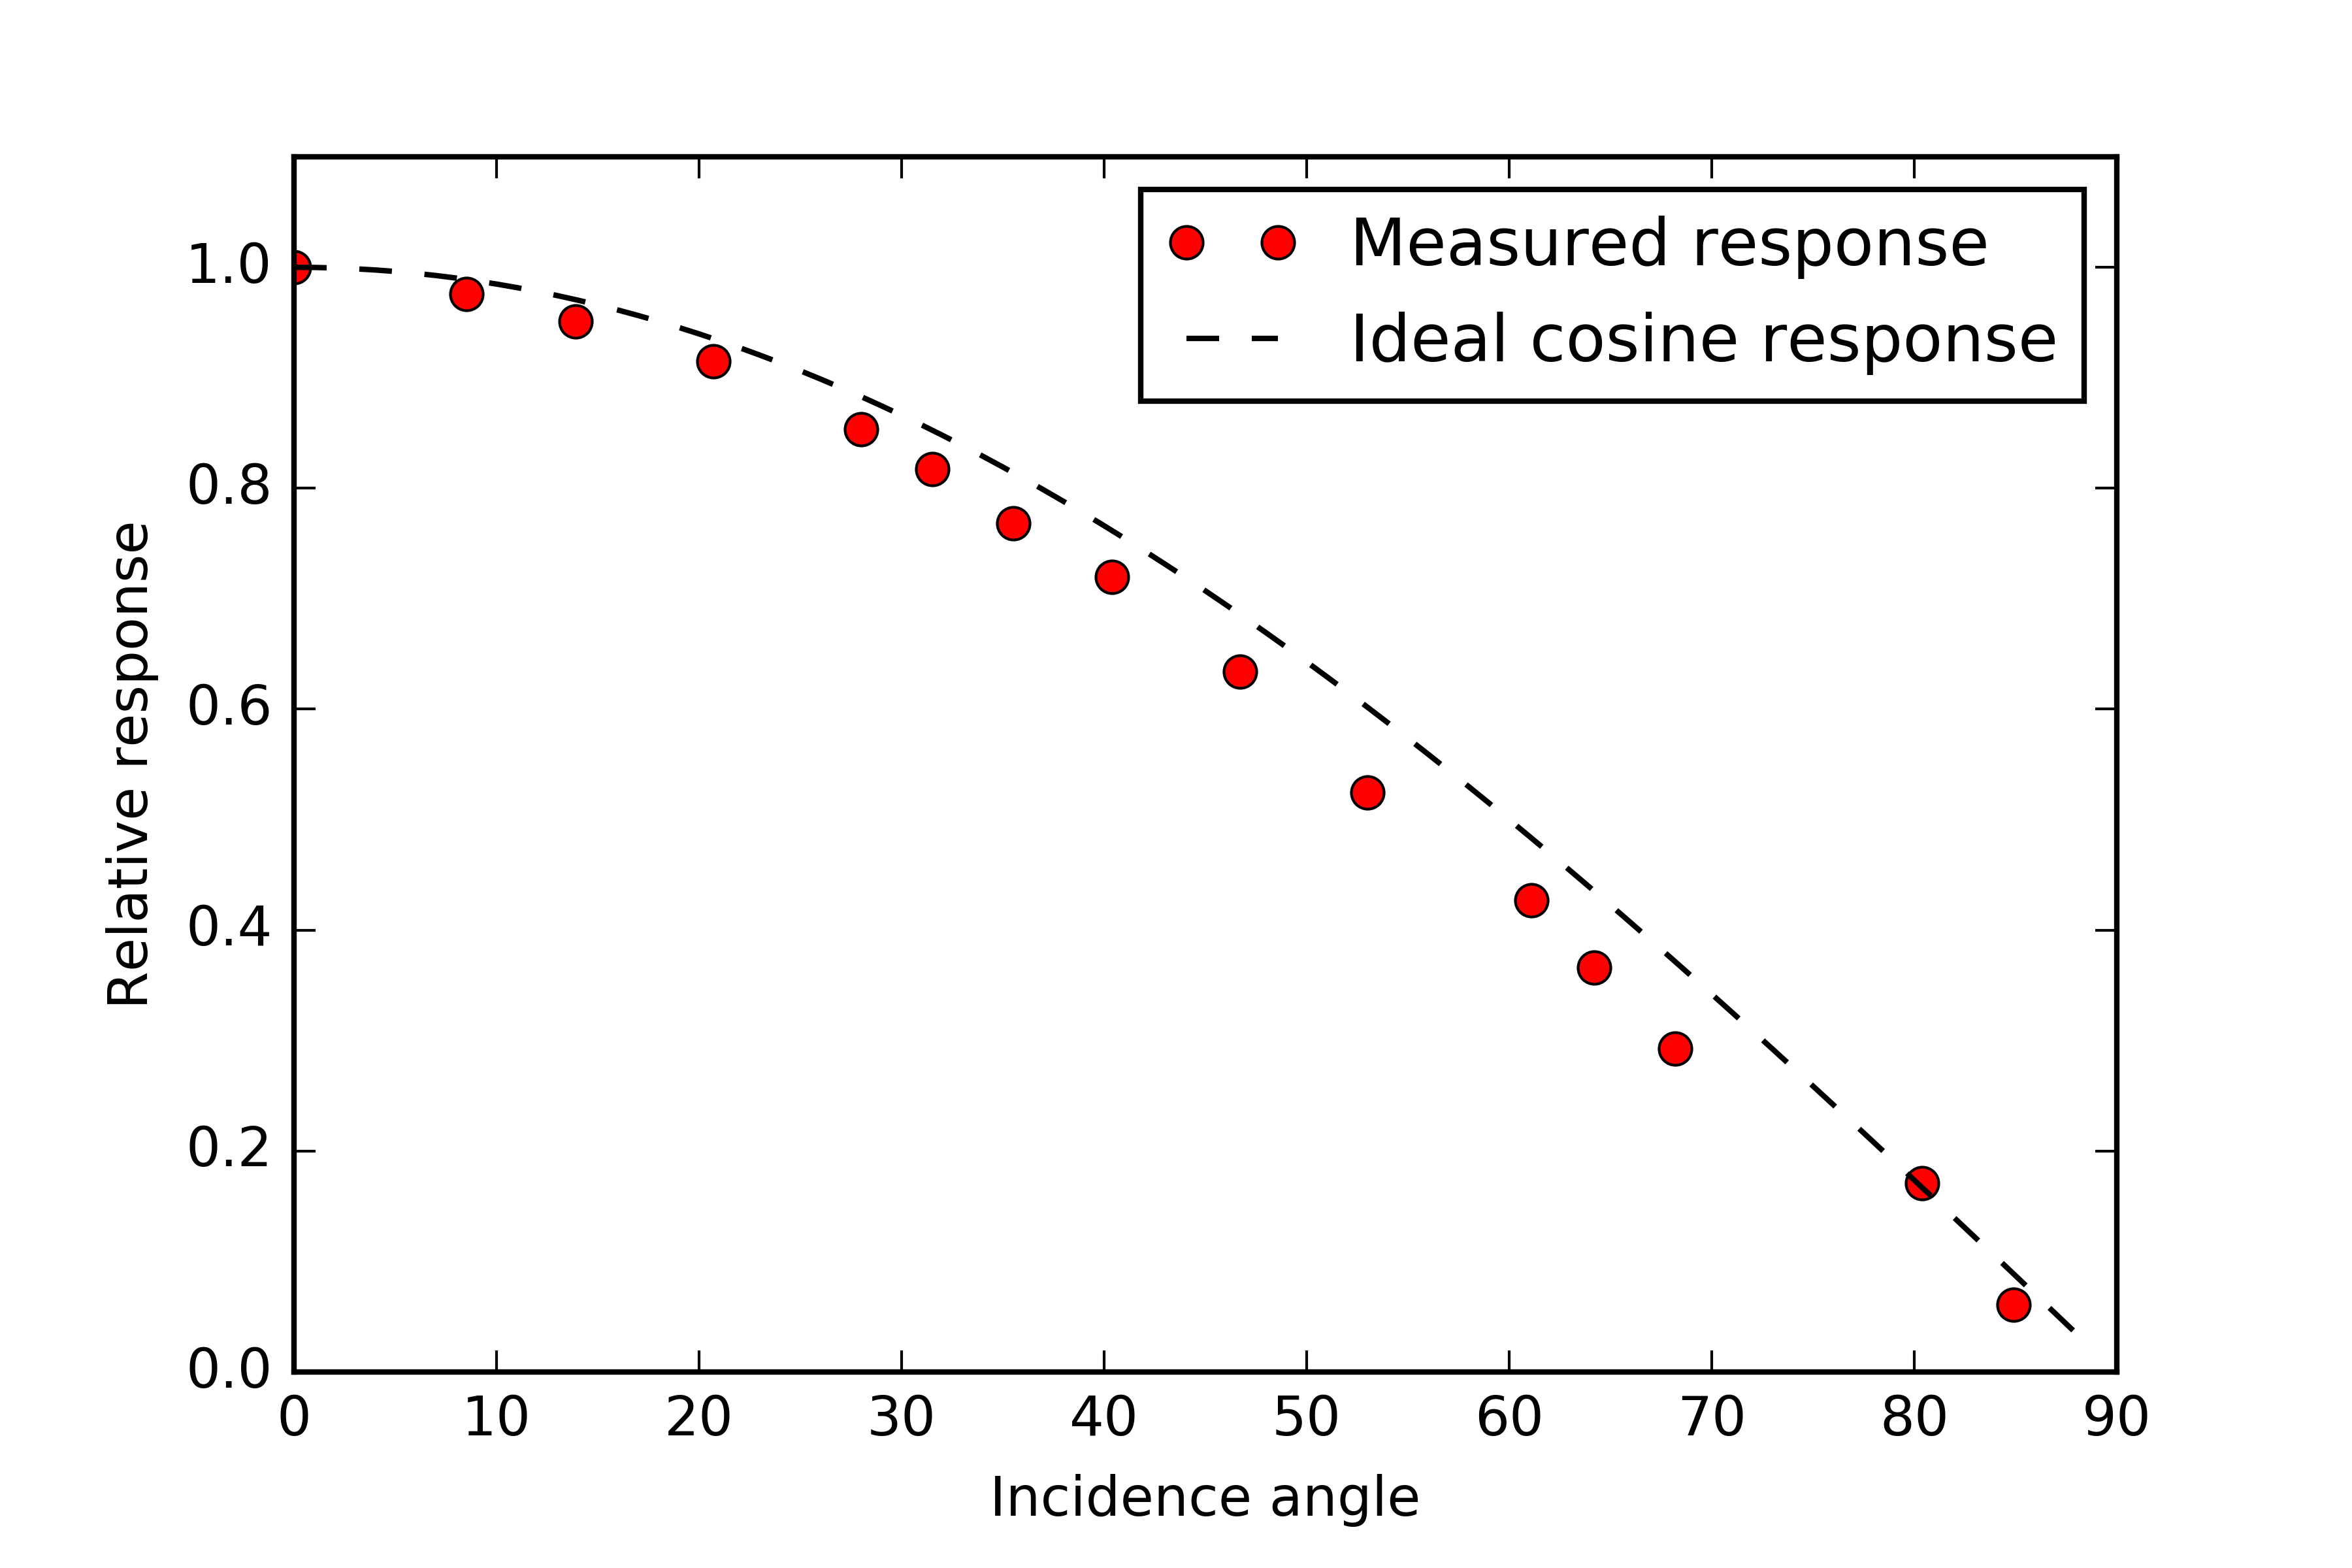
The profiler is used to measure light levels throughout the water column. It consists of five sensors: one cosine corrected photodiode to measure downwelling PAR, two filtered photodiodes to measure chlorophyll and CDOM fluorescence, a photodiode to measure backscattered light and pressure sensor to measure depth.
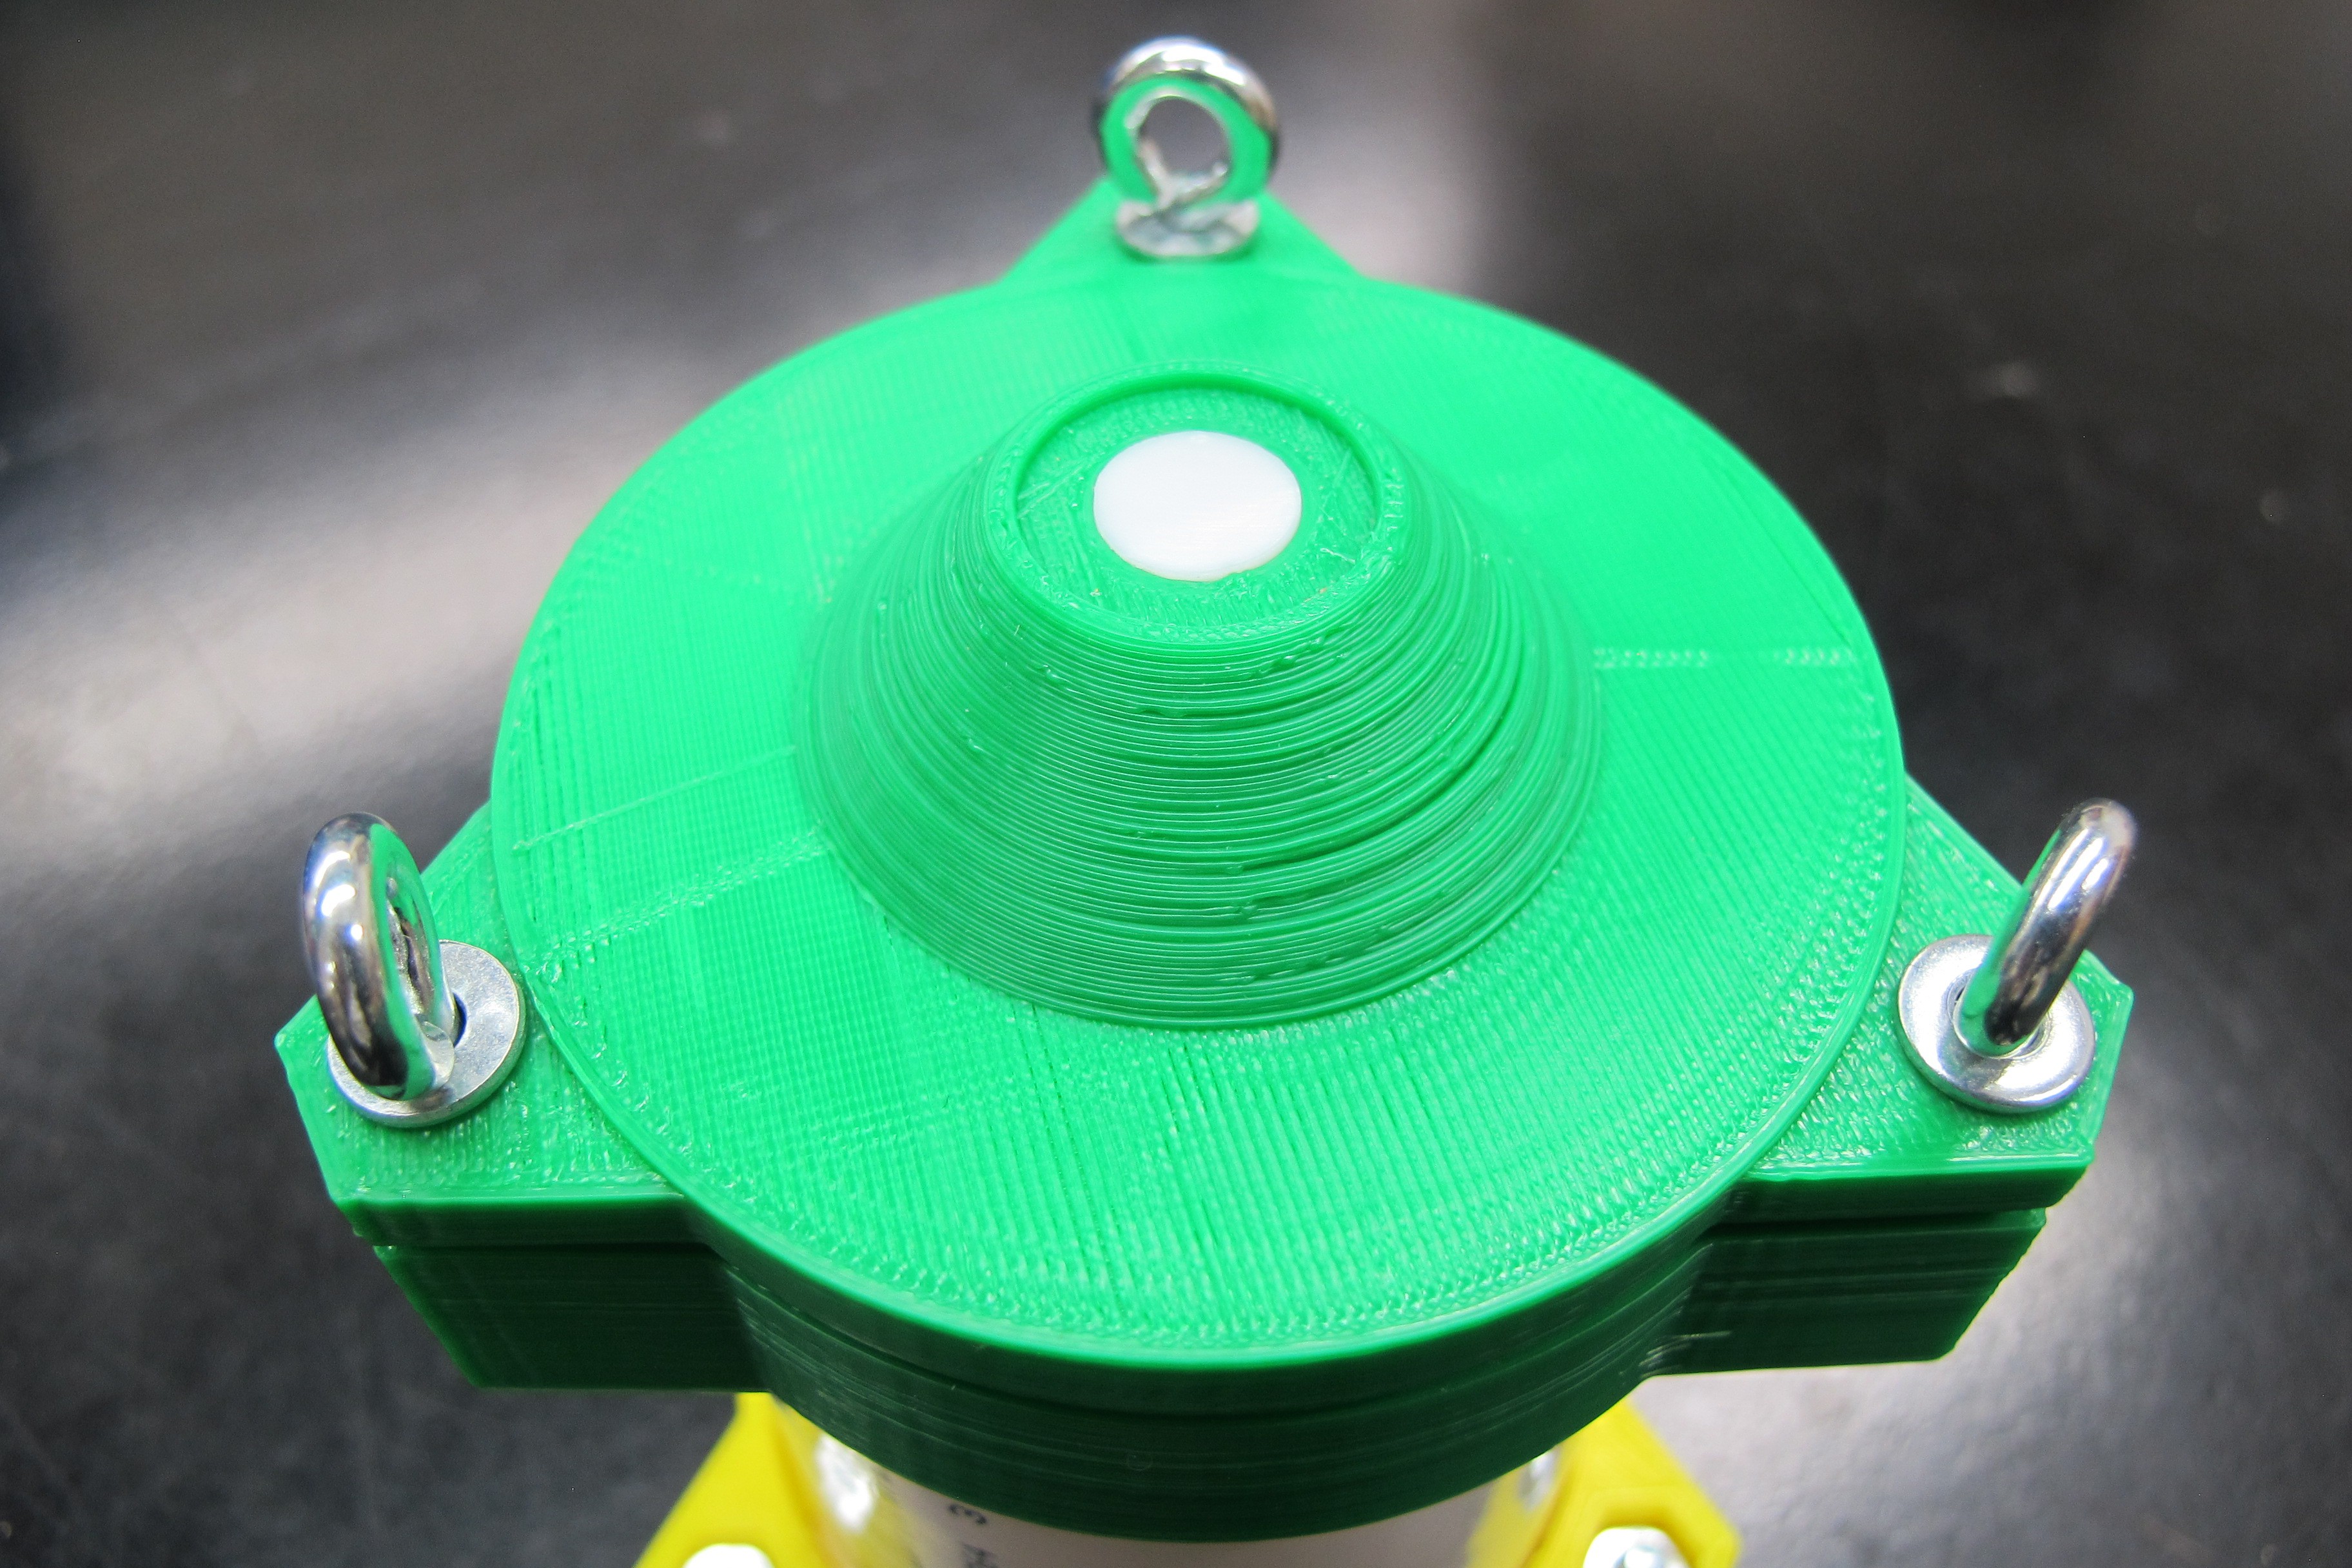
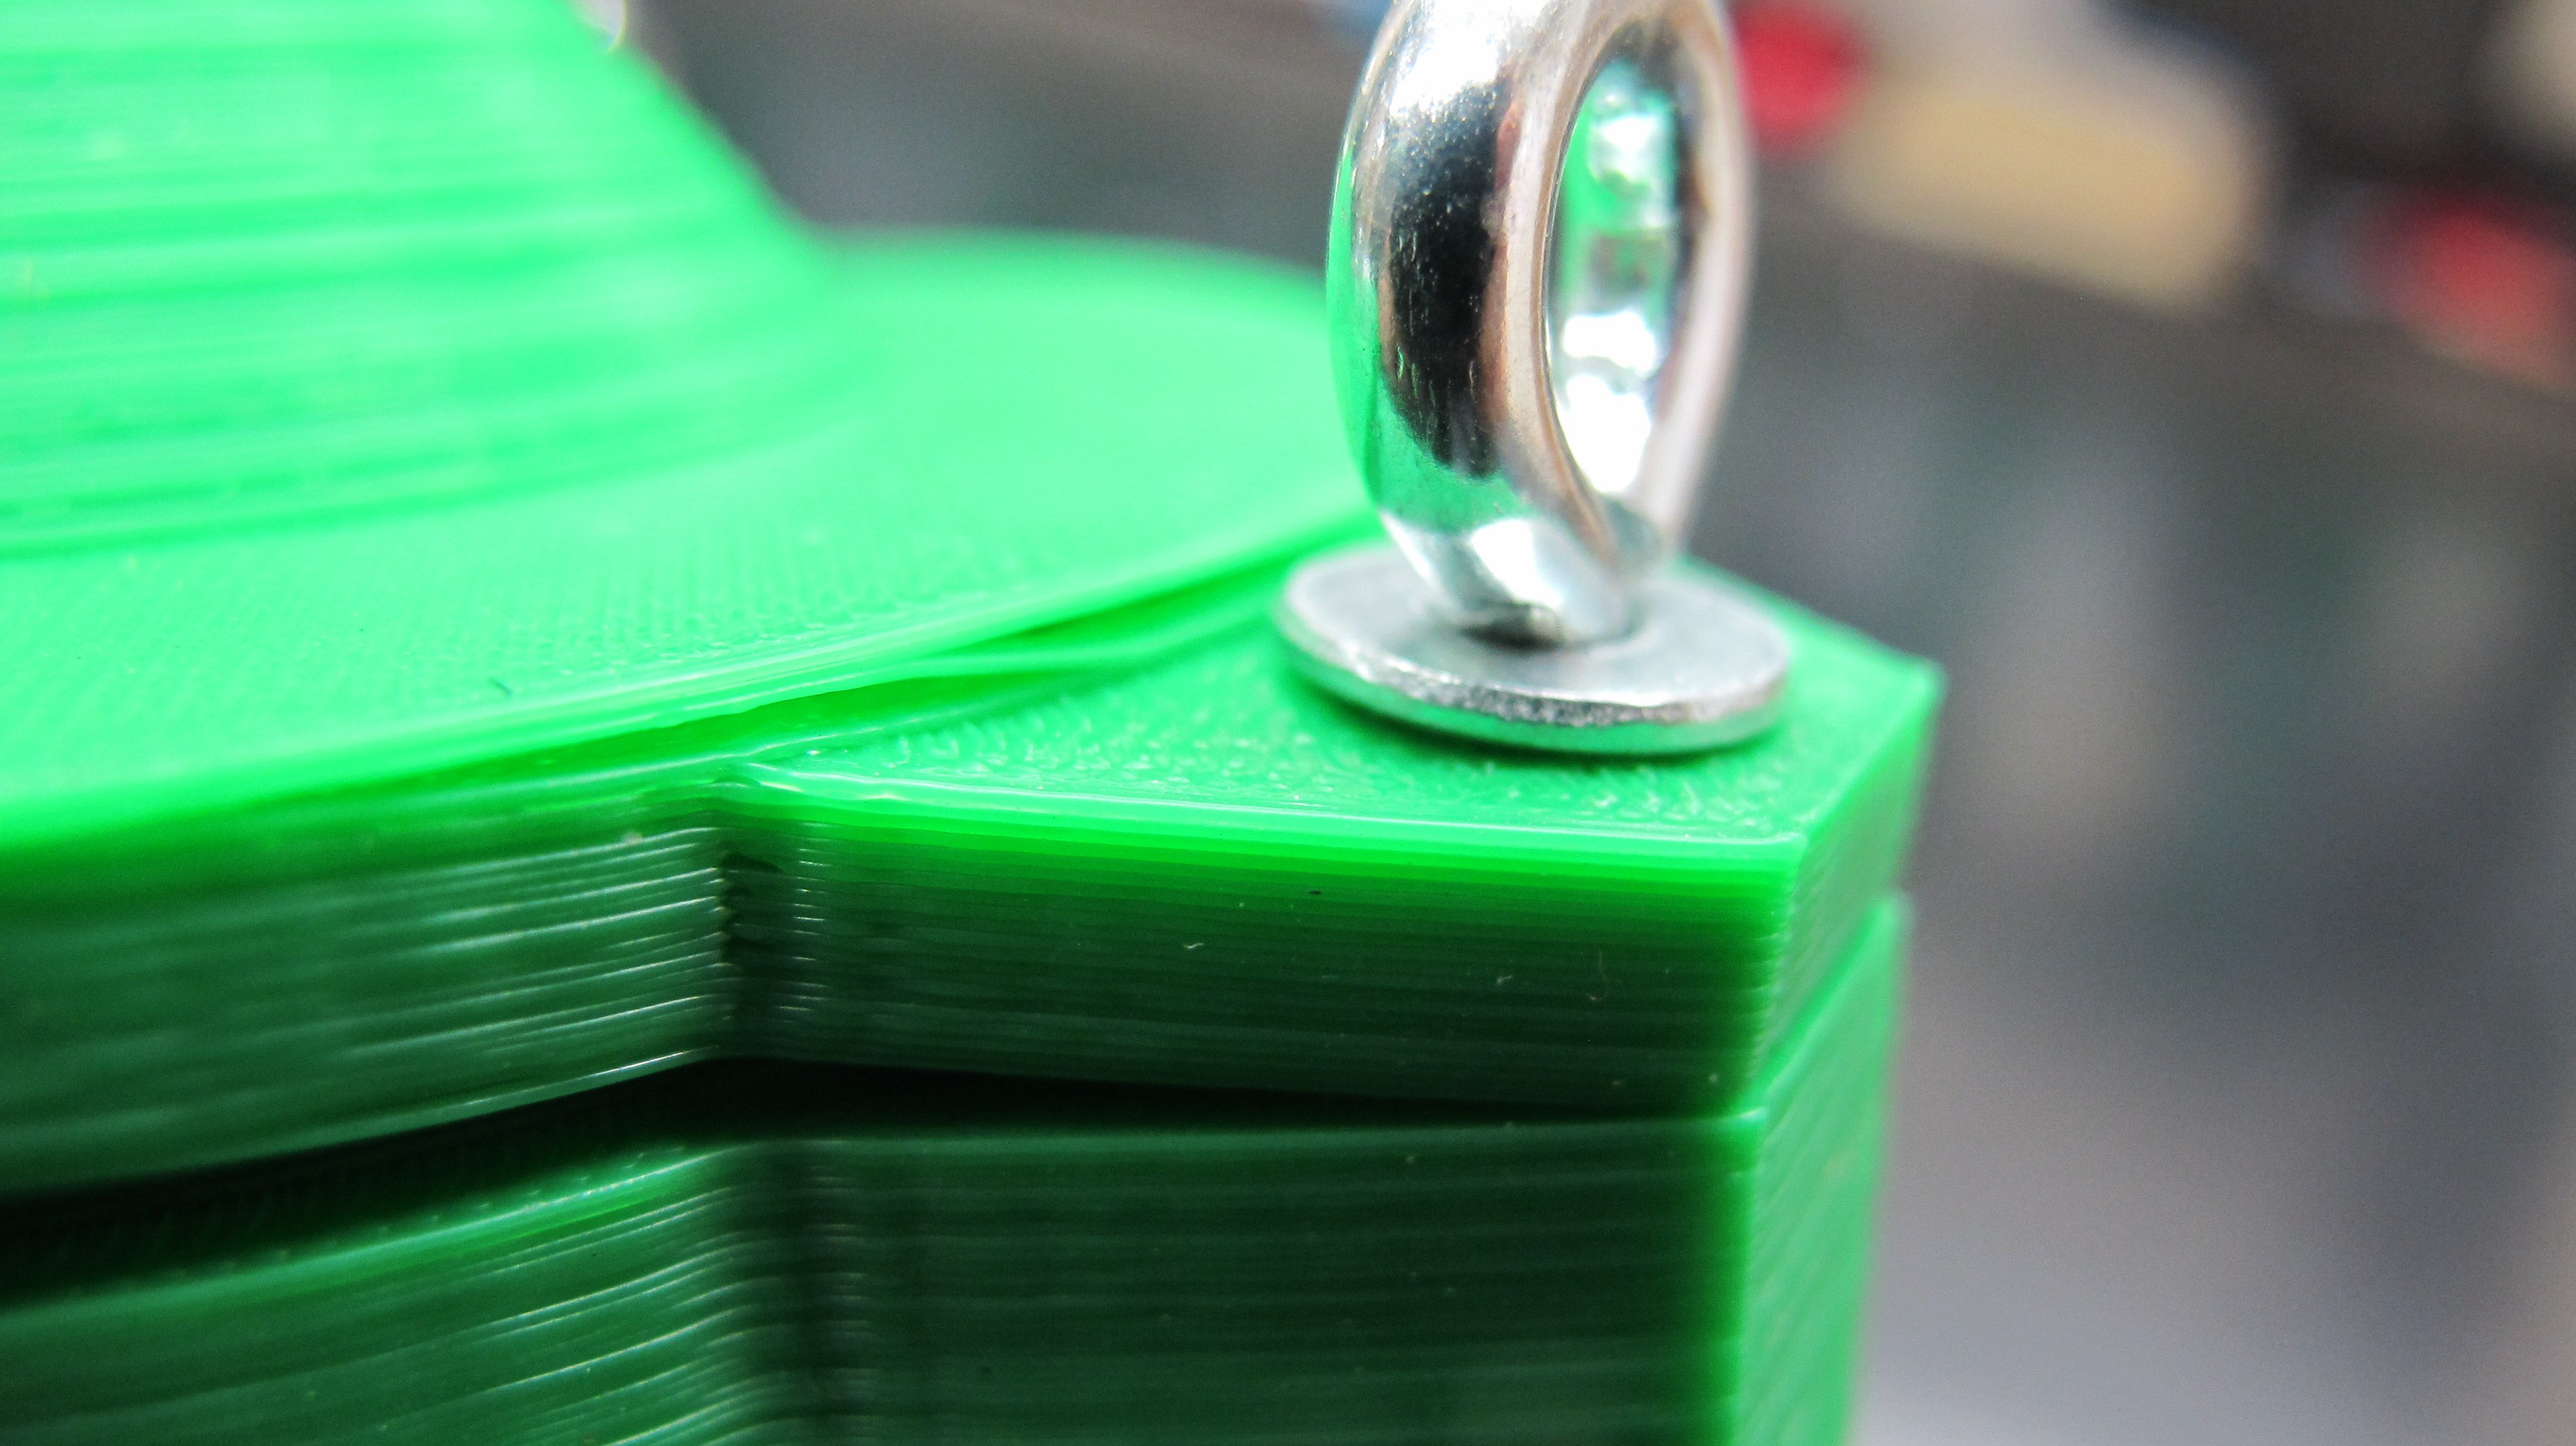
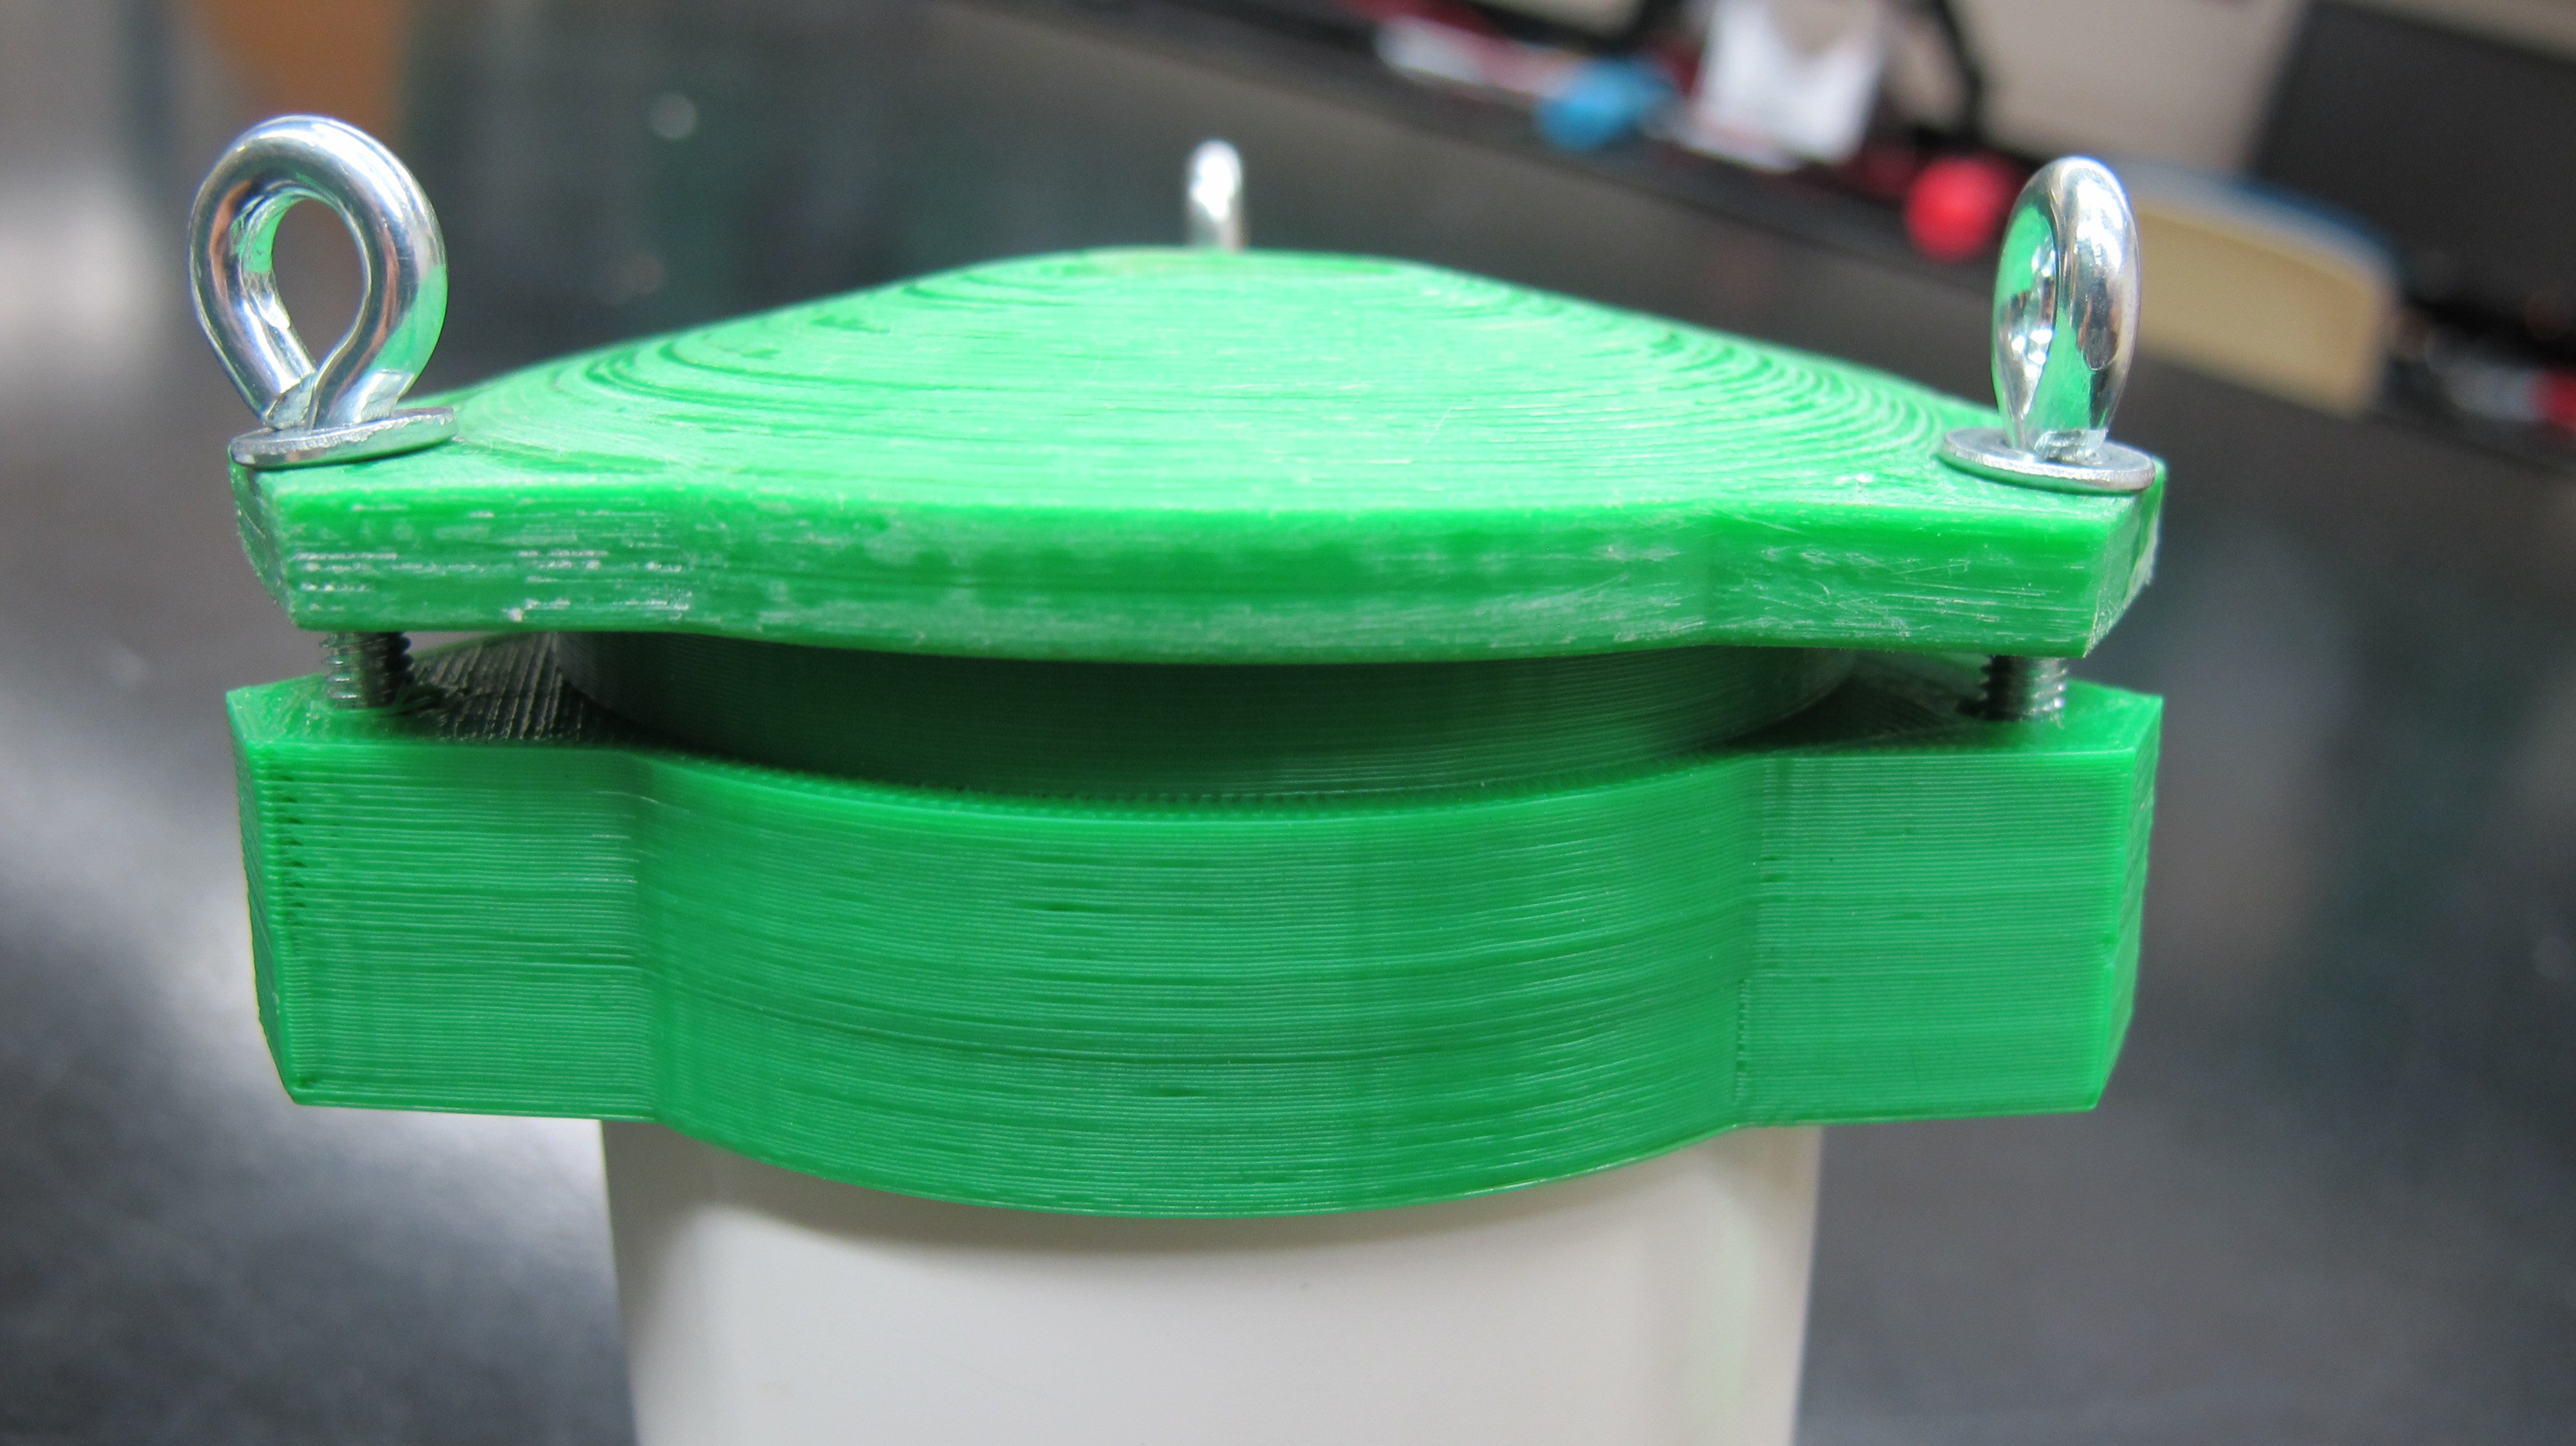
While doing some research for the enclosure design I came across the Cave Pearl Project, from the Hackaday Prize 2015, and took inspiration from Edward’s design. Because I need custom sized ports on the top and bottom of the profilers for the photodiodes, LEDs and pressure sensor, I decided to 3D print the caps along with the collars onto which the caps will be bolted.
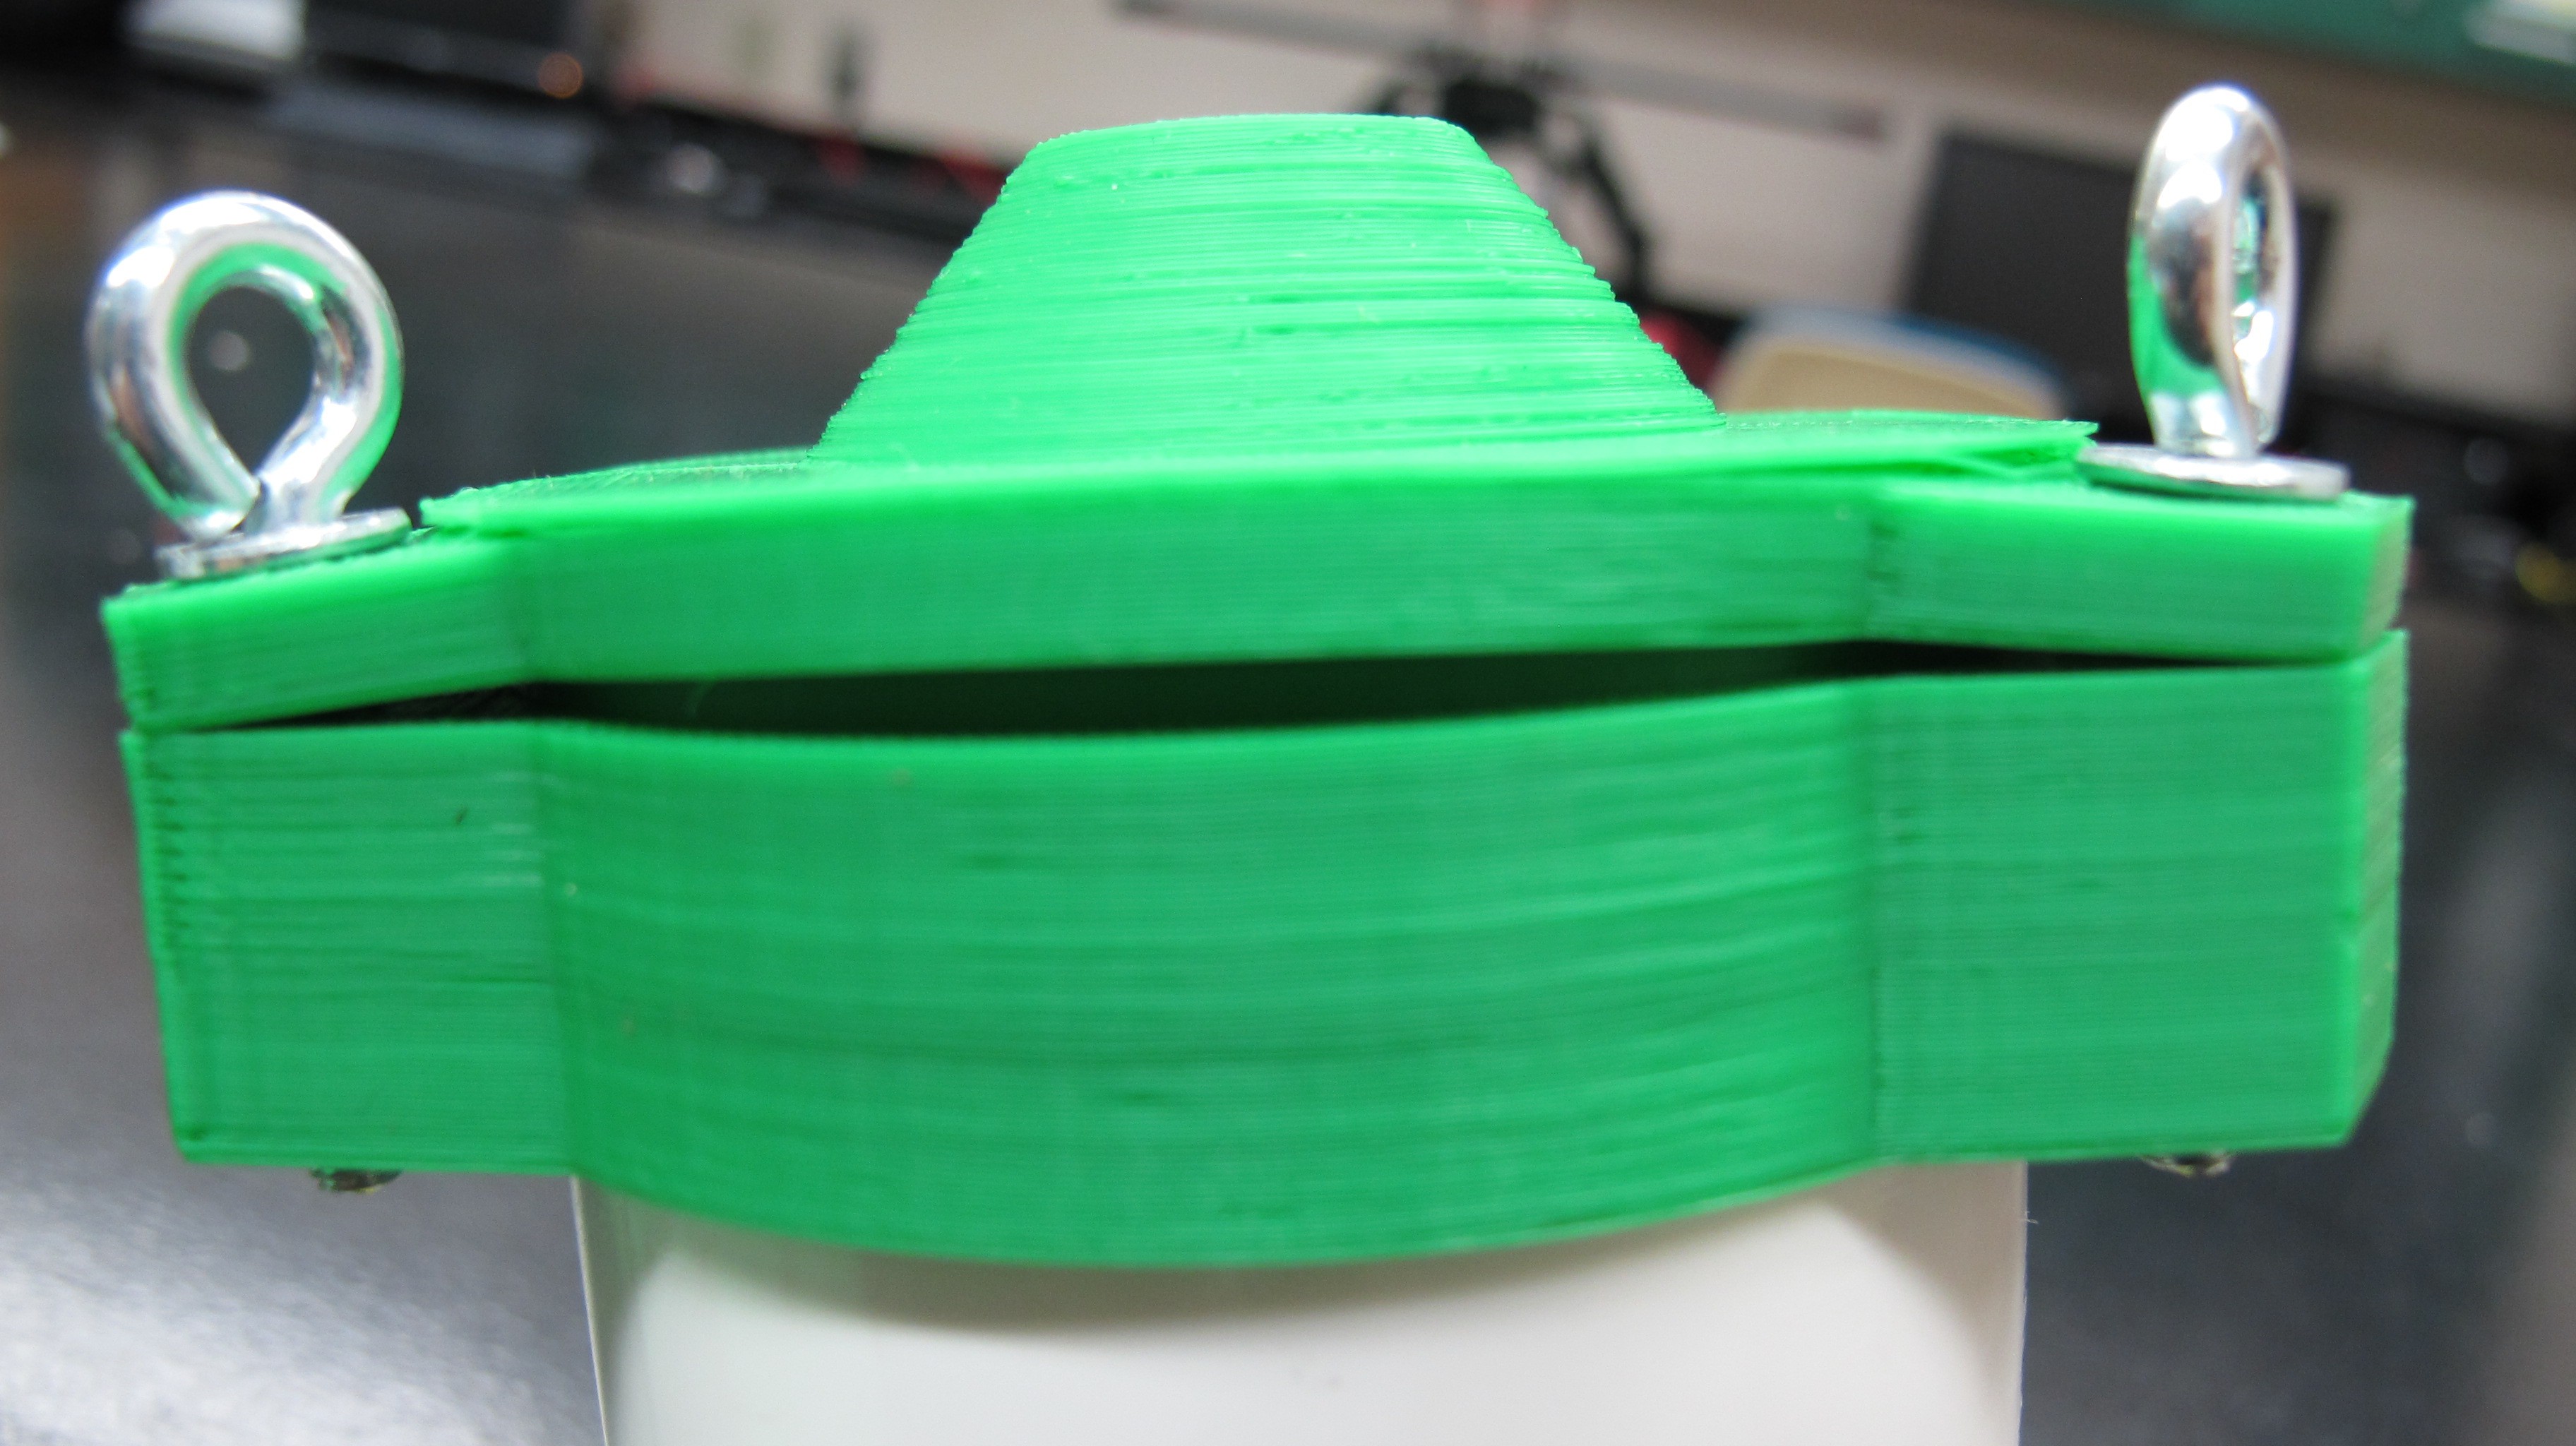
 I’m testing out methods to waterproof and strengthen
the 3D printed parts using epoxy resin. To provide a seal between the caps and
the collar I plan on using silicone for the gasket. The body of the enclosure
itself is made from a 2’’ PVC coupler which is wide enough to fit the
electronic components inside (Arduino Uno, shield and batteries). In reality I only
need one of the two caps to be removable and could have epoxied bottom cap to
the PVC coupling but I want to have easy access to the photodiodes and LED on
the bottom. More on the design of the enclosure at a later date.
I’m testing out methods to waterproof and strengthen
the 3D printed parts using epoxy resin. To provide a seal between the caps and
the collar I plan on using silicone for the gasket. The body of the enclosure
itself is made from a 2’’ PVC coupler which is wide enough to fit the
electronic components inside (Arduino Uno, shield and batteries). In reality I only
need one of the two caps to be removable and could have epoxied bottom cap to
the PVC coupling but I want to have easy access to the photodiodes and LED on
the bottom. More on the design of the enclosure at a later date.
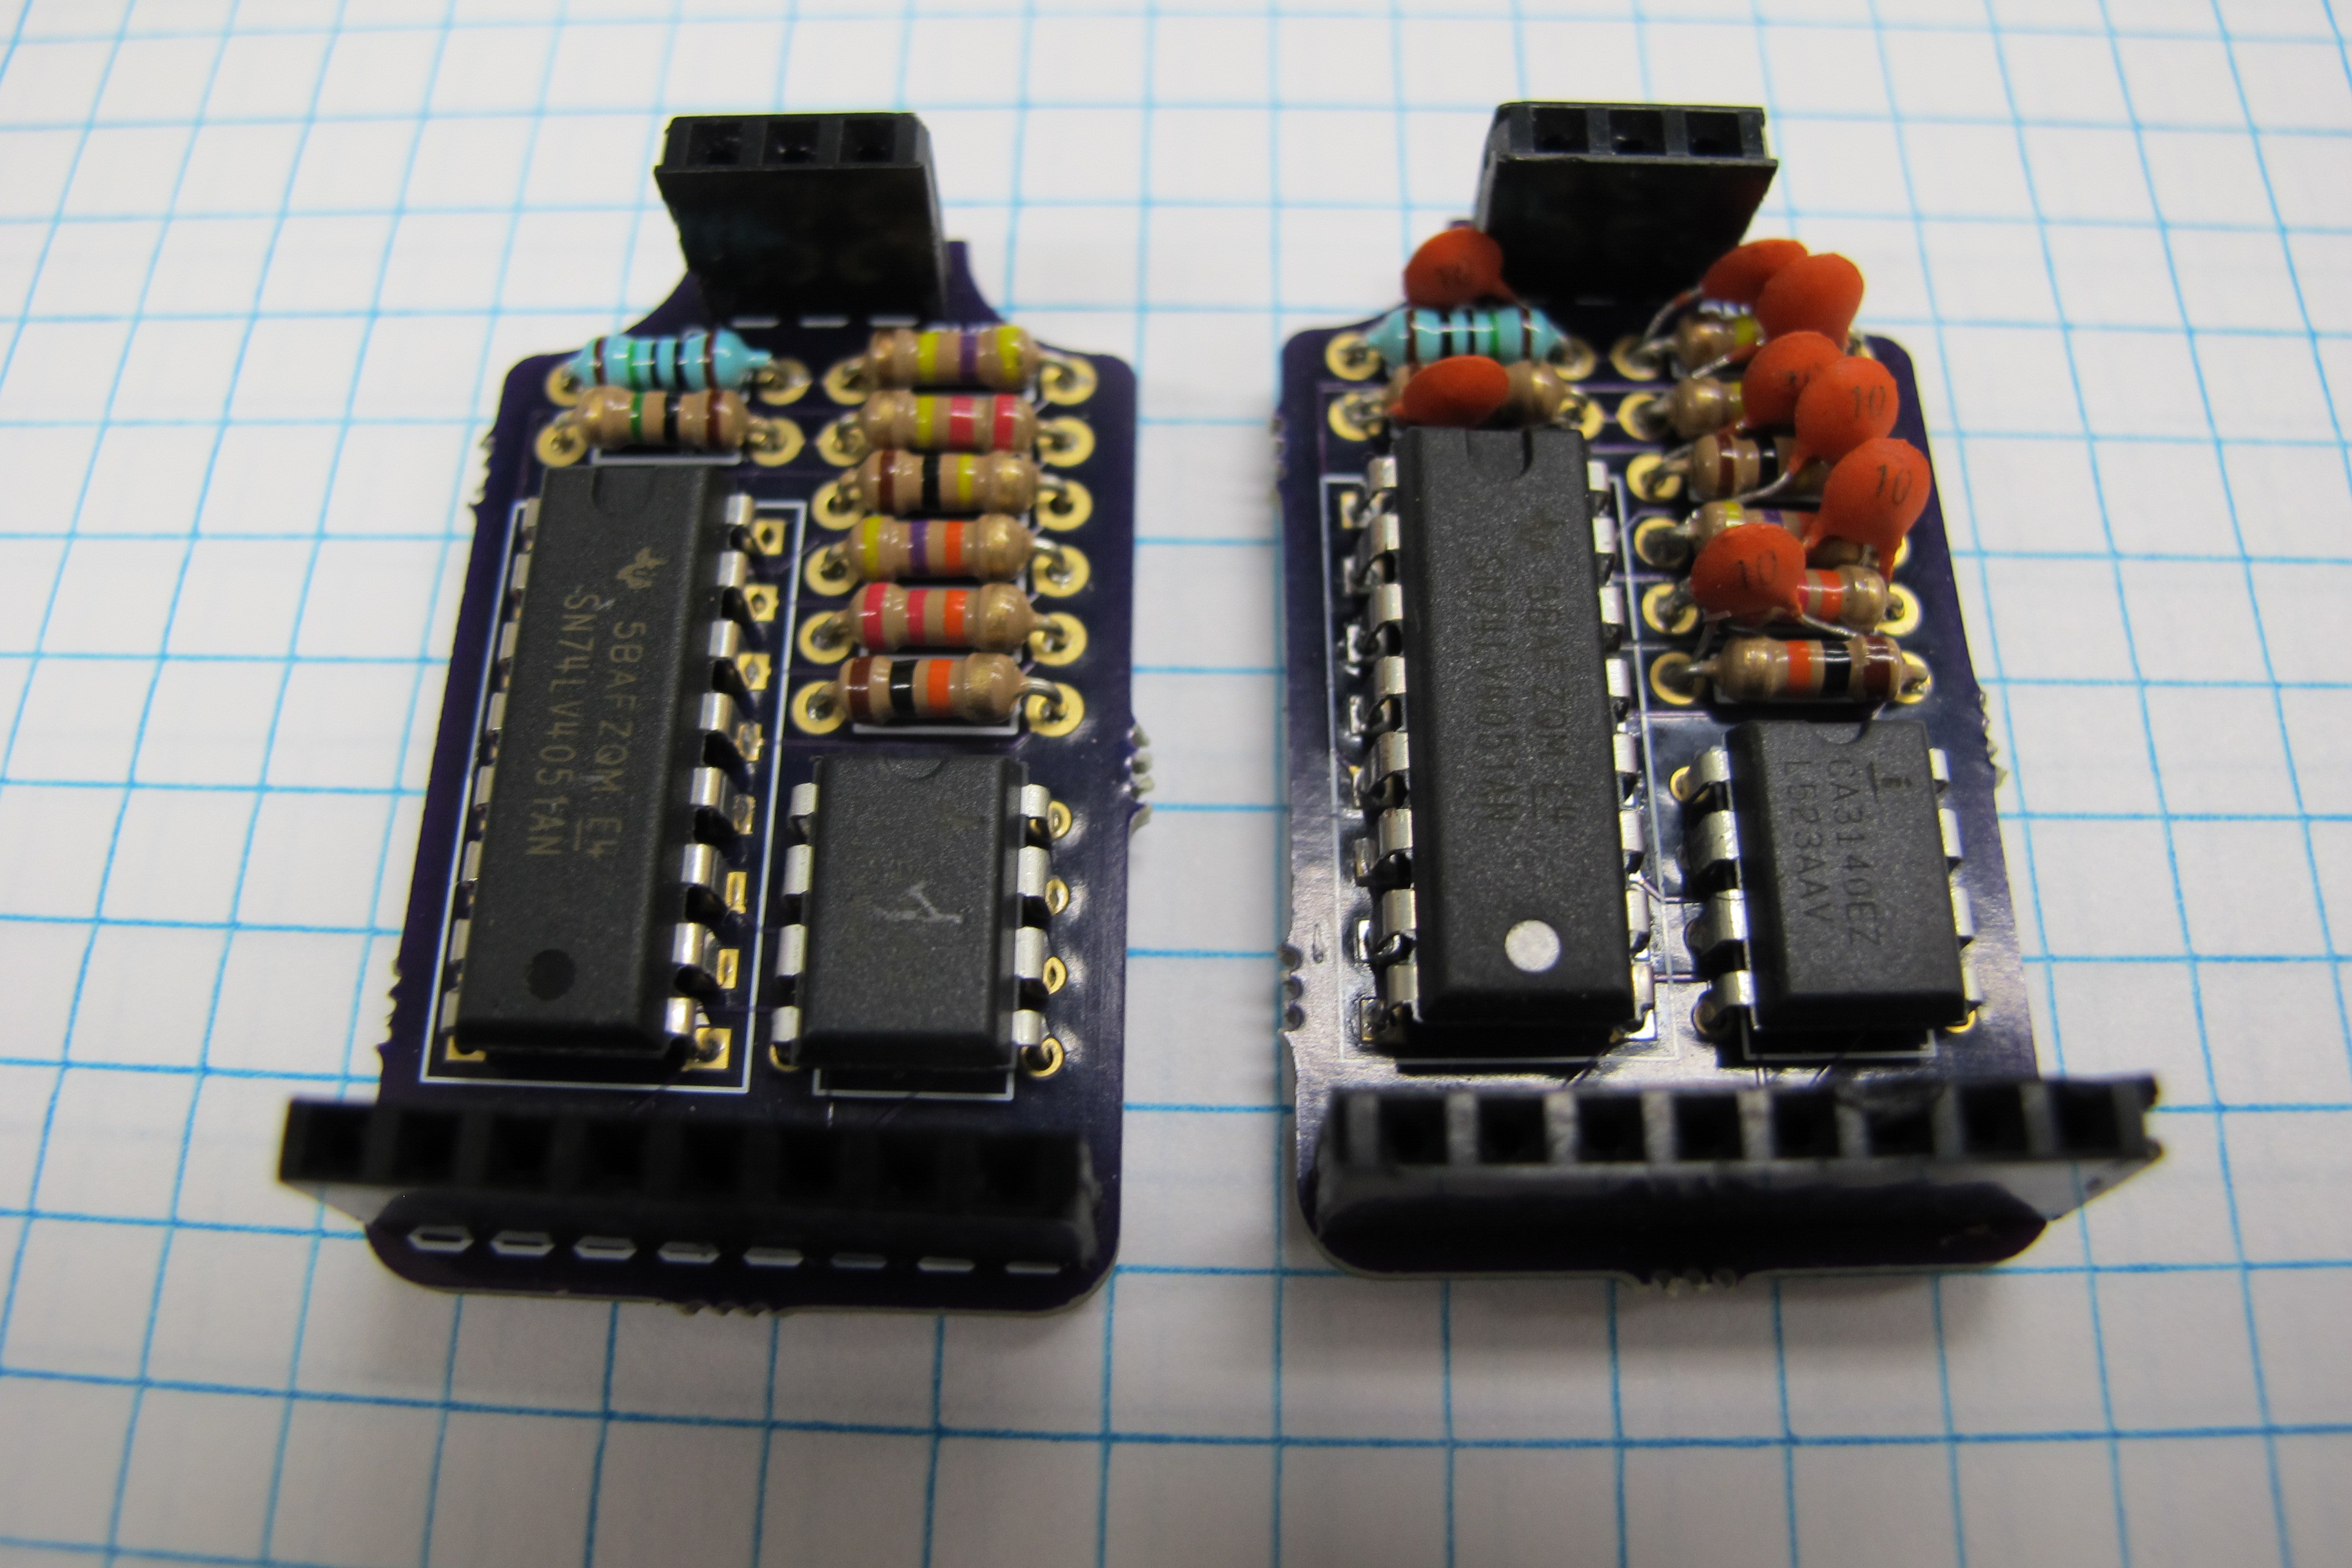
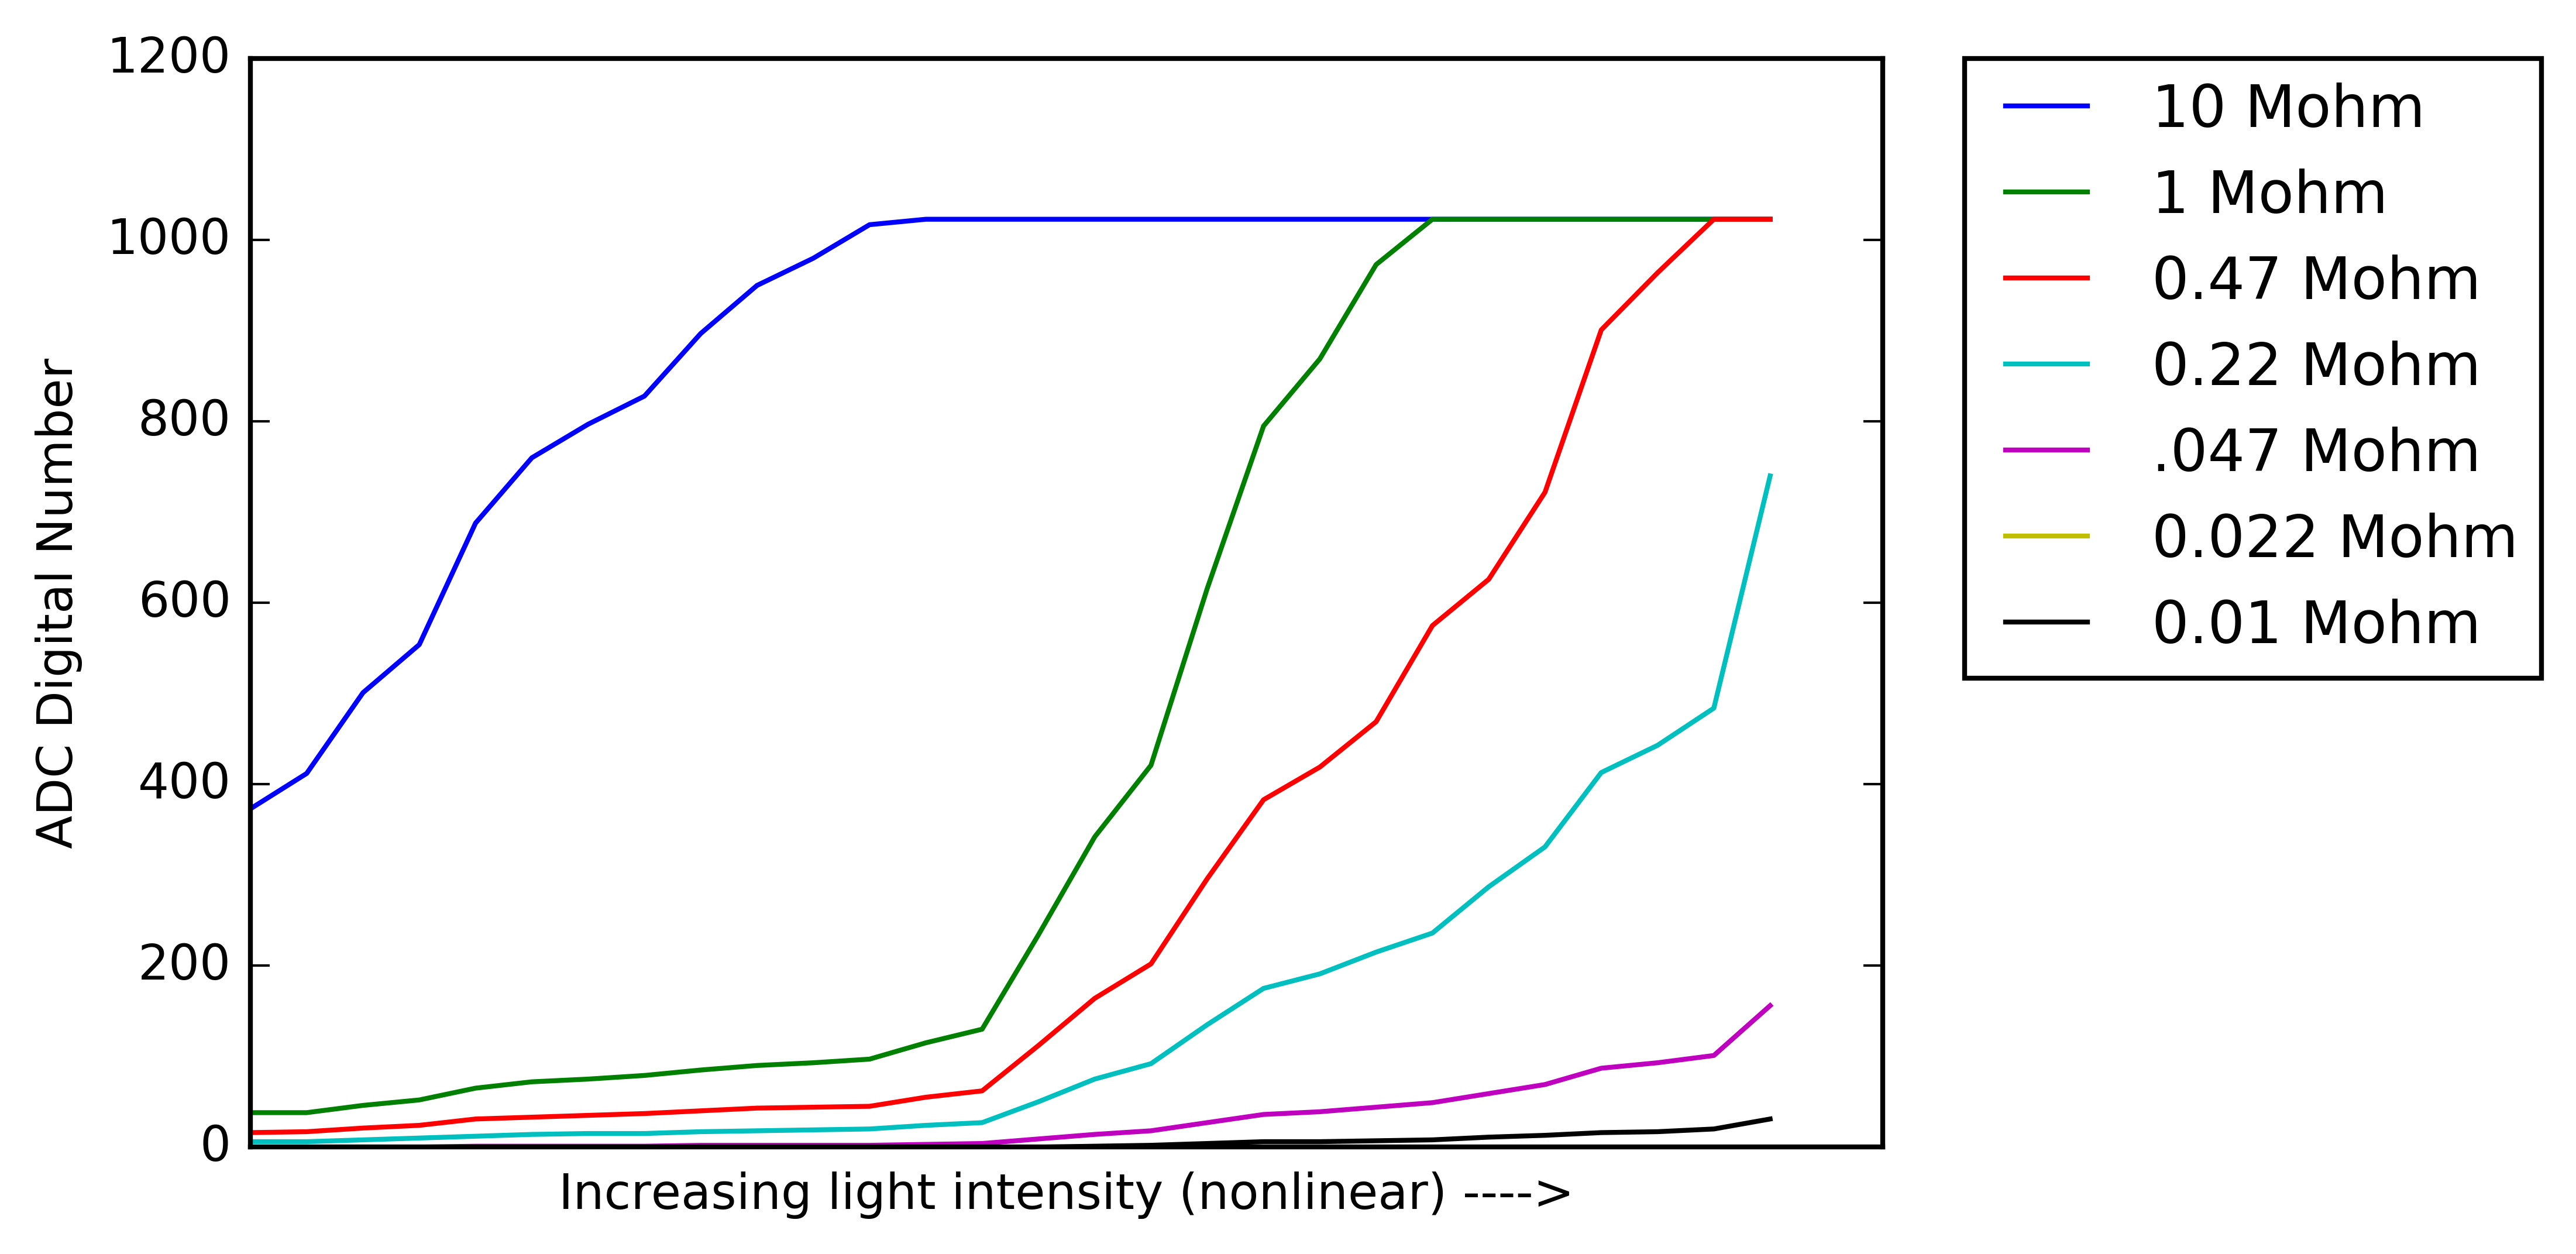
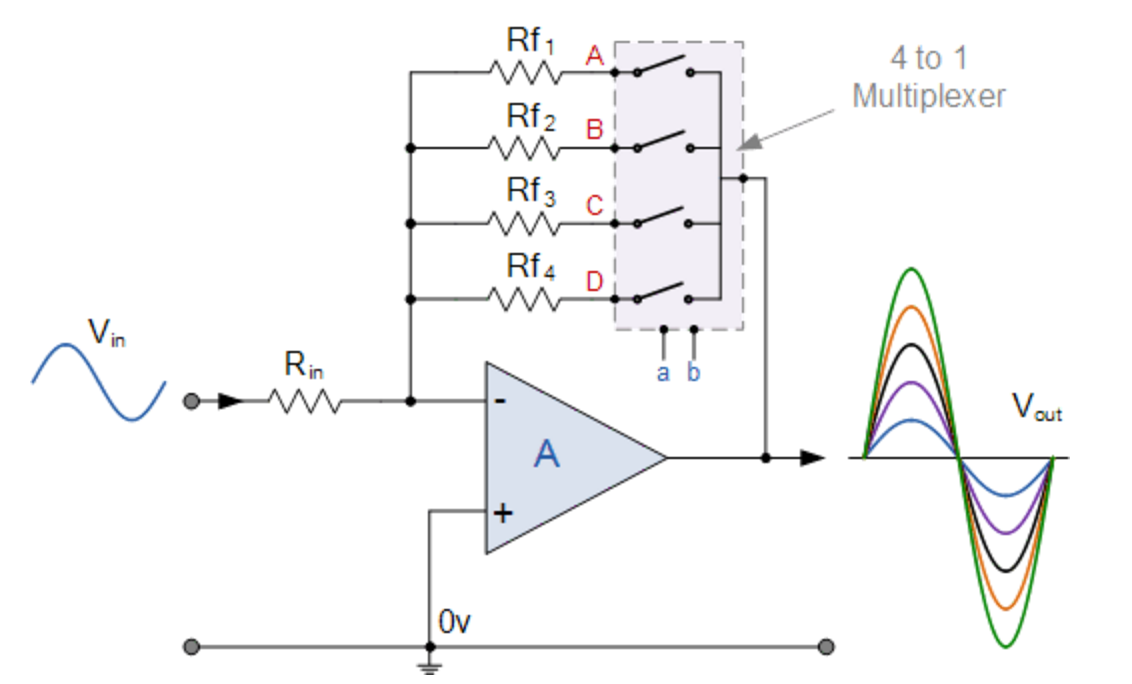
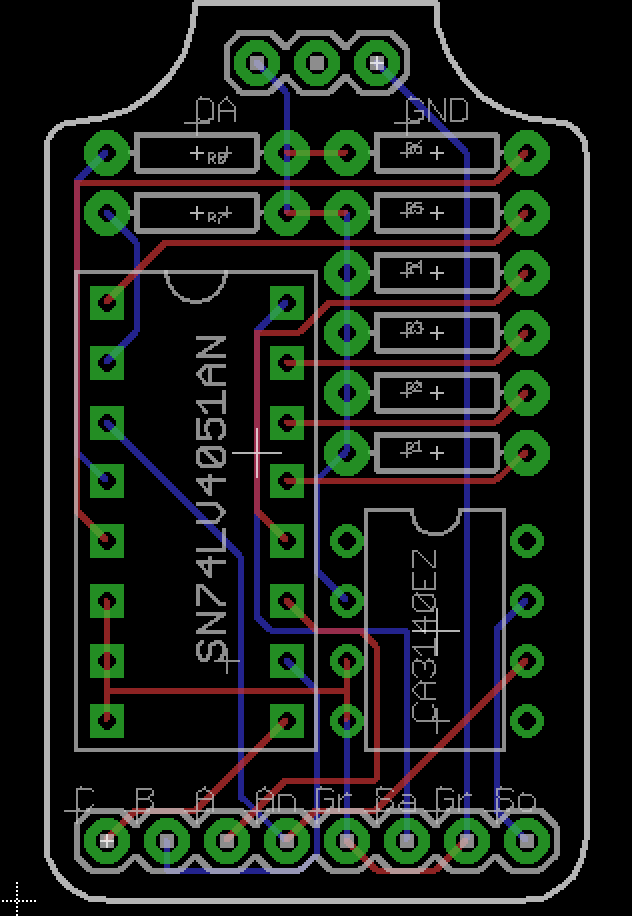
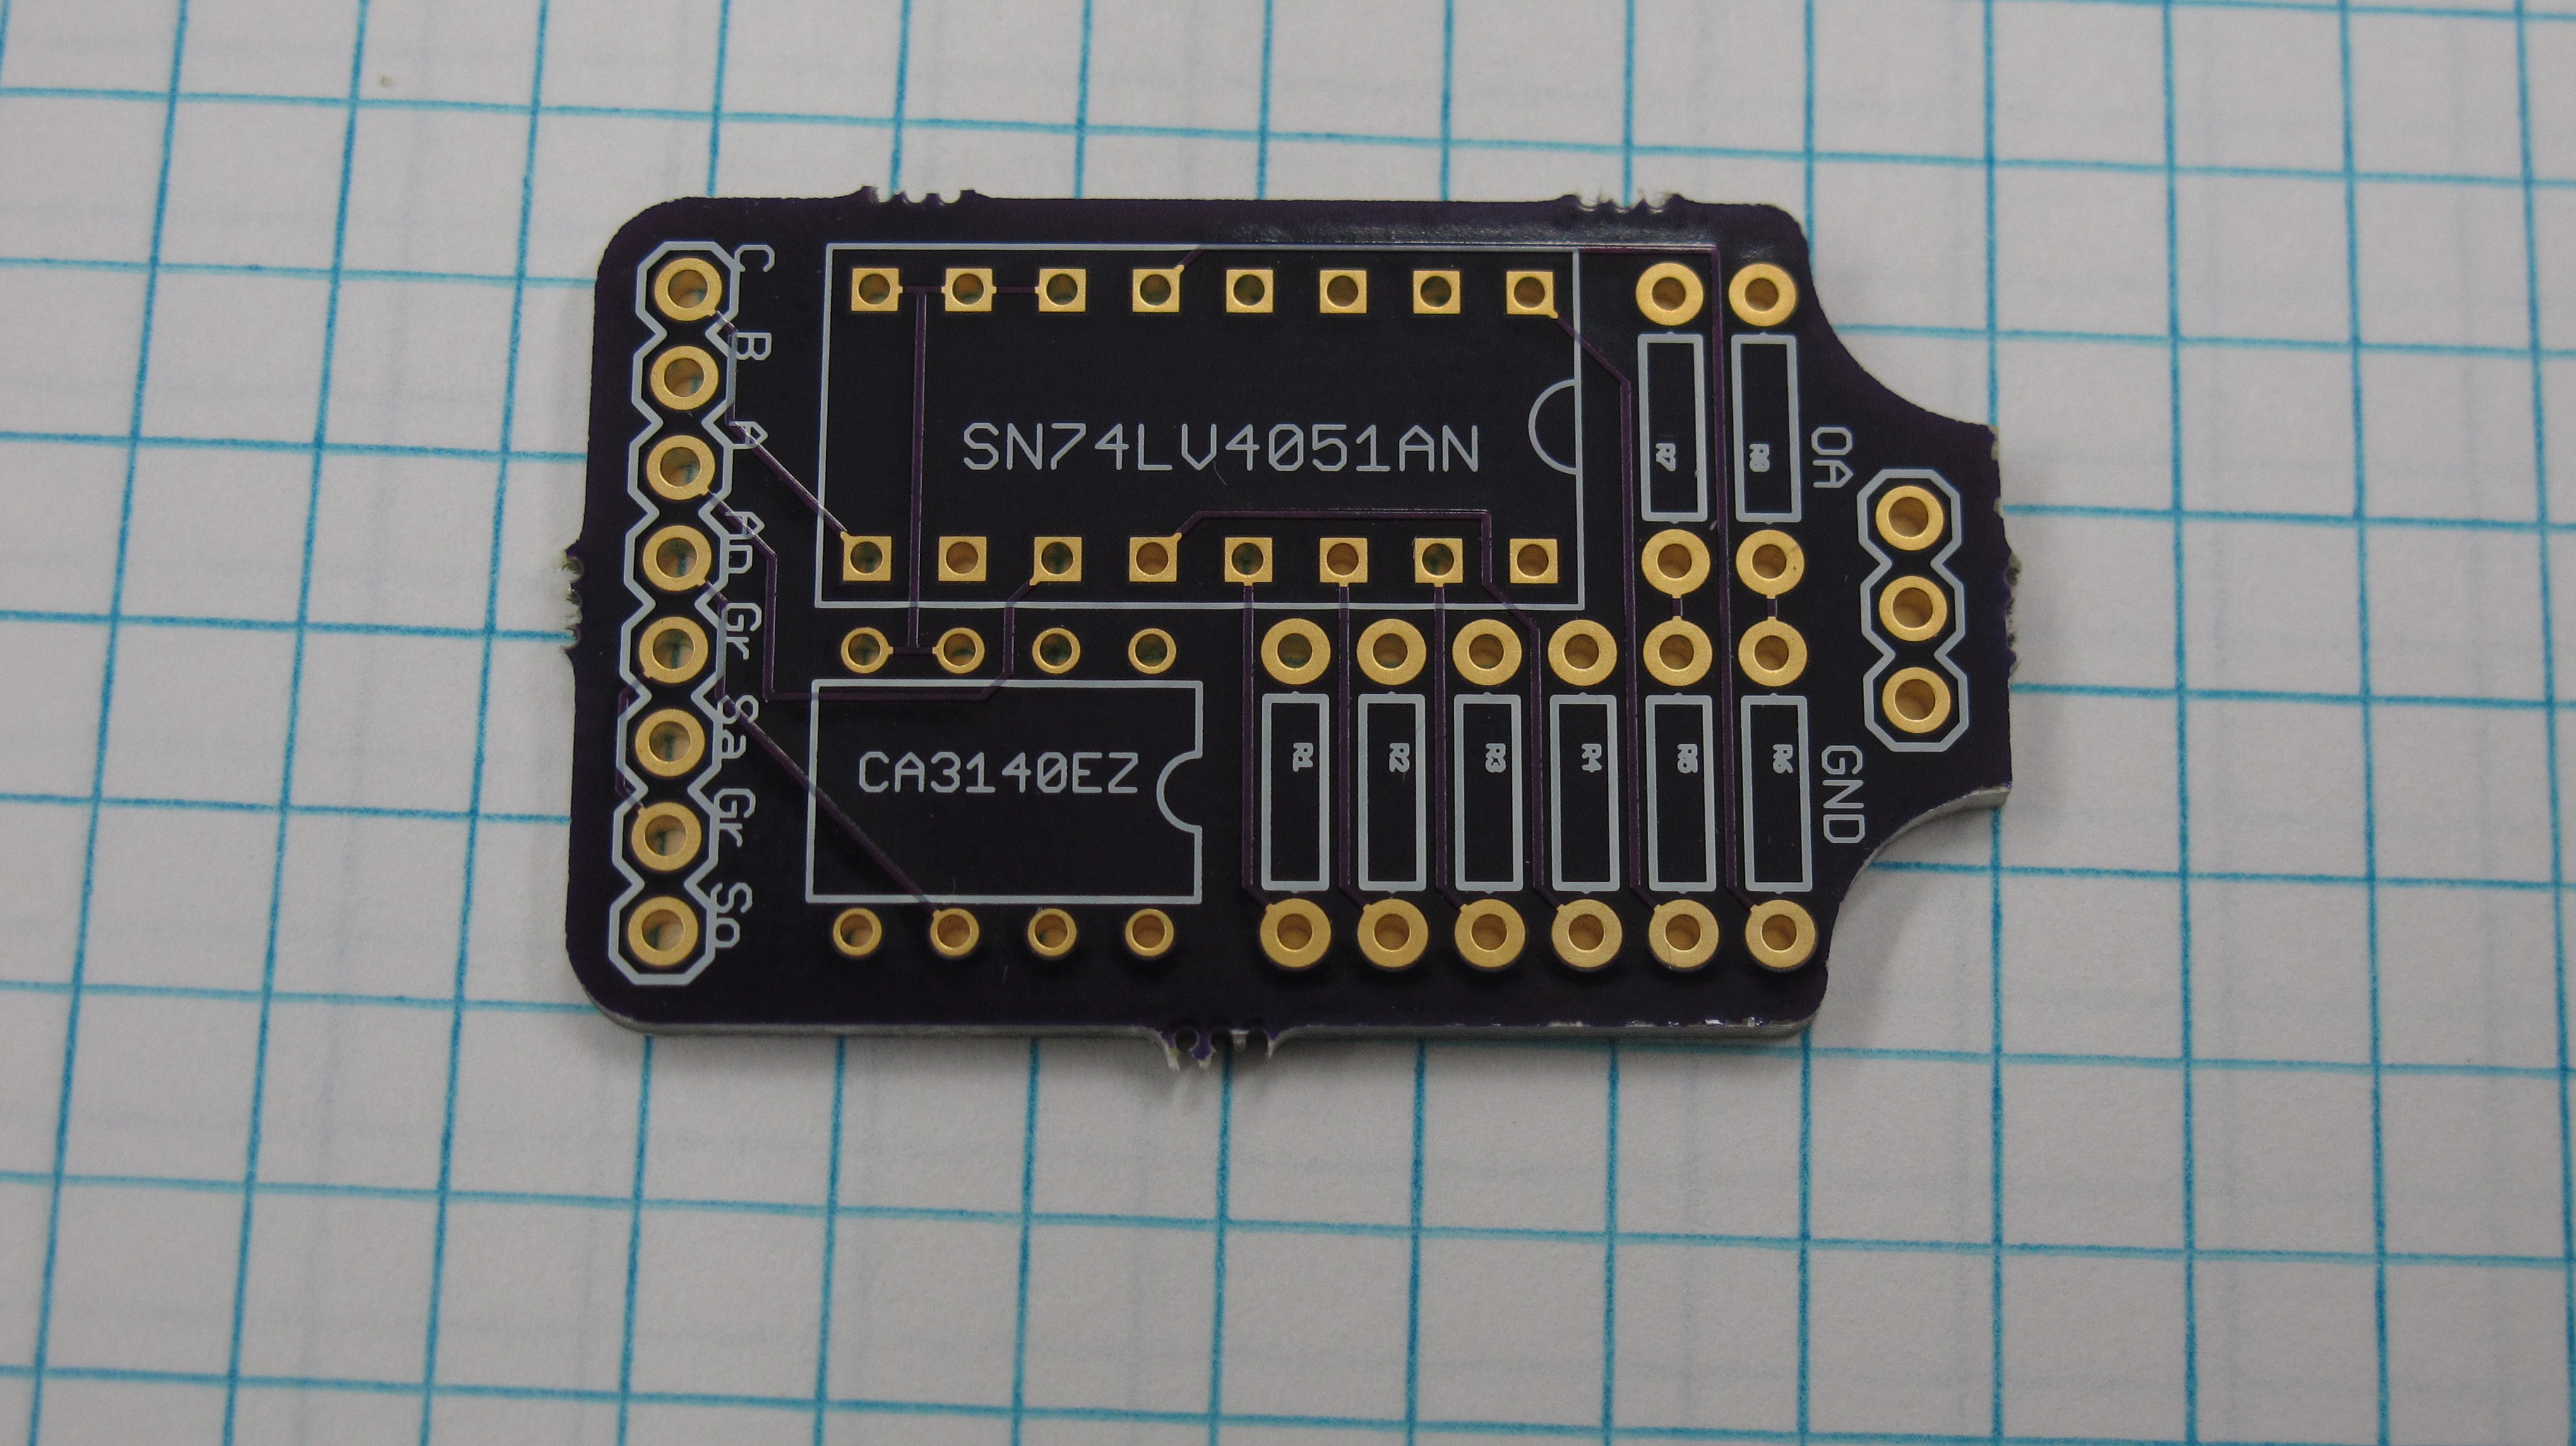
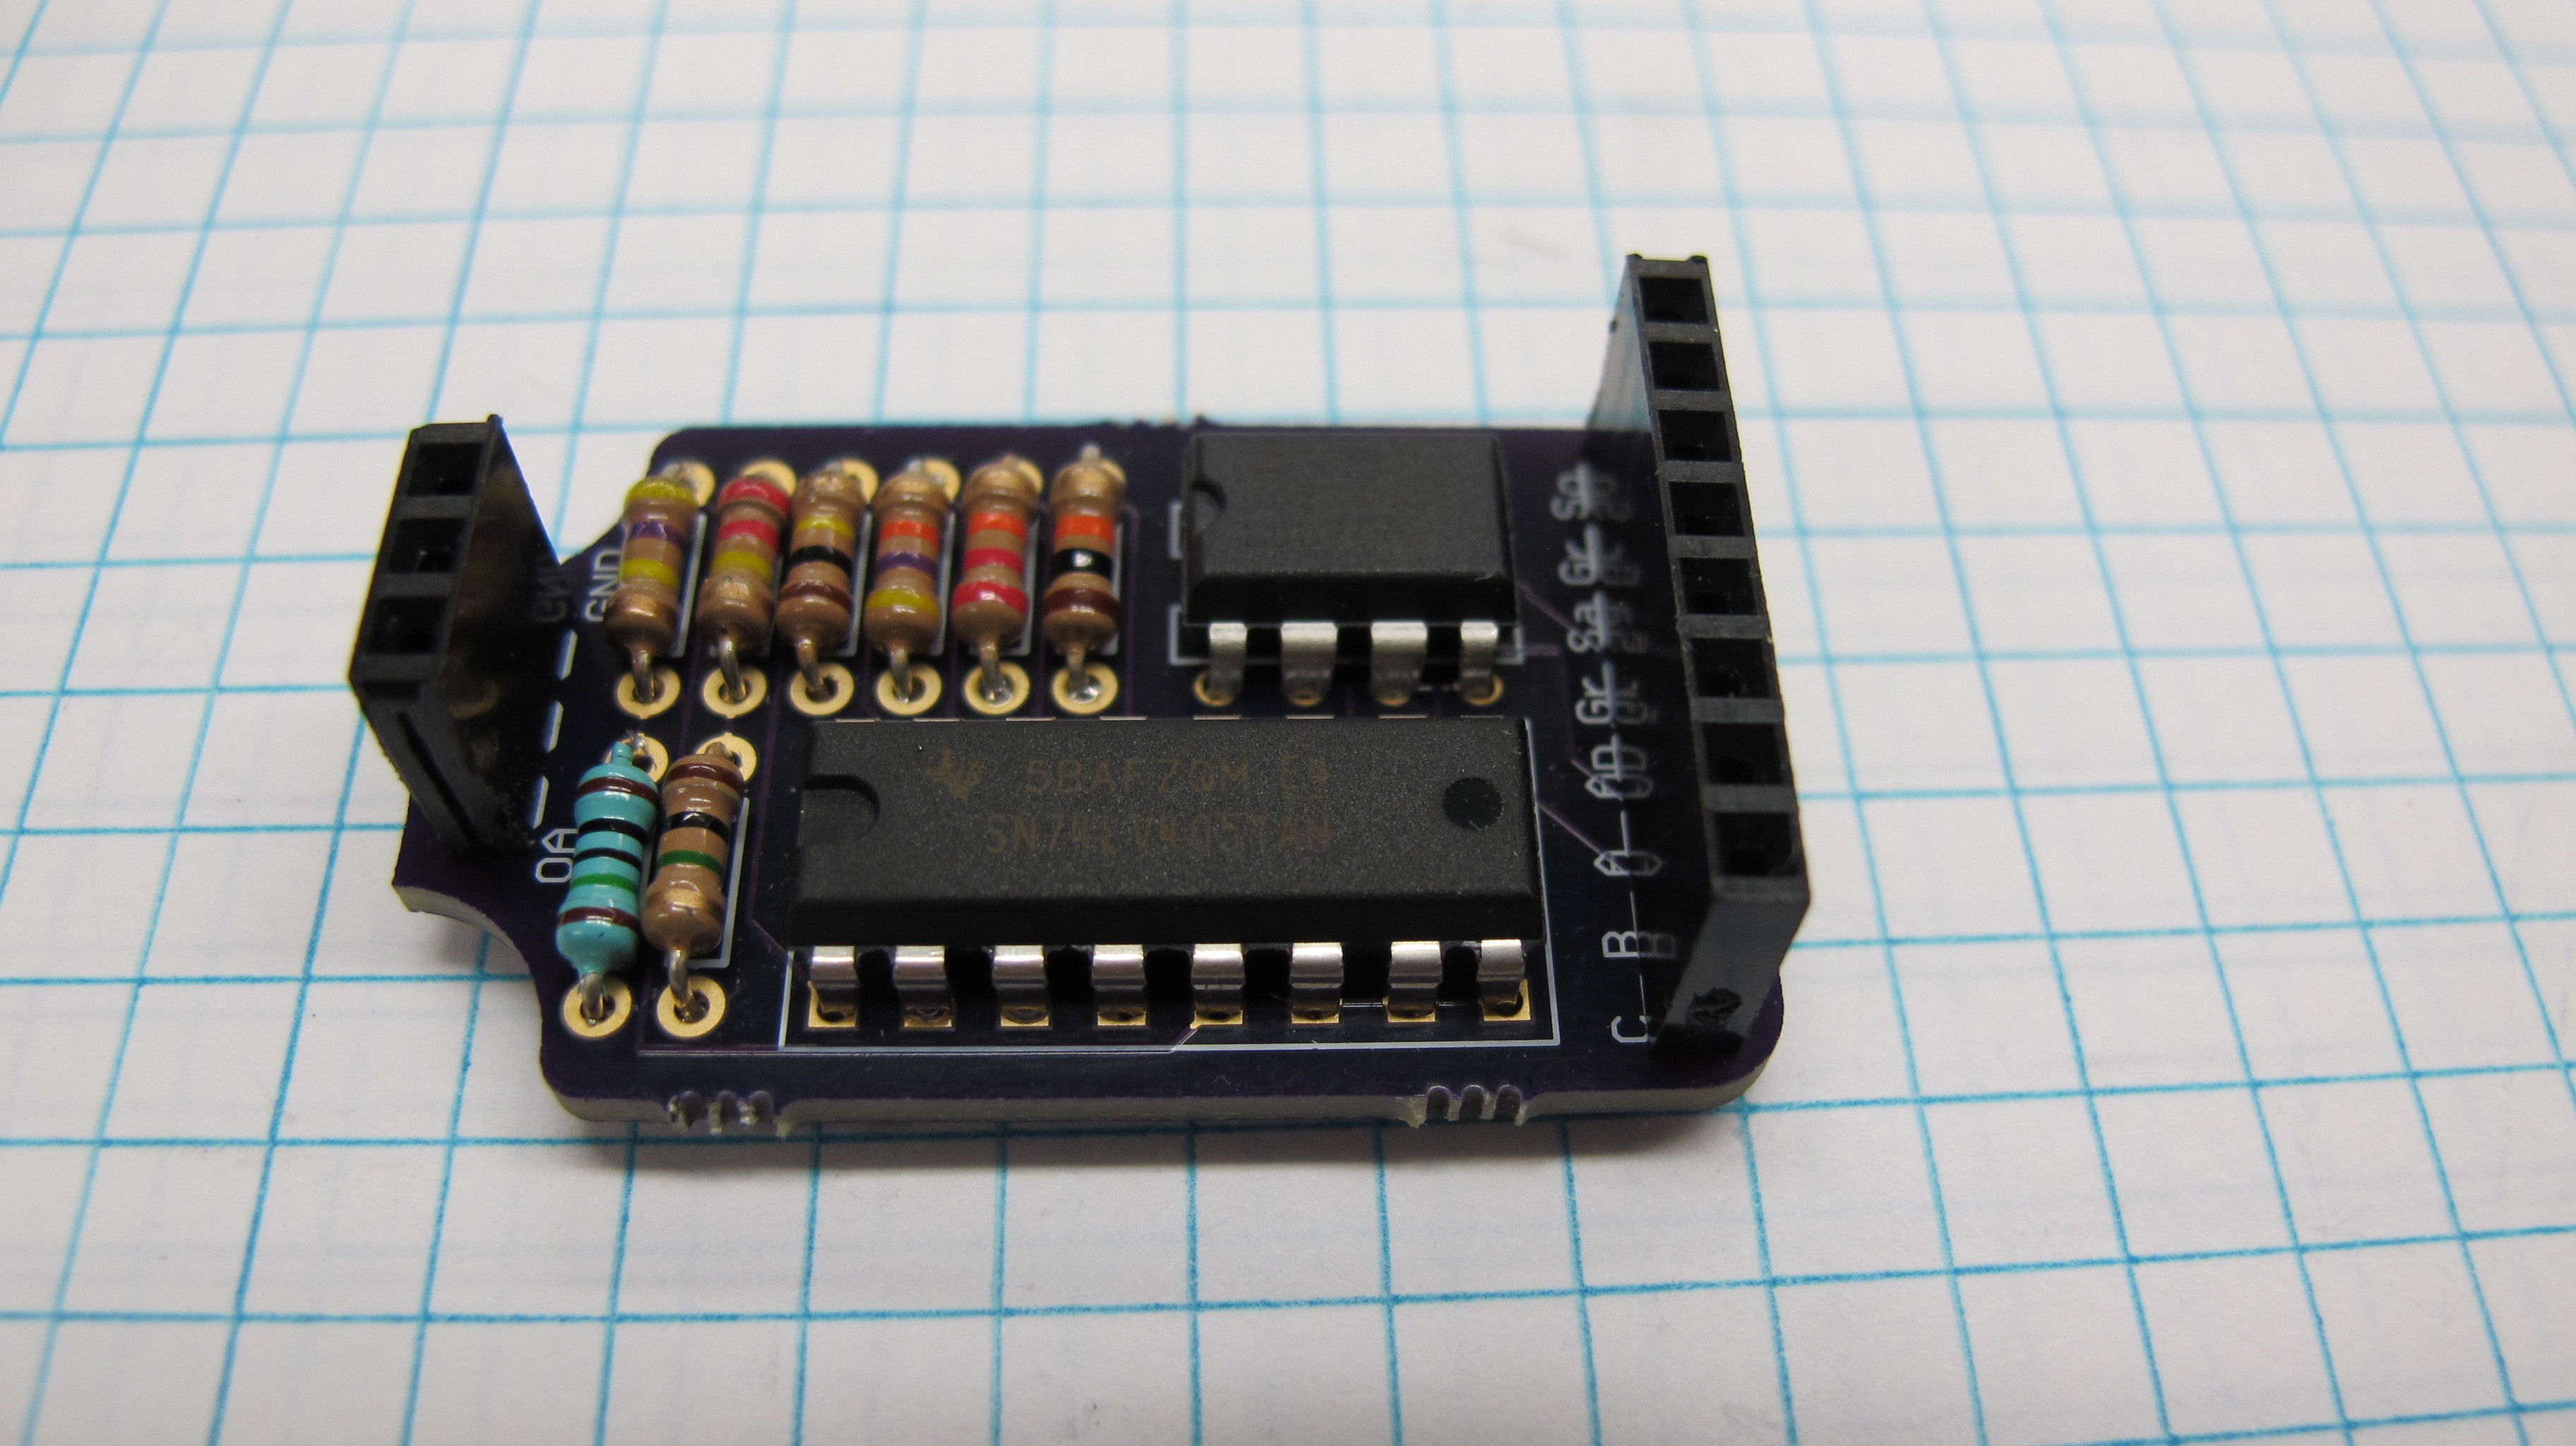
The image below is a very crude mockup of what I envision the circuitry of the profiler will be. The wiring is just symbolic and it is missing a lot of accessory components but the major components are there. The SD card board will be used to record all the sensor values along with the RTC times. The times from the RTC will be used to link the PAR values from the profiler with those from the base station at the surface. Op amps will be used to convert the current from the photodiodes to voltages and transistors will be used to control the fluorometer and backscatter LEDs.

Materials related to PULSE: Profiling Underwater Light SEnsor are licensed under:
Creative Commons Attribution Share-Alike 4.0 License
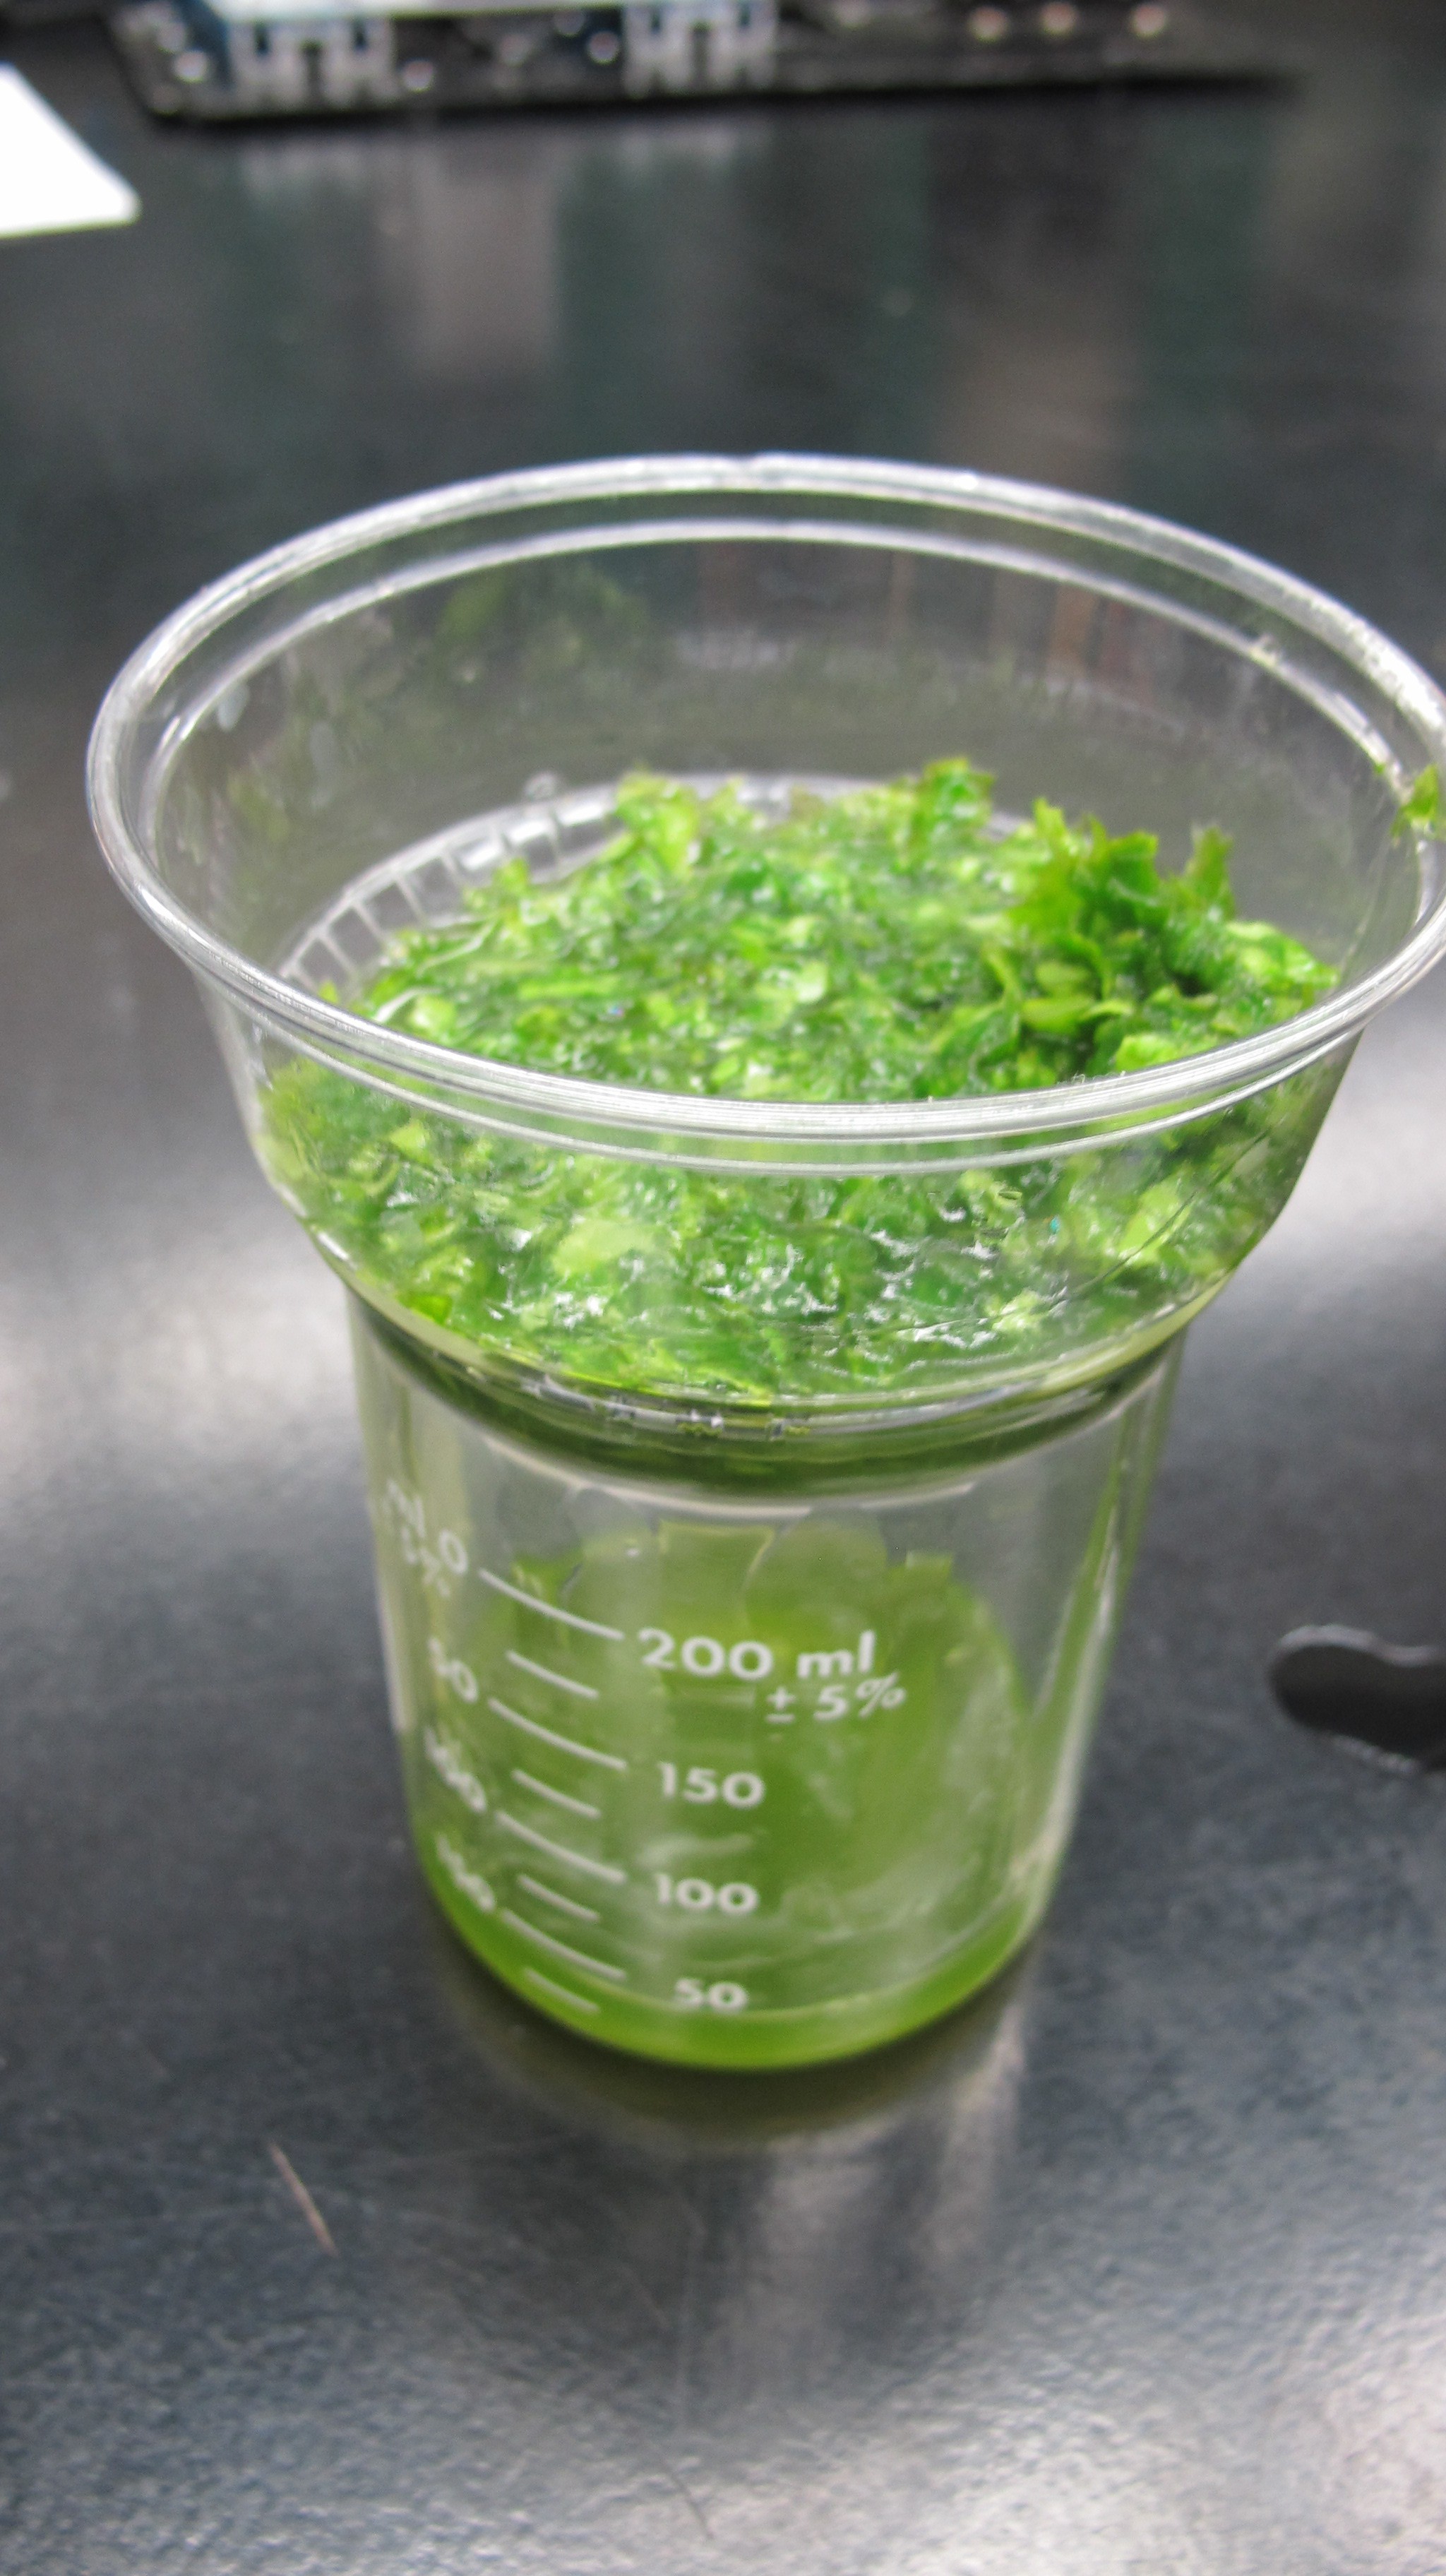
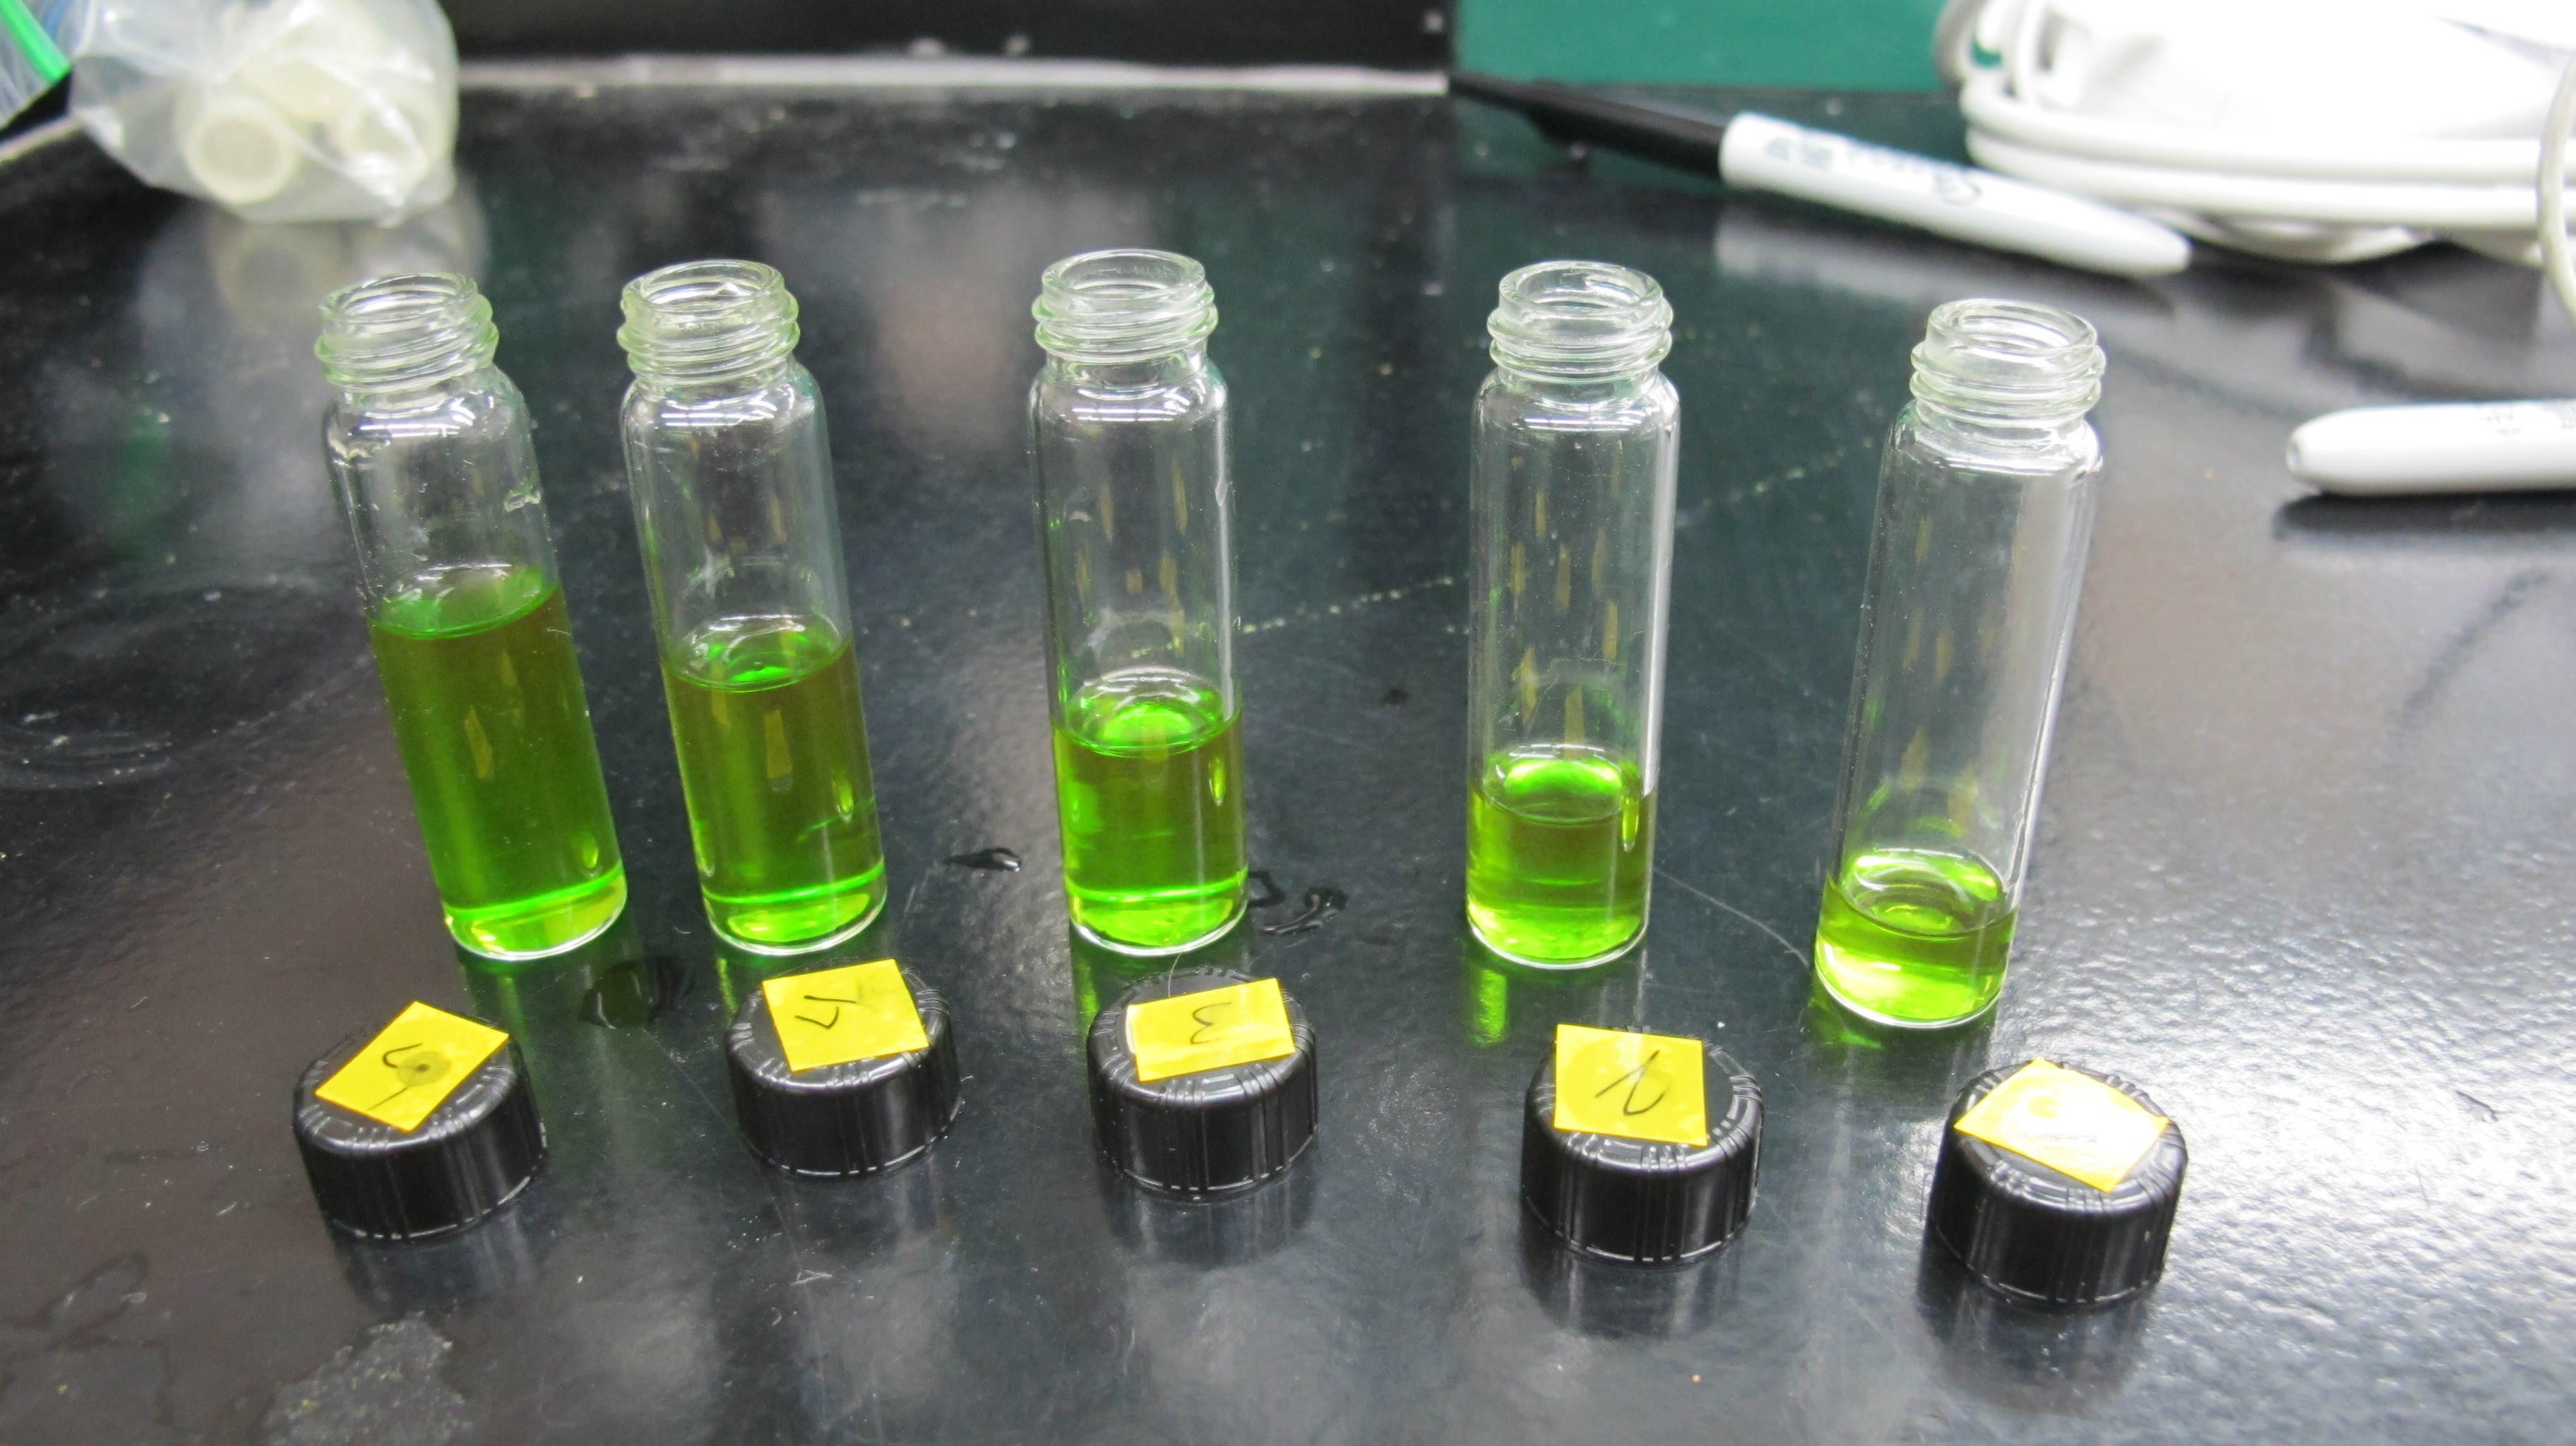 "Pure" chlorophyll extract


 mircemk
 Lithium ION
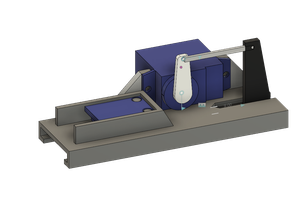
 Andrew Sowa
 Takahiro
The Vishay sensor you're using has a very bad spectral response for PAR measurements. It almost cuts out all of the blues. This causes light sources with the same PAR to read differently with your sensor (e.g. HPS vs CMH bulbs). I've seen sensors that were better in the blue region, attenuating to at most 40% (instead of the ~30% of the BPW 20), which is still not ideal.
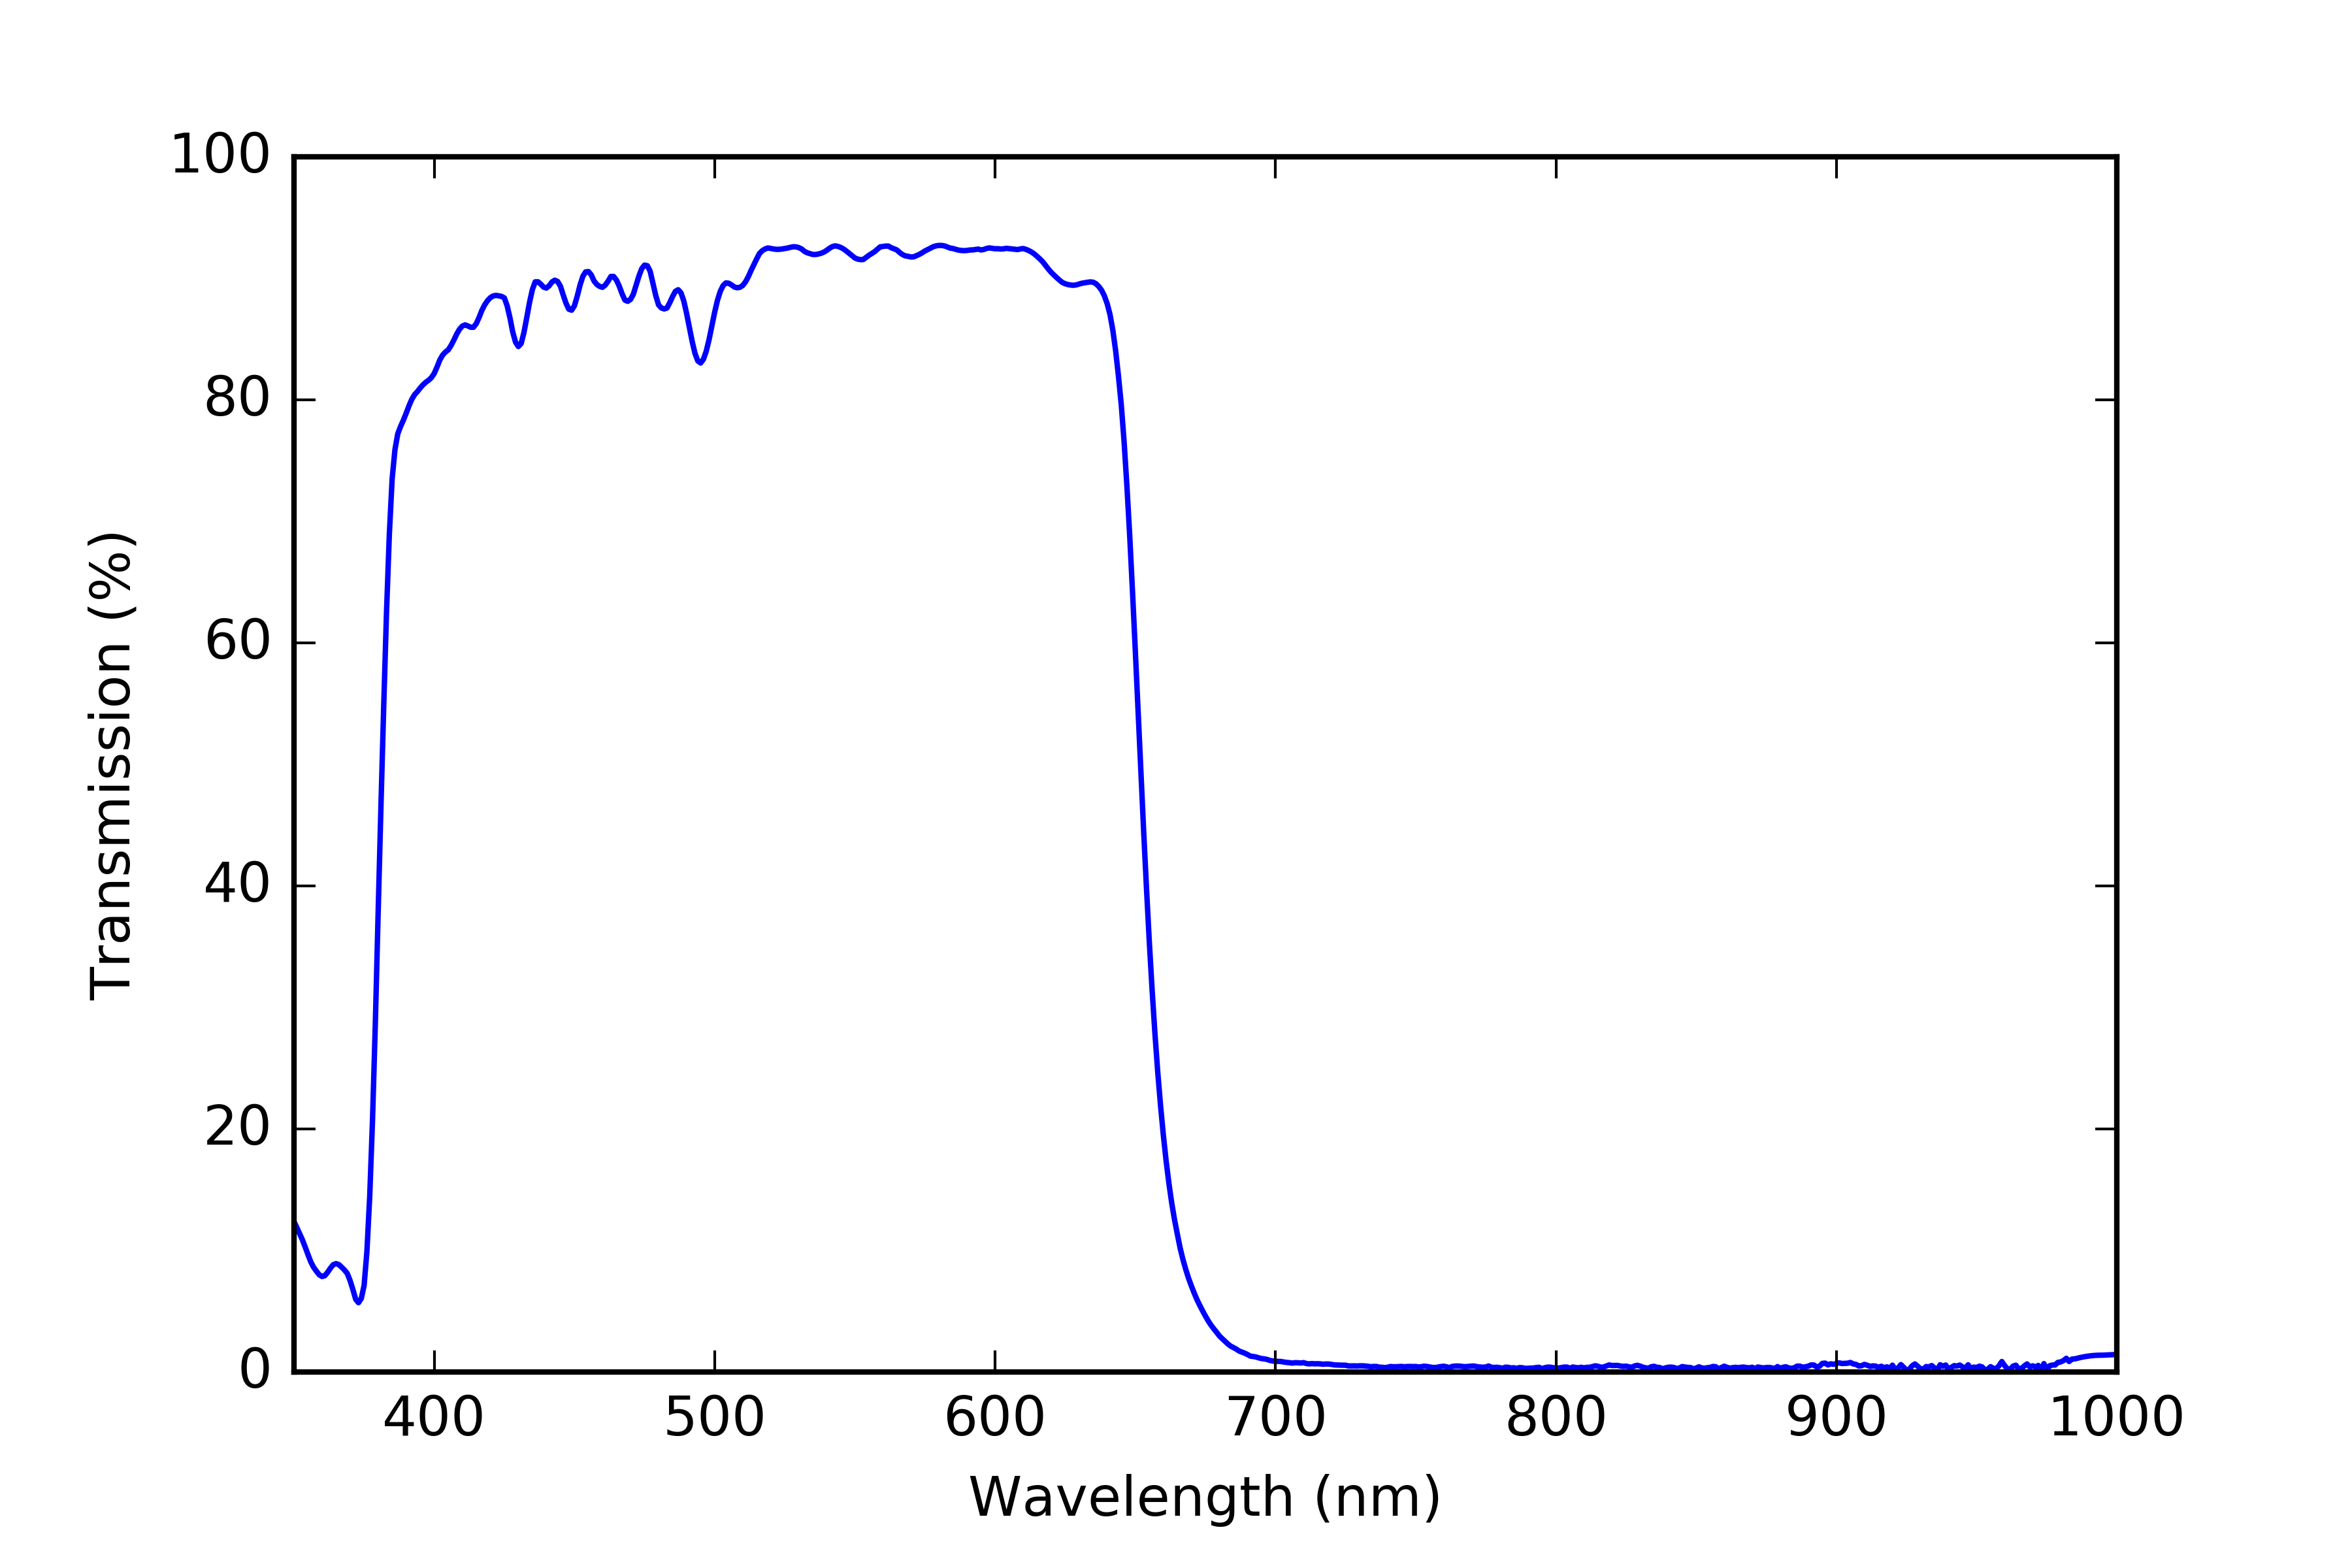
Furthermore, the bandpass filter you're using cuts too much of the reds. 650-670nm is an important wavelength in LED fixtures. Your filter blocks almost all of it.