 peter jansen
User Interface Design
Visualization and user interface design is a hobby that I really enjoy, and I've been lucky enough to have friends and colleagues who are usability and visualization folks that I've been able to periodically soak information up from. The open source science tricorders present a really interesting UI problem -- where most mobile devices have at most a few different sensing modalities, here we have 12 different physical sensors, each of which measures between 1 and 3 different things! What's more, while some of these measurements are single values (like temperature, say 24C), others are vector values (like the three separate 3-axis vectors coming from the MPU9150 -- one vector for acceleration, rotation, and magnetic field strength, giving nine values total, from a single sensor). In the extreme case, the spectrometer returns a vector of 256 values. That's a lot of data! I'm really not aware of any other device that comes close to having so many different kinds of sensing data pouring into it constantly, and while this is very exciting, it's also challenging -- we want folks to intuitively browse and navigate through that data very quickly.
I've spent the past few weeks researching design concepts for user interfaces by browsing popular design websites, and talking to some friends, and I think I've settled on a very intuitive, attractive, and useful interface design. I'll confess that I've been working harder, not smarter about this in recent years -- I'd try and design very complicated things that looked like how other people had done mobile devices and visualization (like android phones), which is a fantastic amount of work for a single human being. Starting this Arducorder mini project almost 4 months ago, and keeping it attractive and capable but tractable has finally helped me work smarter about this, and figure out a lightweight, usable and intuitive interface concept.
I like the idea of live tiles. When done well, it reminds me of Danny Hillis's idea (30 years ago) about maximizing the amount of computing silicon active on a processor at any one time, but attractively applied to data visualization. Instead of having icons that just take up space and give you a name, here you have tiles that display a live updating value. This is powerful from a usability perspective -- instead of having to enter each application to obtain this information (which can consume a lot of time), the most important information is available at a glance from many applications. While this has largely been applied to communication (e.g. messaging), web (weather/news), and I'm sure sensing applications, here we're going to construct an interface made almost entirely of sensor data.
The really interesting aspect (if you're a data abstraction nerd, like me) is that if we consider only this special case -- visualizing sensor data through tiles -- then we can formulate the software engineering aspect of this very elegantly. If each tile has a sensor data buffer behind it, then we can browse it's most recent data on the top of the tile, then activate the tile to display additional (historical) data and different visualizations. If we abstract the sensor data buffer into a few different types, like continuous streaming data (from something like a temperature sensor or an accelerometer) and discretely sampled data (from something like a lightning sensor, that only activates when an event occurs), then we can get rid of the idea of an application. The design concept becomes browsing sensor data buffers first through a high-level tile interface, and then activating an individual buffer and using a suite of generic visualization tools to better explore it.
Interface Implementation
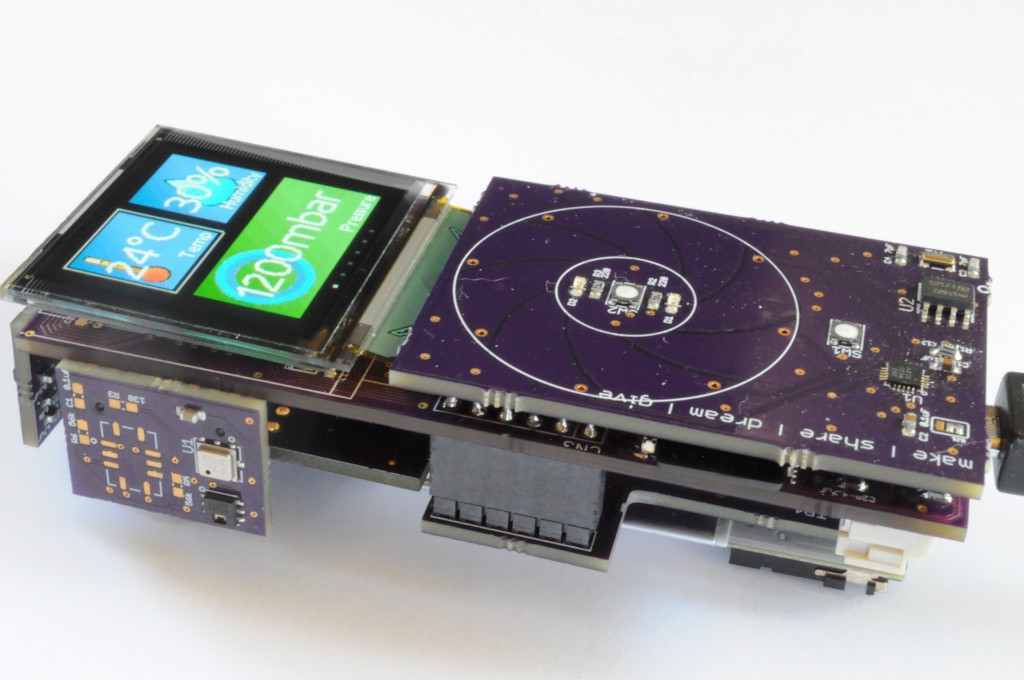
All of the software engineering aside, what the user sees is very attractive -- tiles with live data that they can browse through very quickly with the capacitive touch wheel. The tiles themselves are rectangles with a linear gradient, a bitmap (using the posterizing tool I posted in the last update), a small right-justified name on the bottom, and center-justified data in larger text. The bitmaps are all designed to have simple easily-recognizable shapes and gradient colour palettes to make them sharp and attractive.
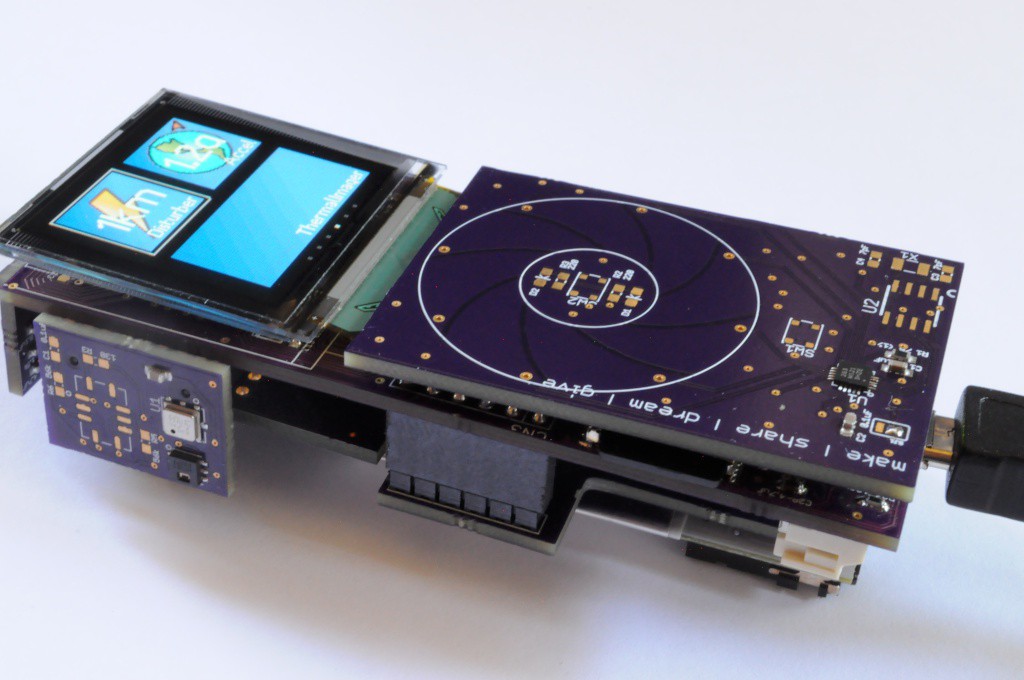
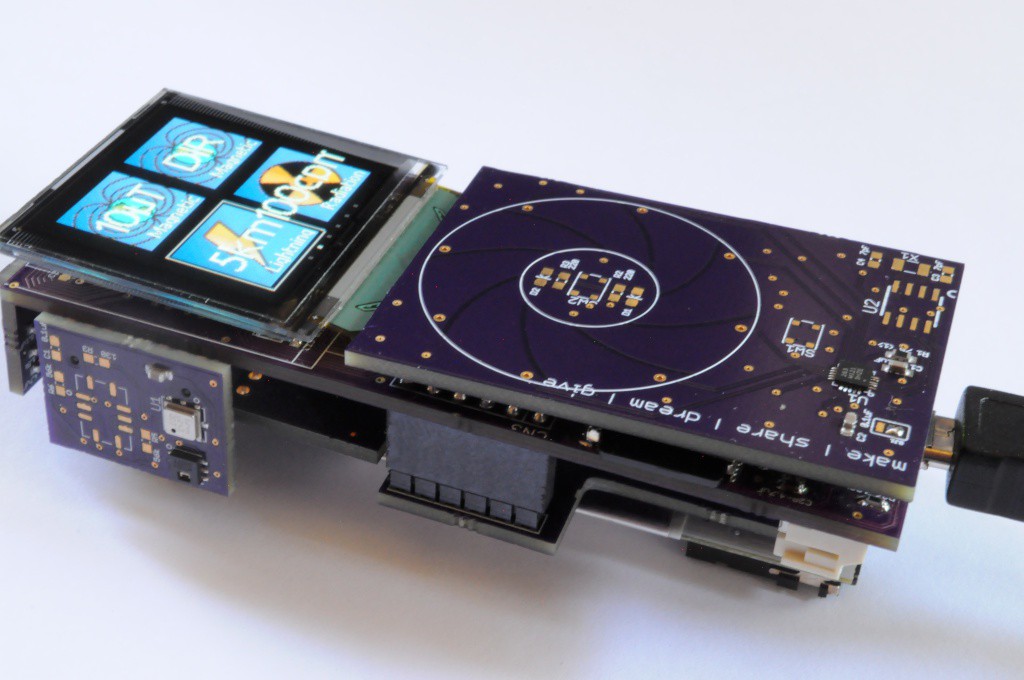
The tile engine itself is still incomplete -- I need to link the tile data structures to the sensor data buffers elegantly, so right now the tile data is just static placeholder text. There are also two tile types where I'd like to replace the bitmap symbol with actual data. The first is for the 16x4 thermal imager, where I'd like it to show actual 2D image data, and the second is for the spectrometer, where I'd like it to show a small 1D spectrum.
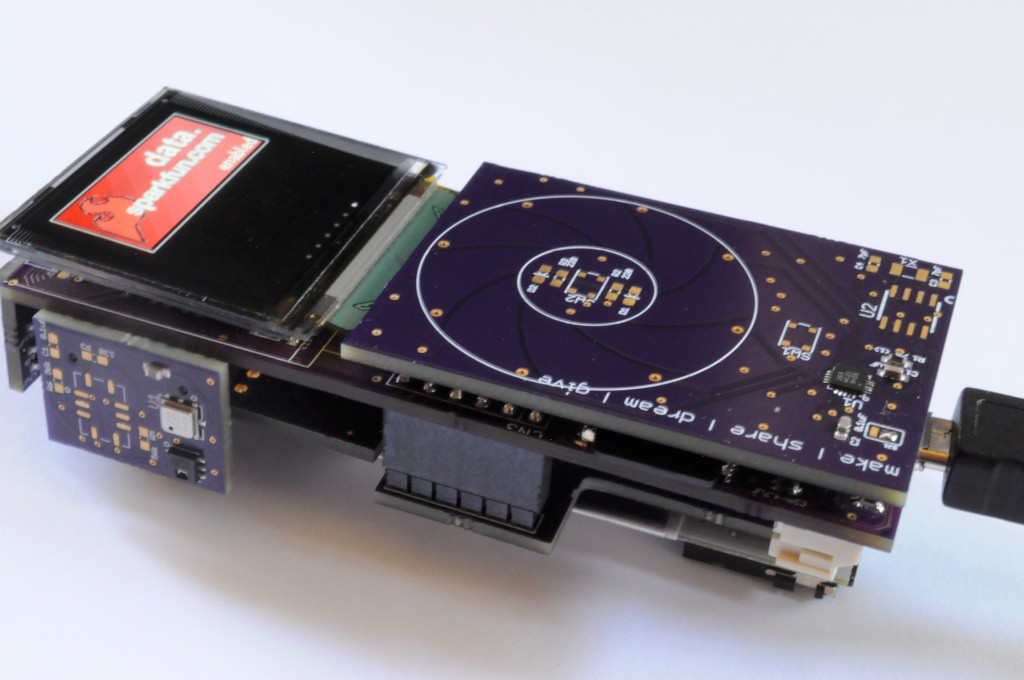
Finally, in addition to sensor data tiles, I'd also like to include utility tiles that allow someone to change a few important setup parameters. Connectivity is a huge theme for a device like the Arducorder Mini, and this could take you in many directions. I've decided the first of those directions will be to interface with the data.sparkfun.com cloud data storage service, which was recently put together by the folks at Sparkfun for exactly this purpose. I'm okay at scientific and embedded programming, but not terribly experienced with web programming, so I think putting together the software to interface with this service (on the Arducorder Mini side) will be a great working example for amazing web programmers with a tinkering spirit in the open source community to do wonderful things.
Spectrometer Board
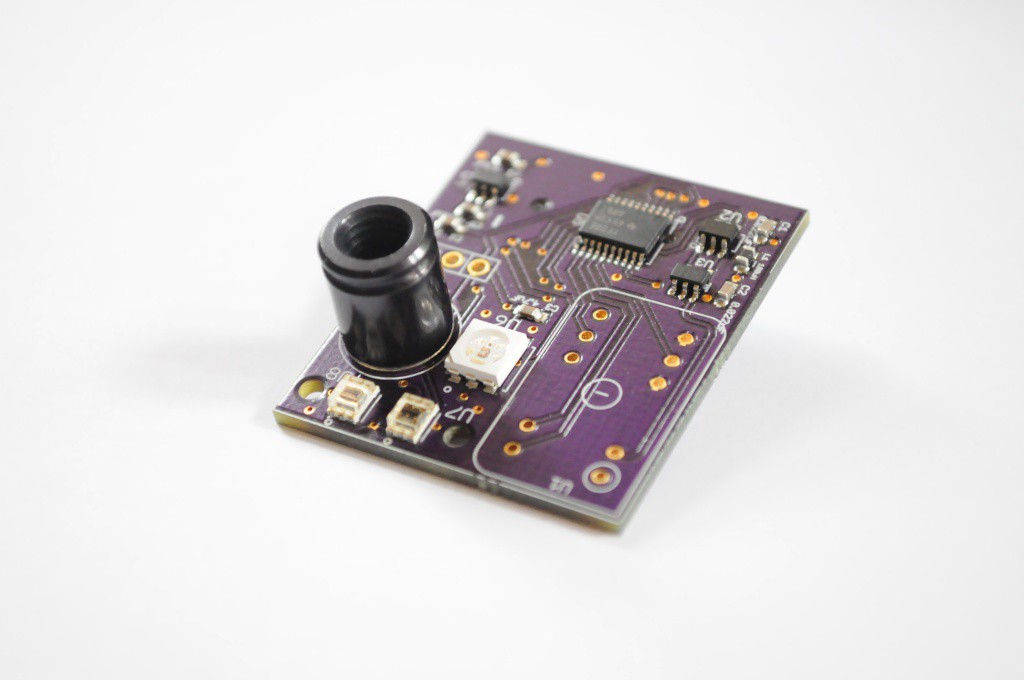
On the hardware side, the spectrometer/thermal camera boards arrived, and I put one together this week. The brand new Hamamatsu micro spectrometer is a longer lead time part, but should arrive sometime late next week (likely a little short of time to get it working in time for the semifinal video). This board has a lot on it, and the rest is ready to test! The 16x4 MLX90620 low resolution thermal imager, an RGB light source for initially experimenting with the spectrometer (and a header for optionally adding in a different light source overtop later), and two light sensors that narrow-band filters can be placed overtop of (here, to construct a polarization sensor). There's also supporting circuitry for the mini spectrometer, including a 5V boost circuit, a 14-bit ADC, as well as an opamp and power filter to keep both electrical and thermal noise at a minimum.
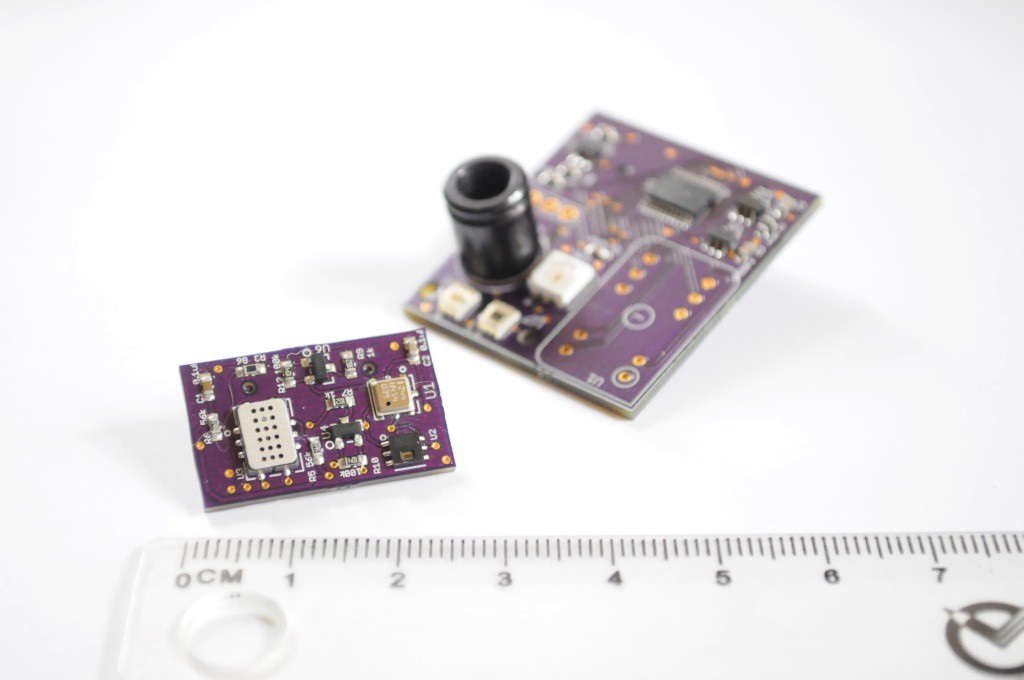
Finally, the second revision of the atmospheric sensor board also arrived, which now includes MOSFETs to handle the ~30ma current draw for each of the heaters used by the MICS-6814 triple gas sensor. This means that it shouldn't blow up the I/O pins of the PIC32 when I try to interface with it. This board also includes the HTU21D humidity and BMP180 barometric pressure sensors. It's difficult to describe how very tiny these boards are, so I included a ruler in this picture -- the atmospheric board is literally the size of the tip of my finger, where the "huge" spectrometer board is more tip-of-the-thumb sized. It's really incredible!
It's really rewarding to see all of this take shape, and to see the user interface evolve, and all of the puzzle pieces starting to come together. There have also been a few late nights over the weekend, in no small part due to a hungry baby kitten showing up on my doorstep, and spending most of the last few evenings nursing it back to health. The other night when I went to record the video for this post, I had thought the Arducorder Mini was suddenly and mysteriously nonworking, and it took an hour to realize that it was because the battery was dead. Turns out I'm smart like that. Glad to see all those years of grad school counted for something... :)
Thanks for reading, and stay tuned!
Discussions
Become a Hackaday.io Member
Create an account to leave a comment. Already have an account? Log In.
Are you sure? yes | no