 tshen2
in the previous update, i fretted about the 146Hz node in my listening room, and wondered if i could fix it. you can't just fix it by turning up the gain at 146Hz - it's like pouring sand into a black hole. the problem has to be fixed acoustically, so it's time to try bass-trapping.
bass-trapping is the process of shoving huge amounts of foam and/or fiberglass into the edges and corners of a room to dampen a room's low-frequency modes. it's a popular thing to do in listening rooms and/or home studios, and some people think it's the very first thing you should do. i'm not convinced. that much damping material is really going to cost you, and mounting it in a habitable space is quite non-trivial. but i like science, which means i have to try. i have to try to do it right.
so here's the experiment - get one block of acoustic foam at a decent price, mount it in the most theoretically sound place (ha), and see if the change is worthwhile enough to justify further expense. here we go!
question 1: where to put it?
i want to damp the 146Hz mode specifically. i have one big foam block, and it has to count. where should i mount it?
here's where some science comes in. sound travels through orthogonal fluctuations in pressure and velocity. my foam block should have the maximum effect if i place it in a high-velocity region of the 146Hz mode. somewhere in the room, the 146Hz mode has a velocity antinode. how can i find this antinode?
well, my speakers are pressure sources. my microphones are pressure sensors. and velocity is orthogonal to pressure.
so if i play a 146Hz tone through my speakers, and i can find a spot somewhere in the room where the sound pressure is abnormally low, that should be a high-velocity spot - the best spot to place my block of foam.
here's a needlessly complicated way to probe the room for sound pressure:
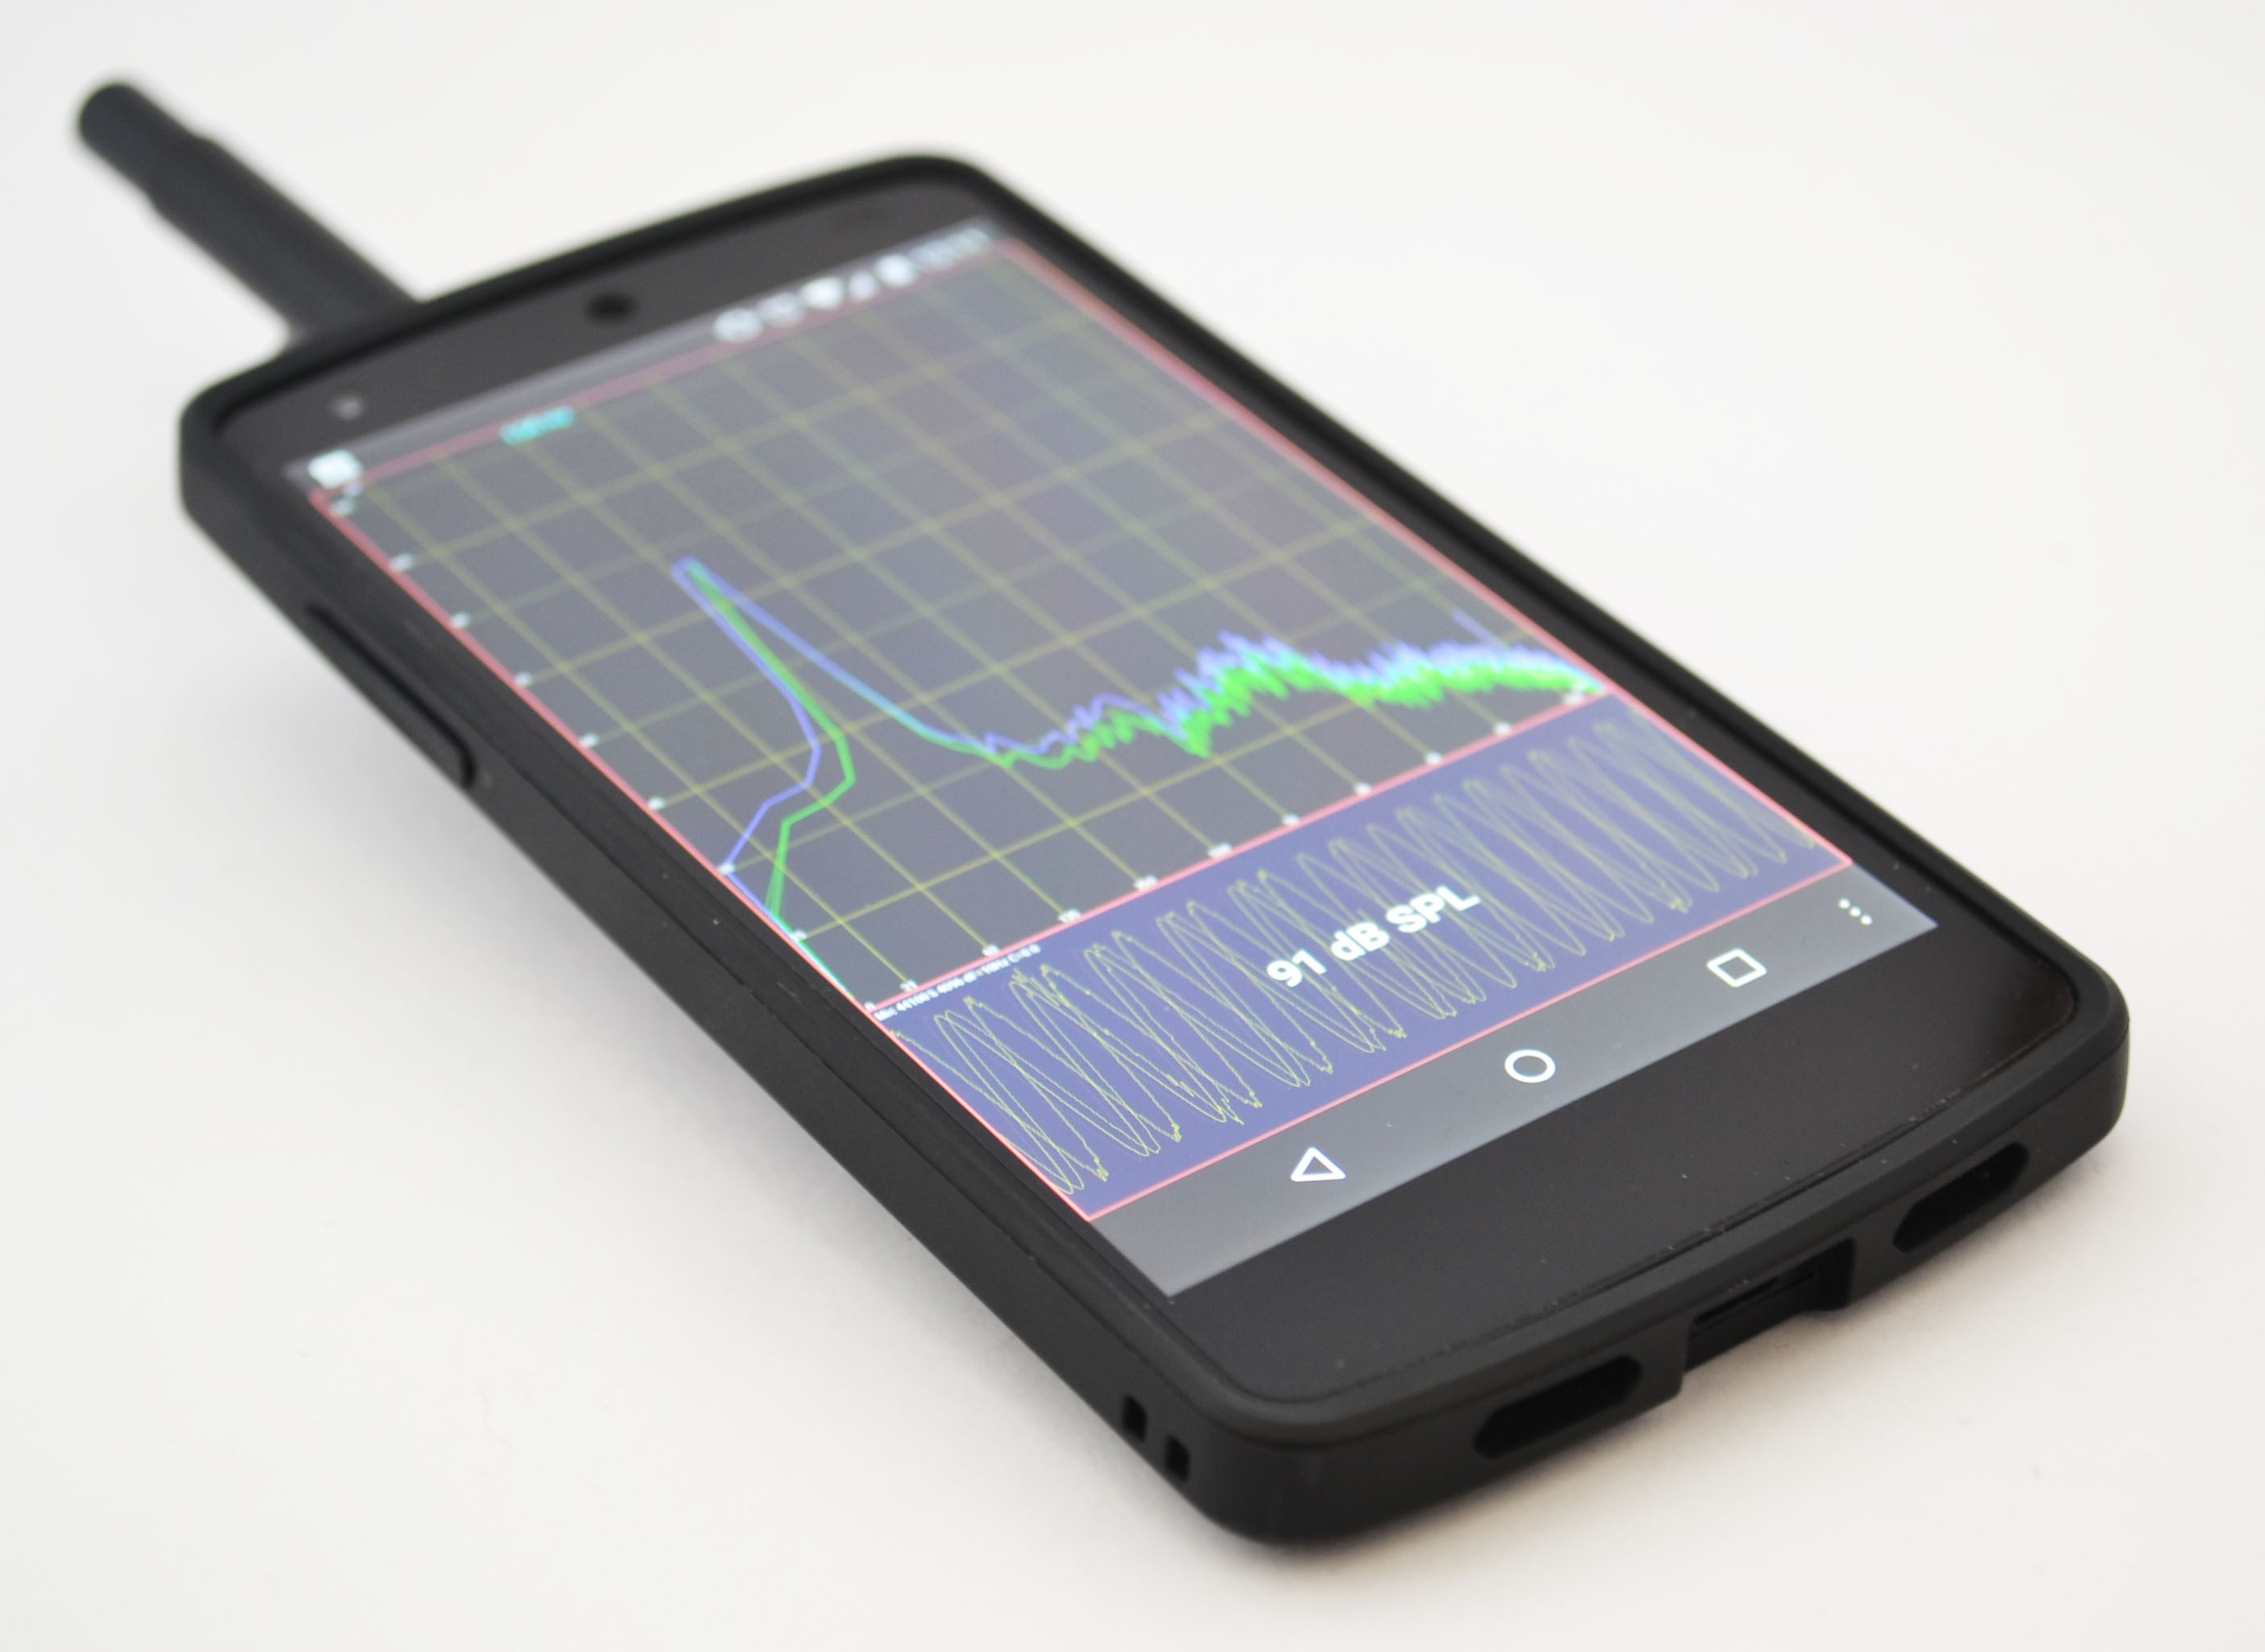
that's a Nexus 5 running AudioTool, connected to a calibrated Dayton iMM-6 measurement microphone. i probe the room with the phone mounted at the end of a long stick. it streams video (screen mirroring) through a Chromecast so that i can wirelessly watch the spectrum. and all of this works, but you know what.. forget it.
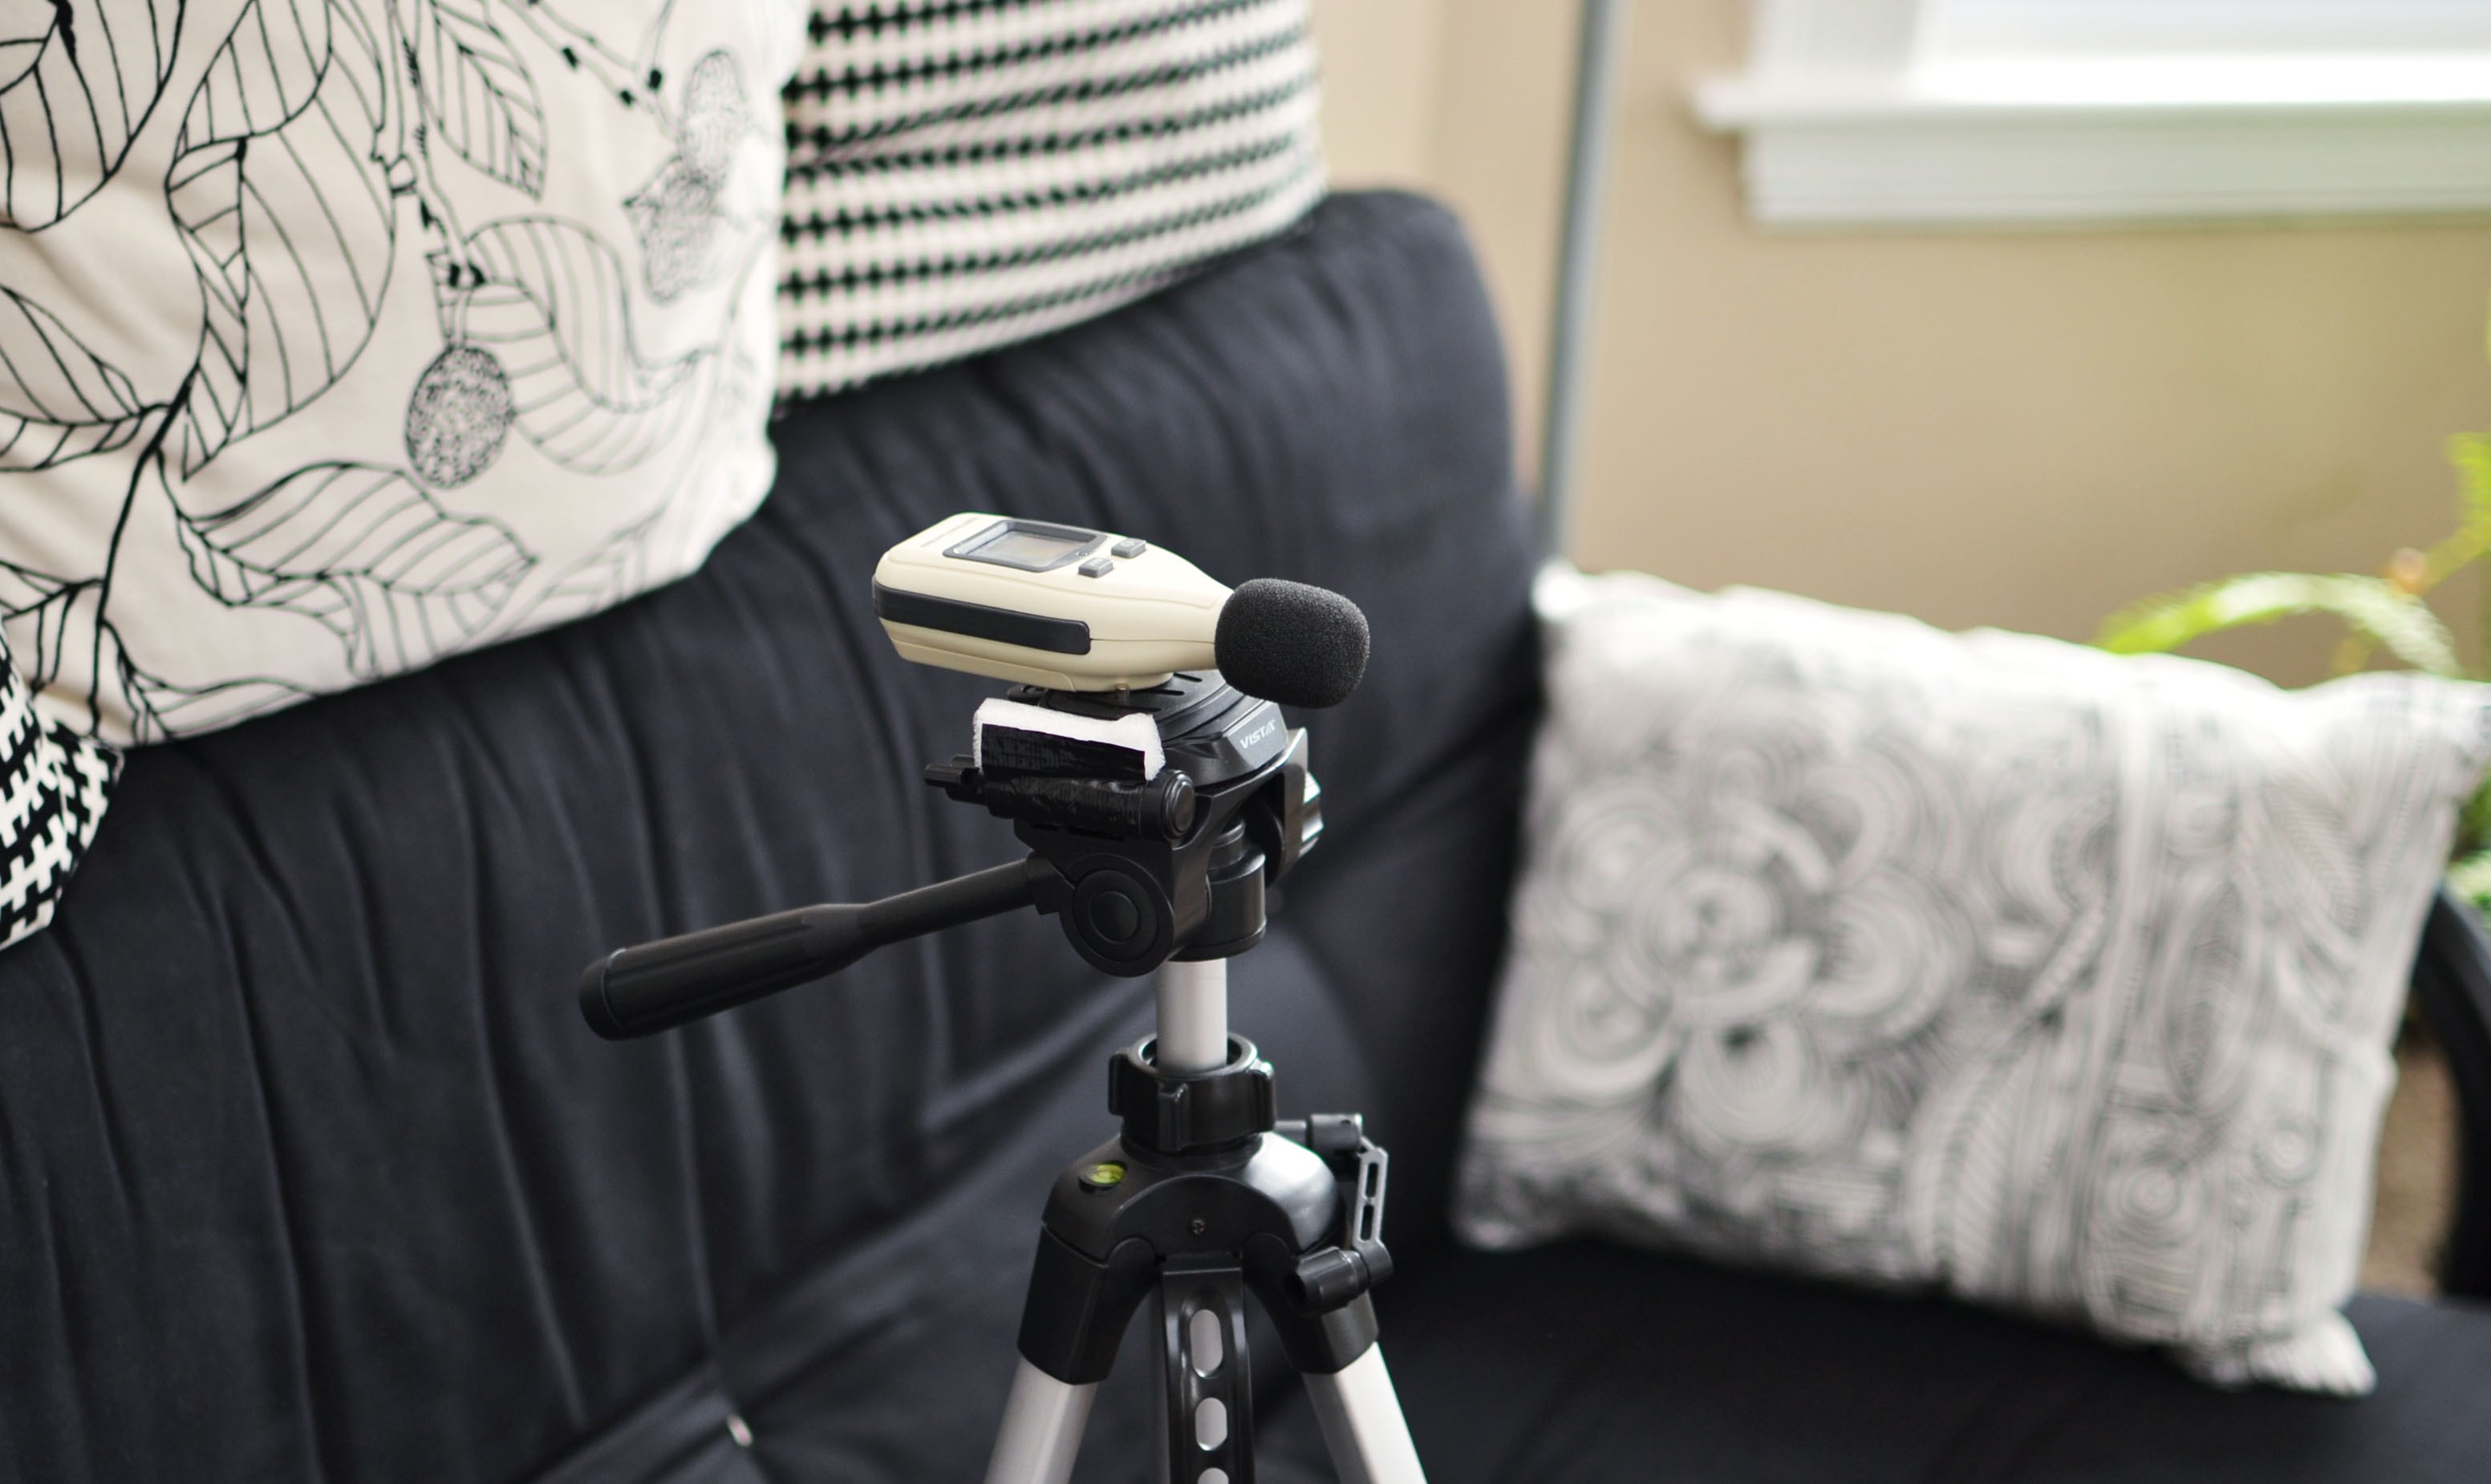
this is what i actually used:
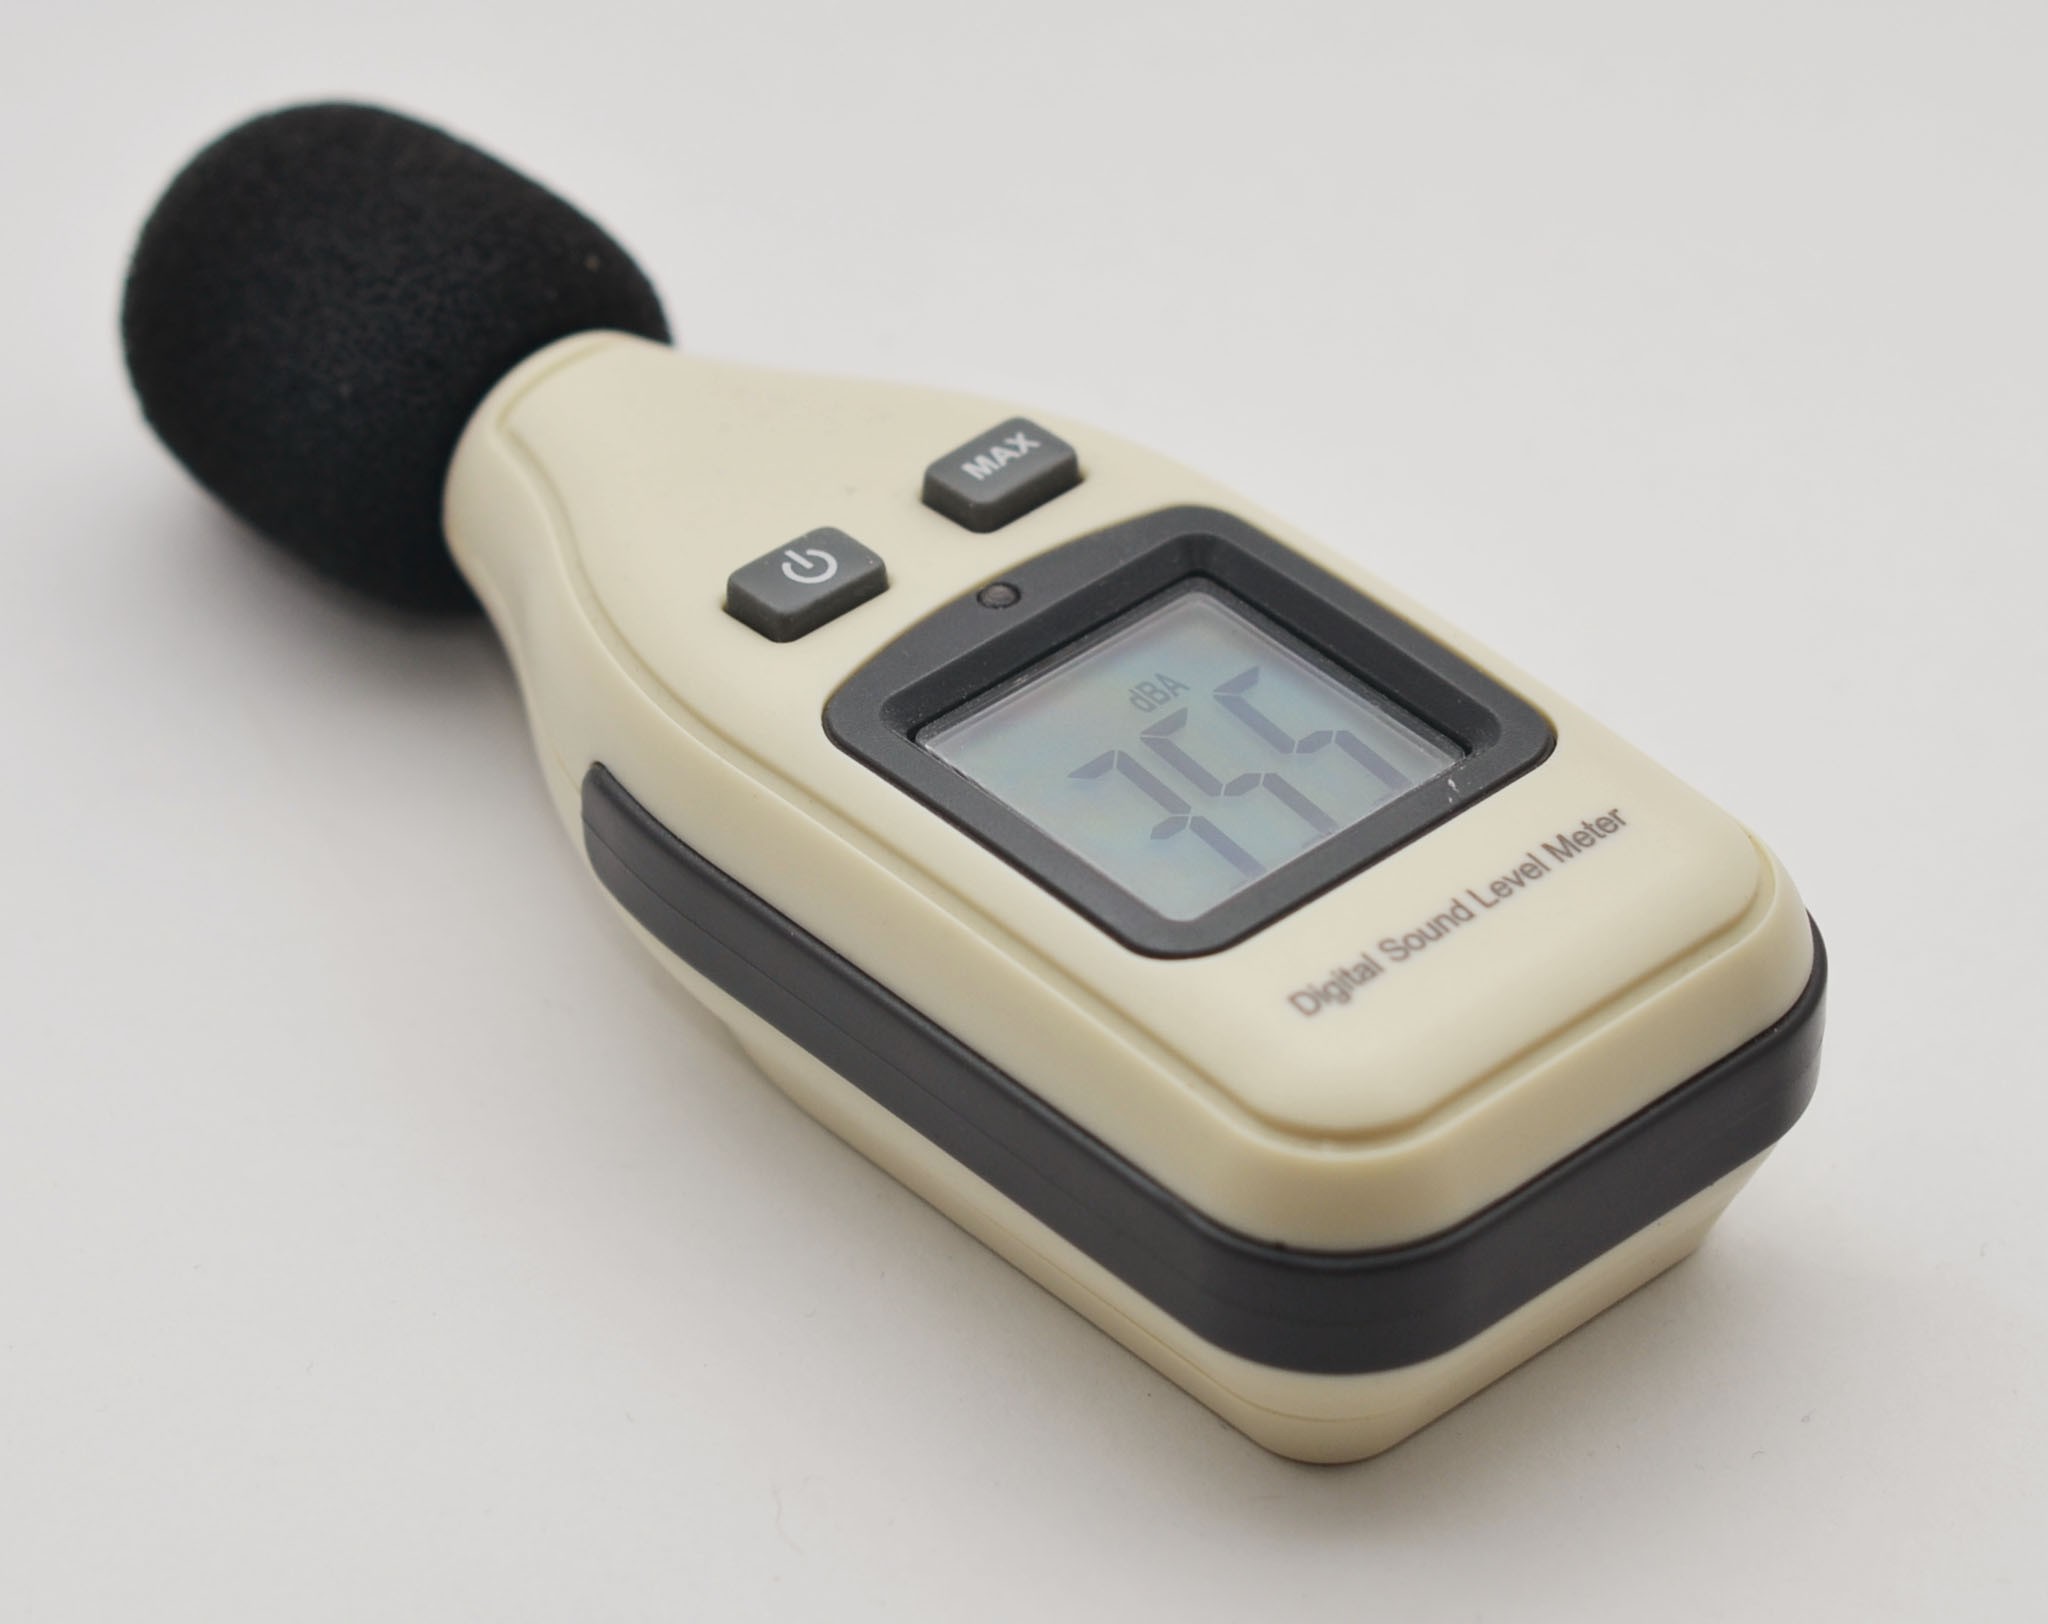
[a $20 SPL meter and a long stick.]
the speakers are now blasting 146Hz. some rummaging reveals a spot in the room where sound pressure is >15dB lower than almost everywhere else. it's a winner!
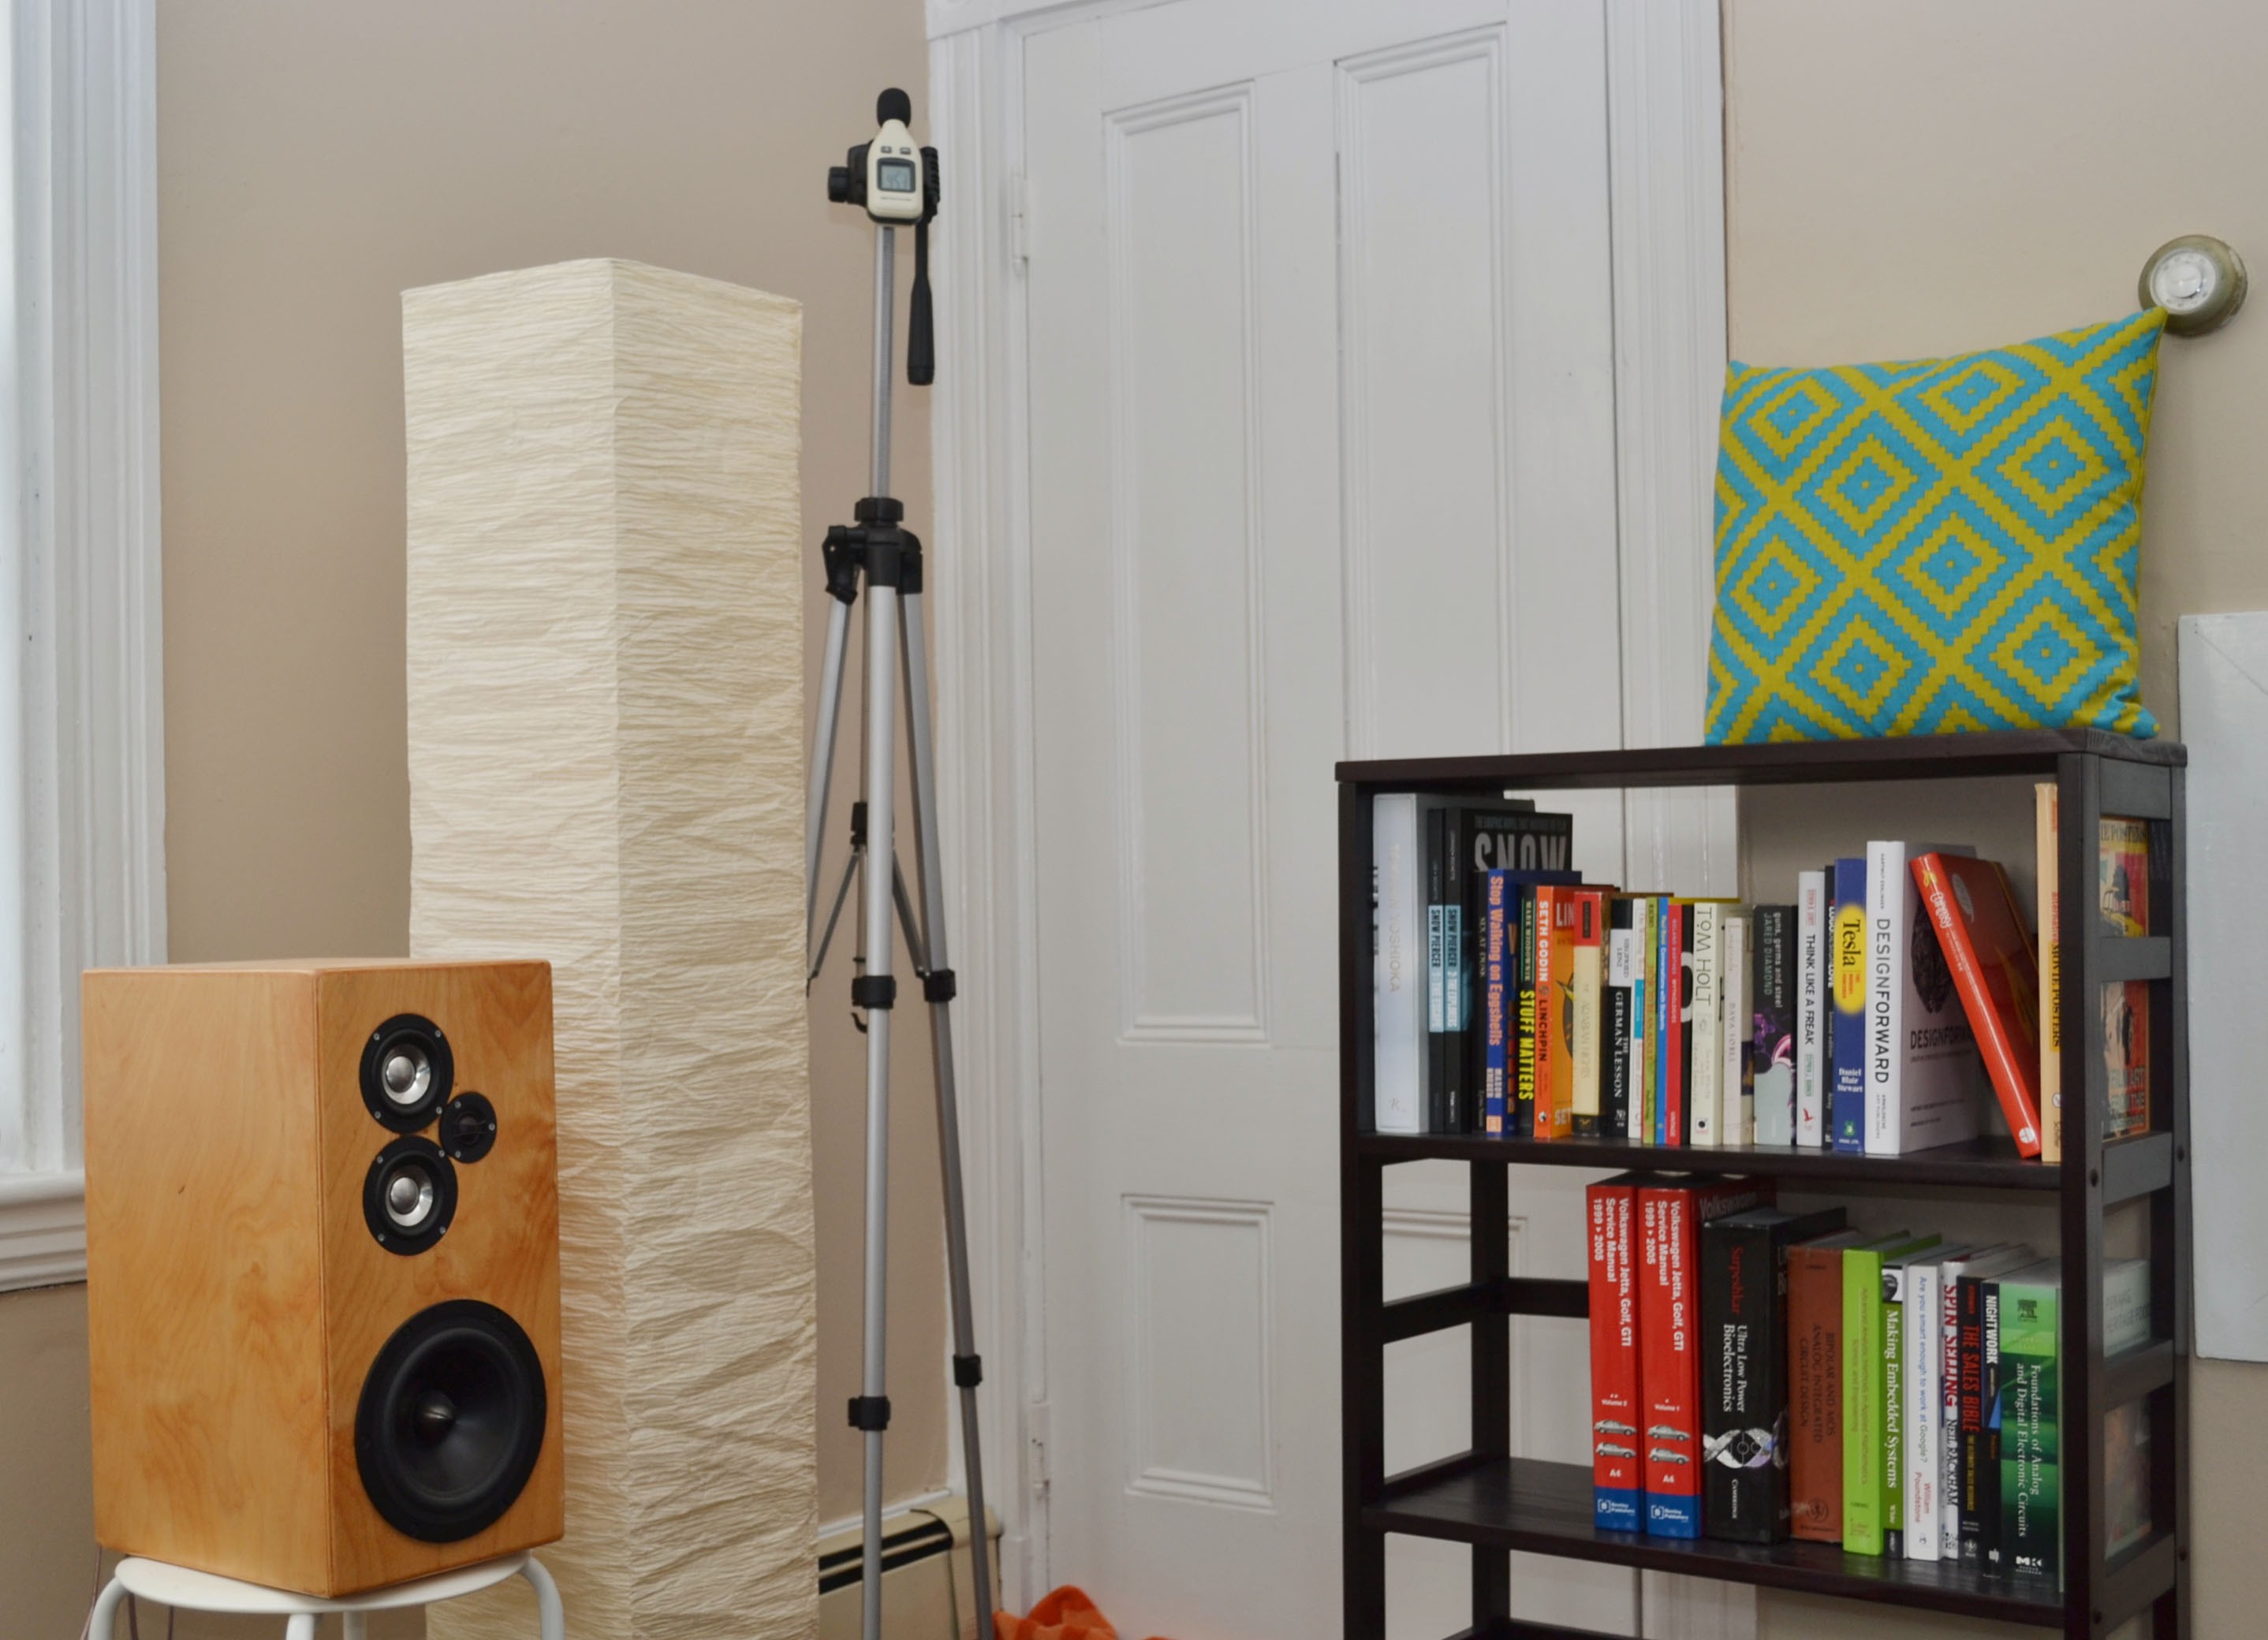
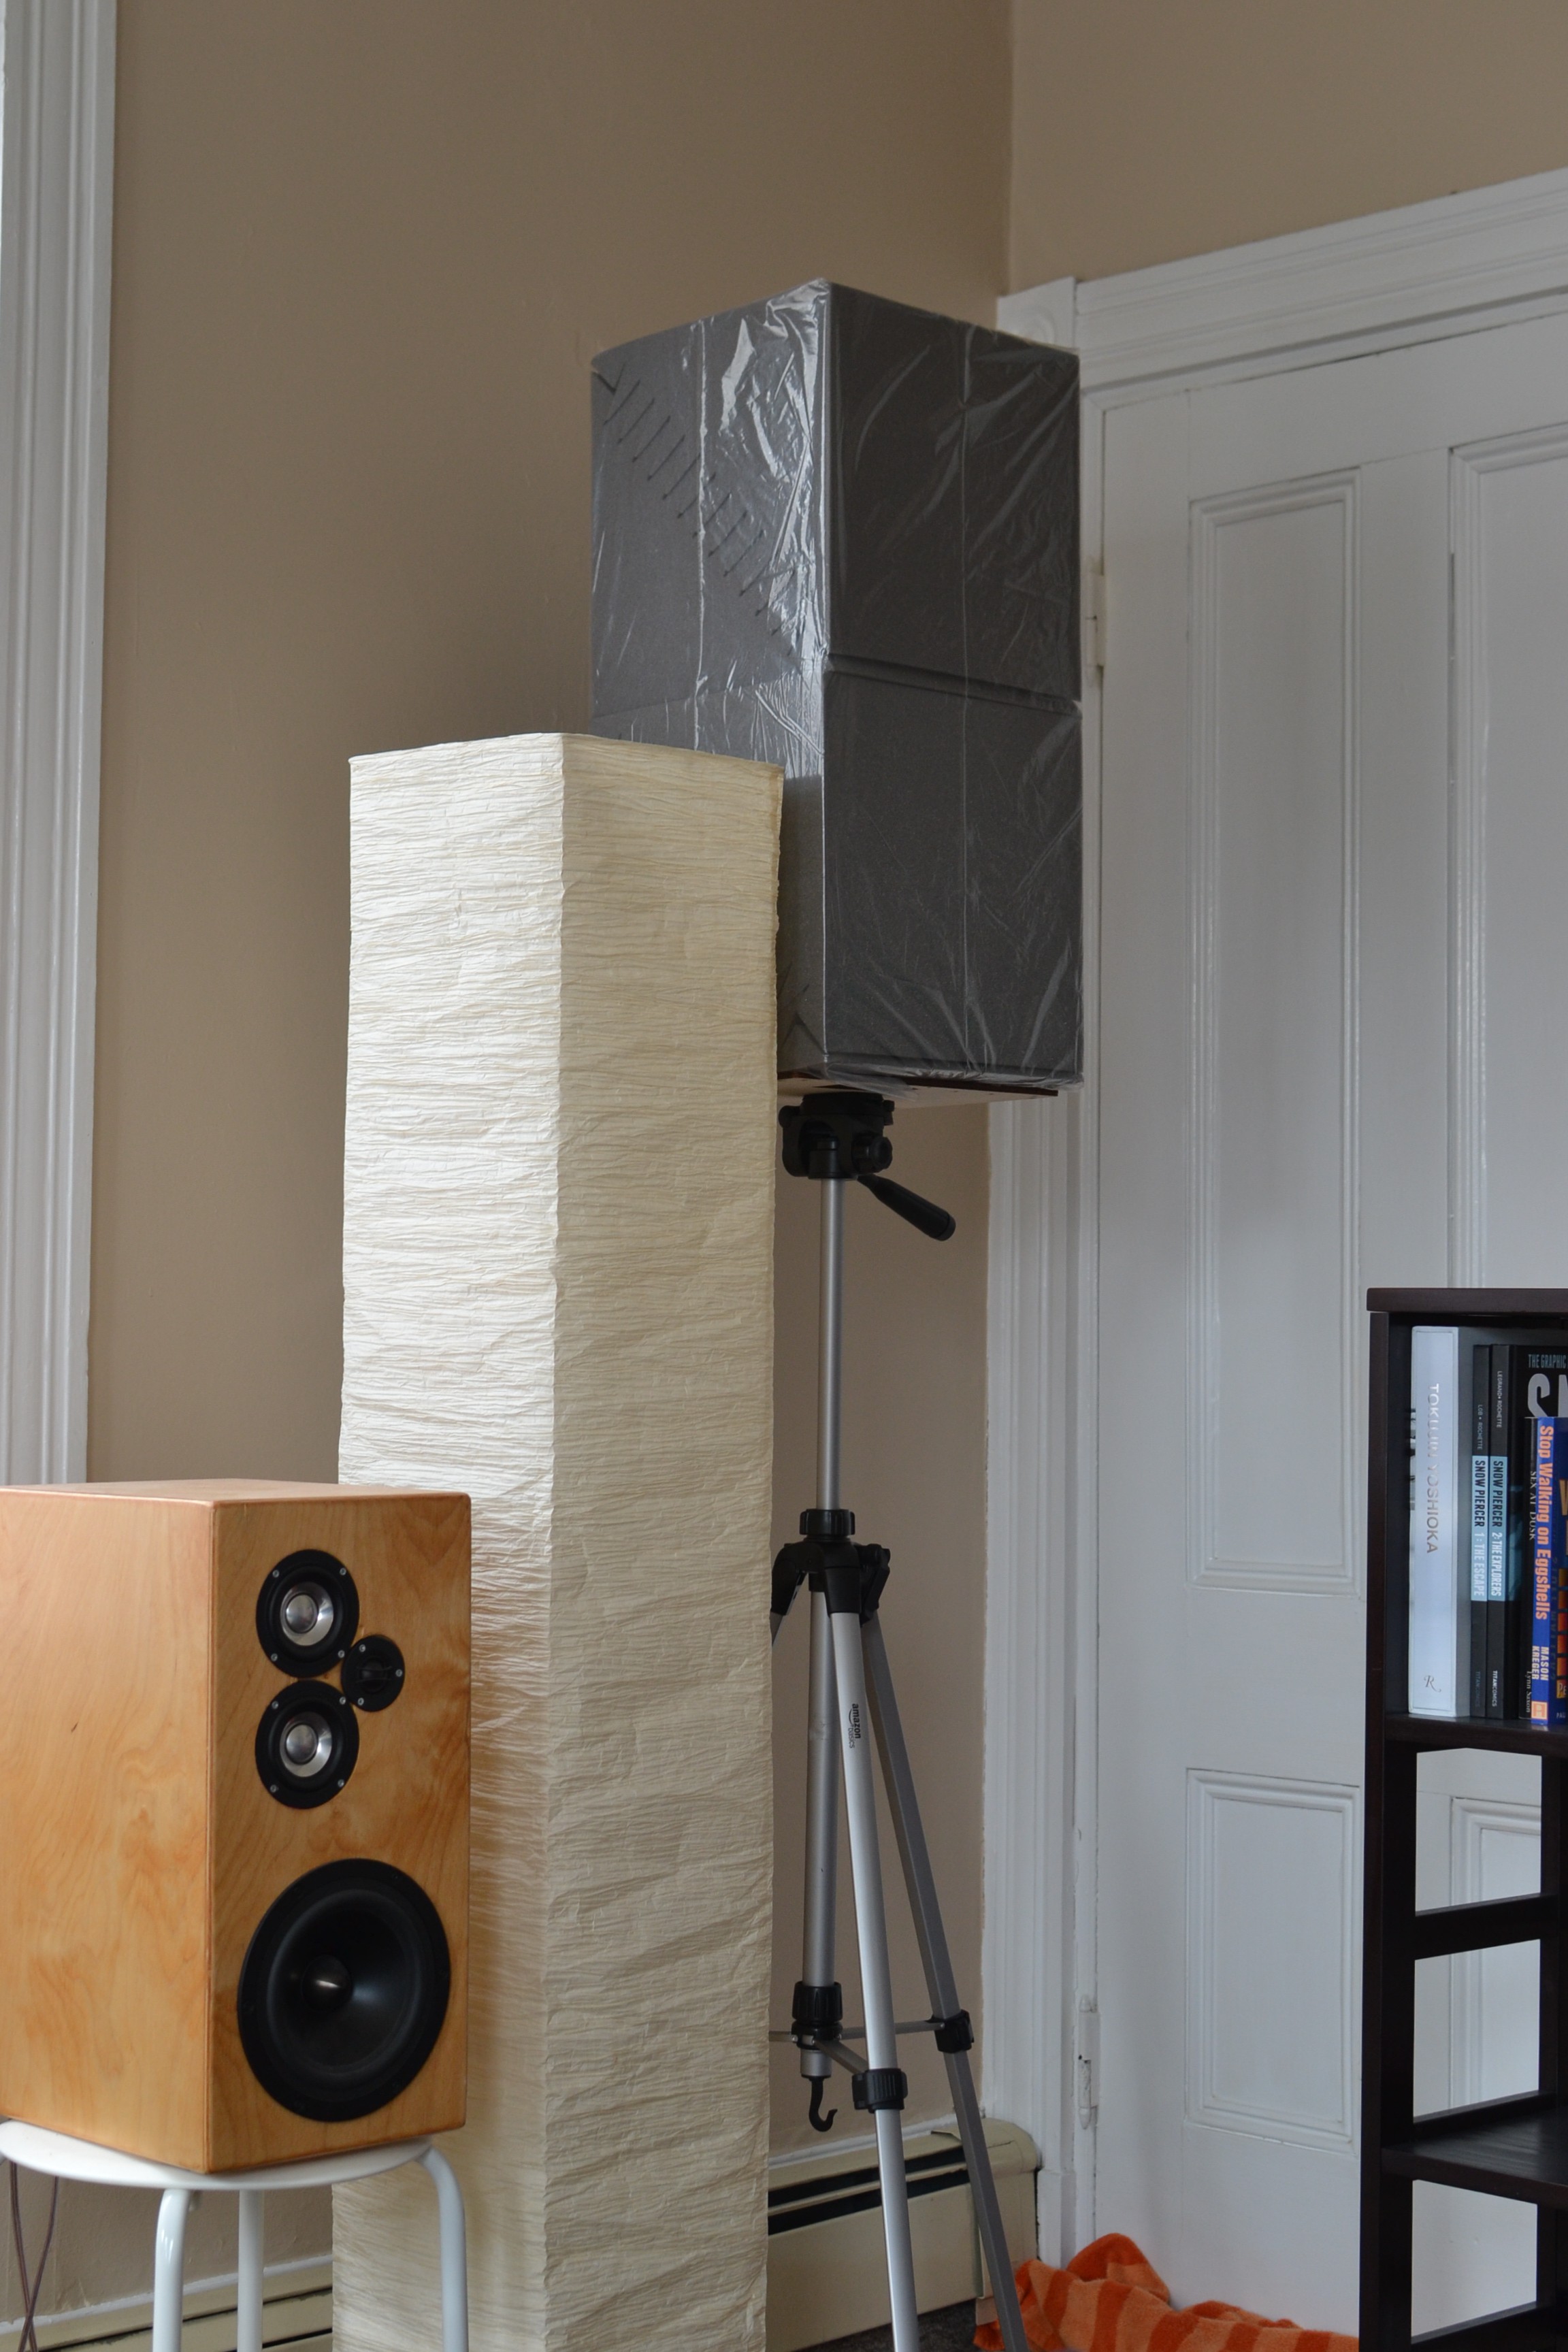
up there is our low-pressure spot, which should also be our high-velocity spot. it's about 2 feet away from each wall, which is not very surprising. i mean, the wavelength of sound at 146Hz is 7.6 feet. it's like this:
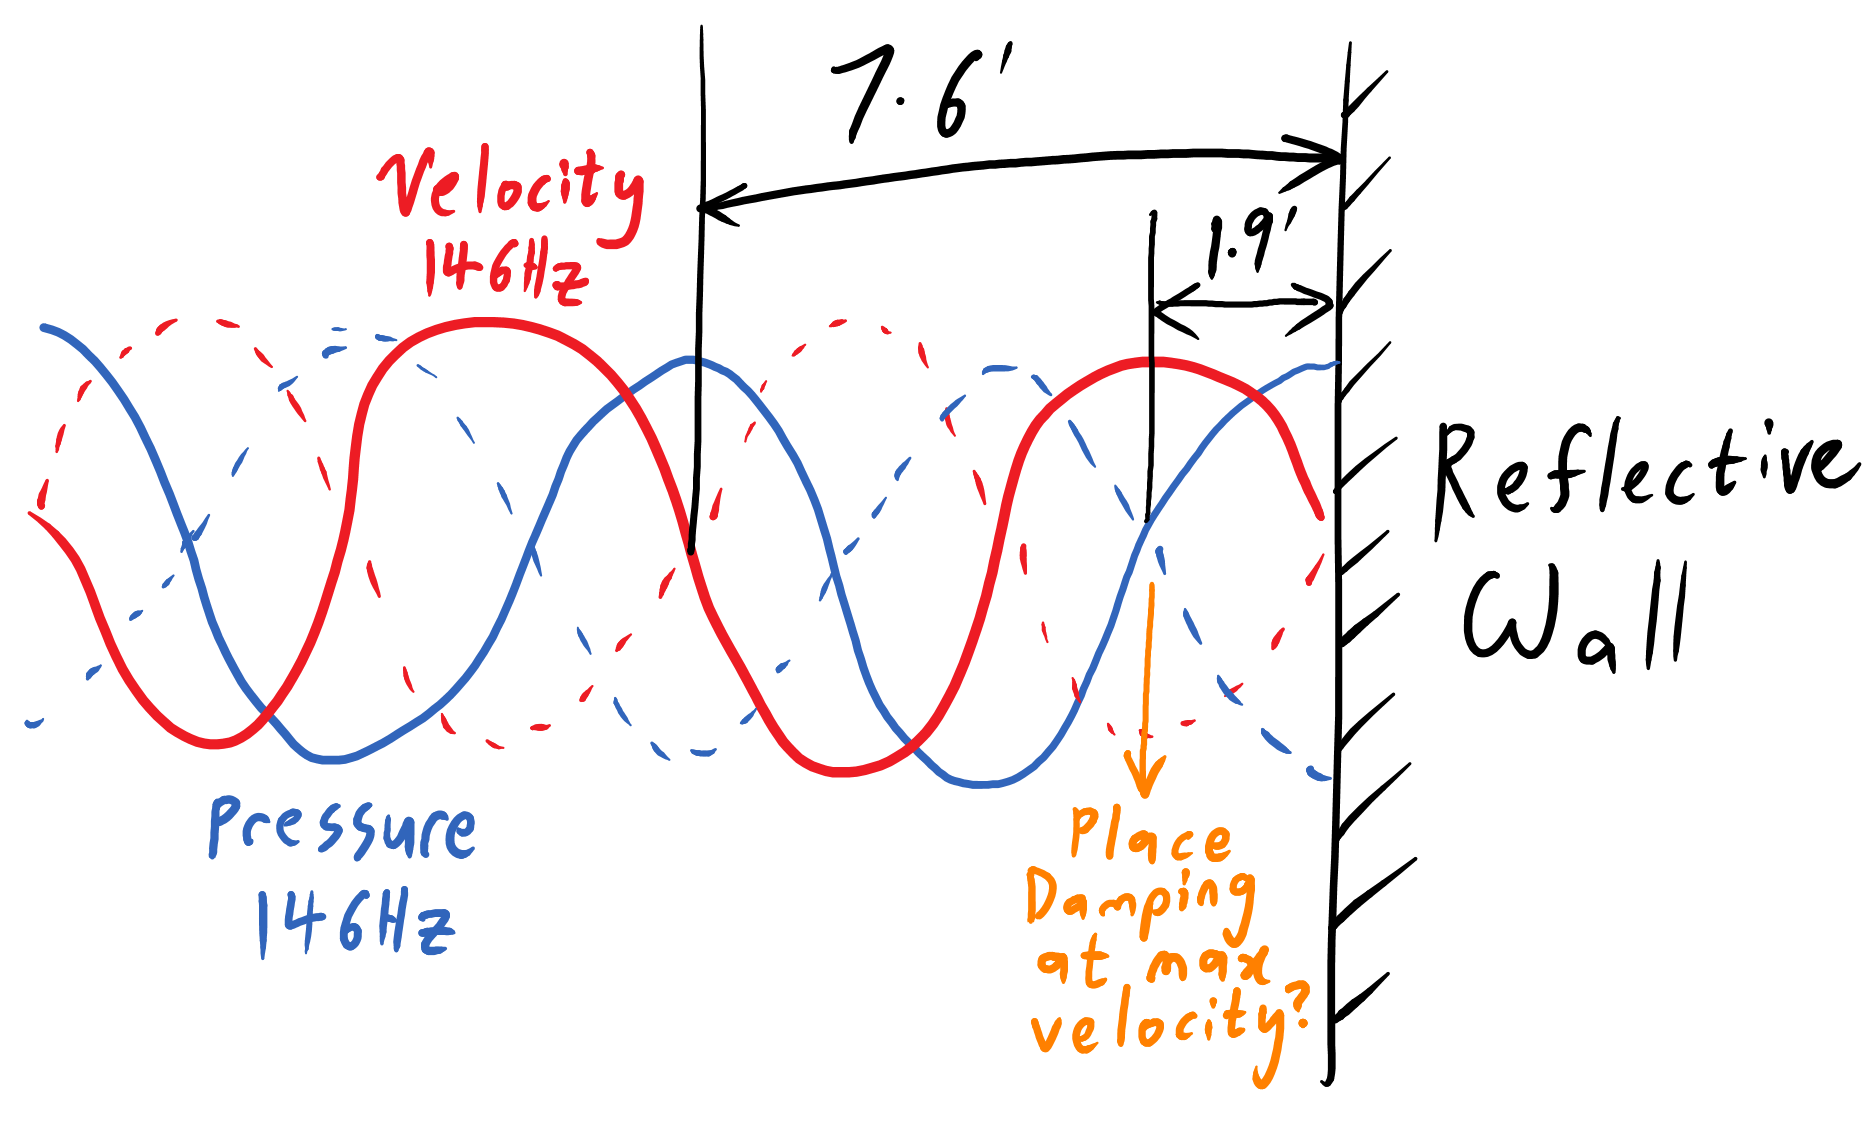
if 146Hz is reflecting off each wall, physics dictates that the lowest-pressure region is 1.9 feet from the wall. so far, everything makes sense. how can i put a foam block up there?
question 2: up there?
yes. all things are possible through my prodigious tripod collection.
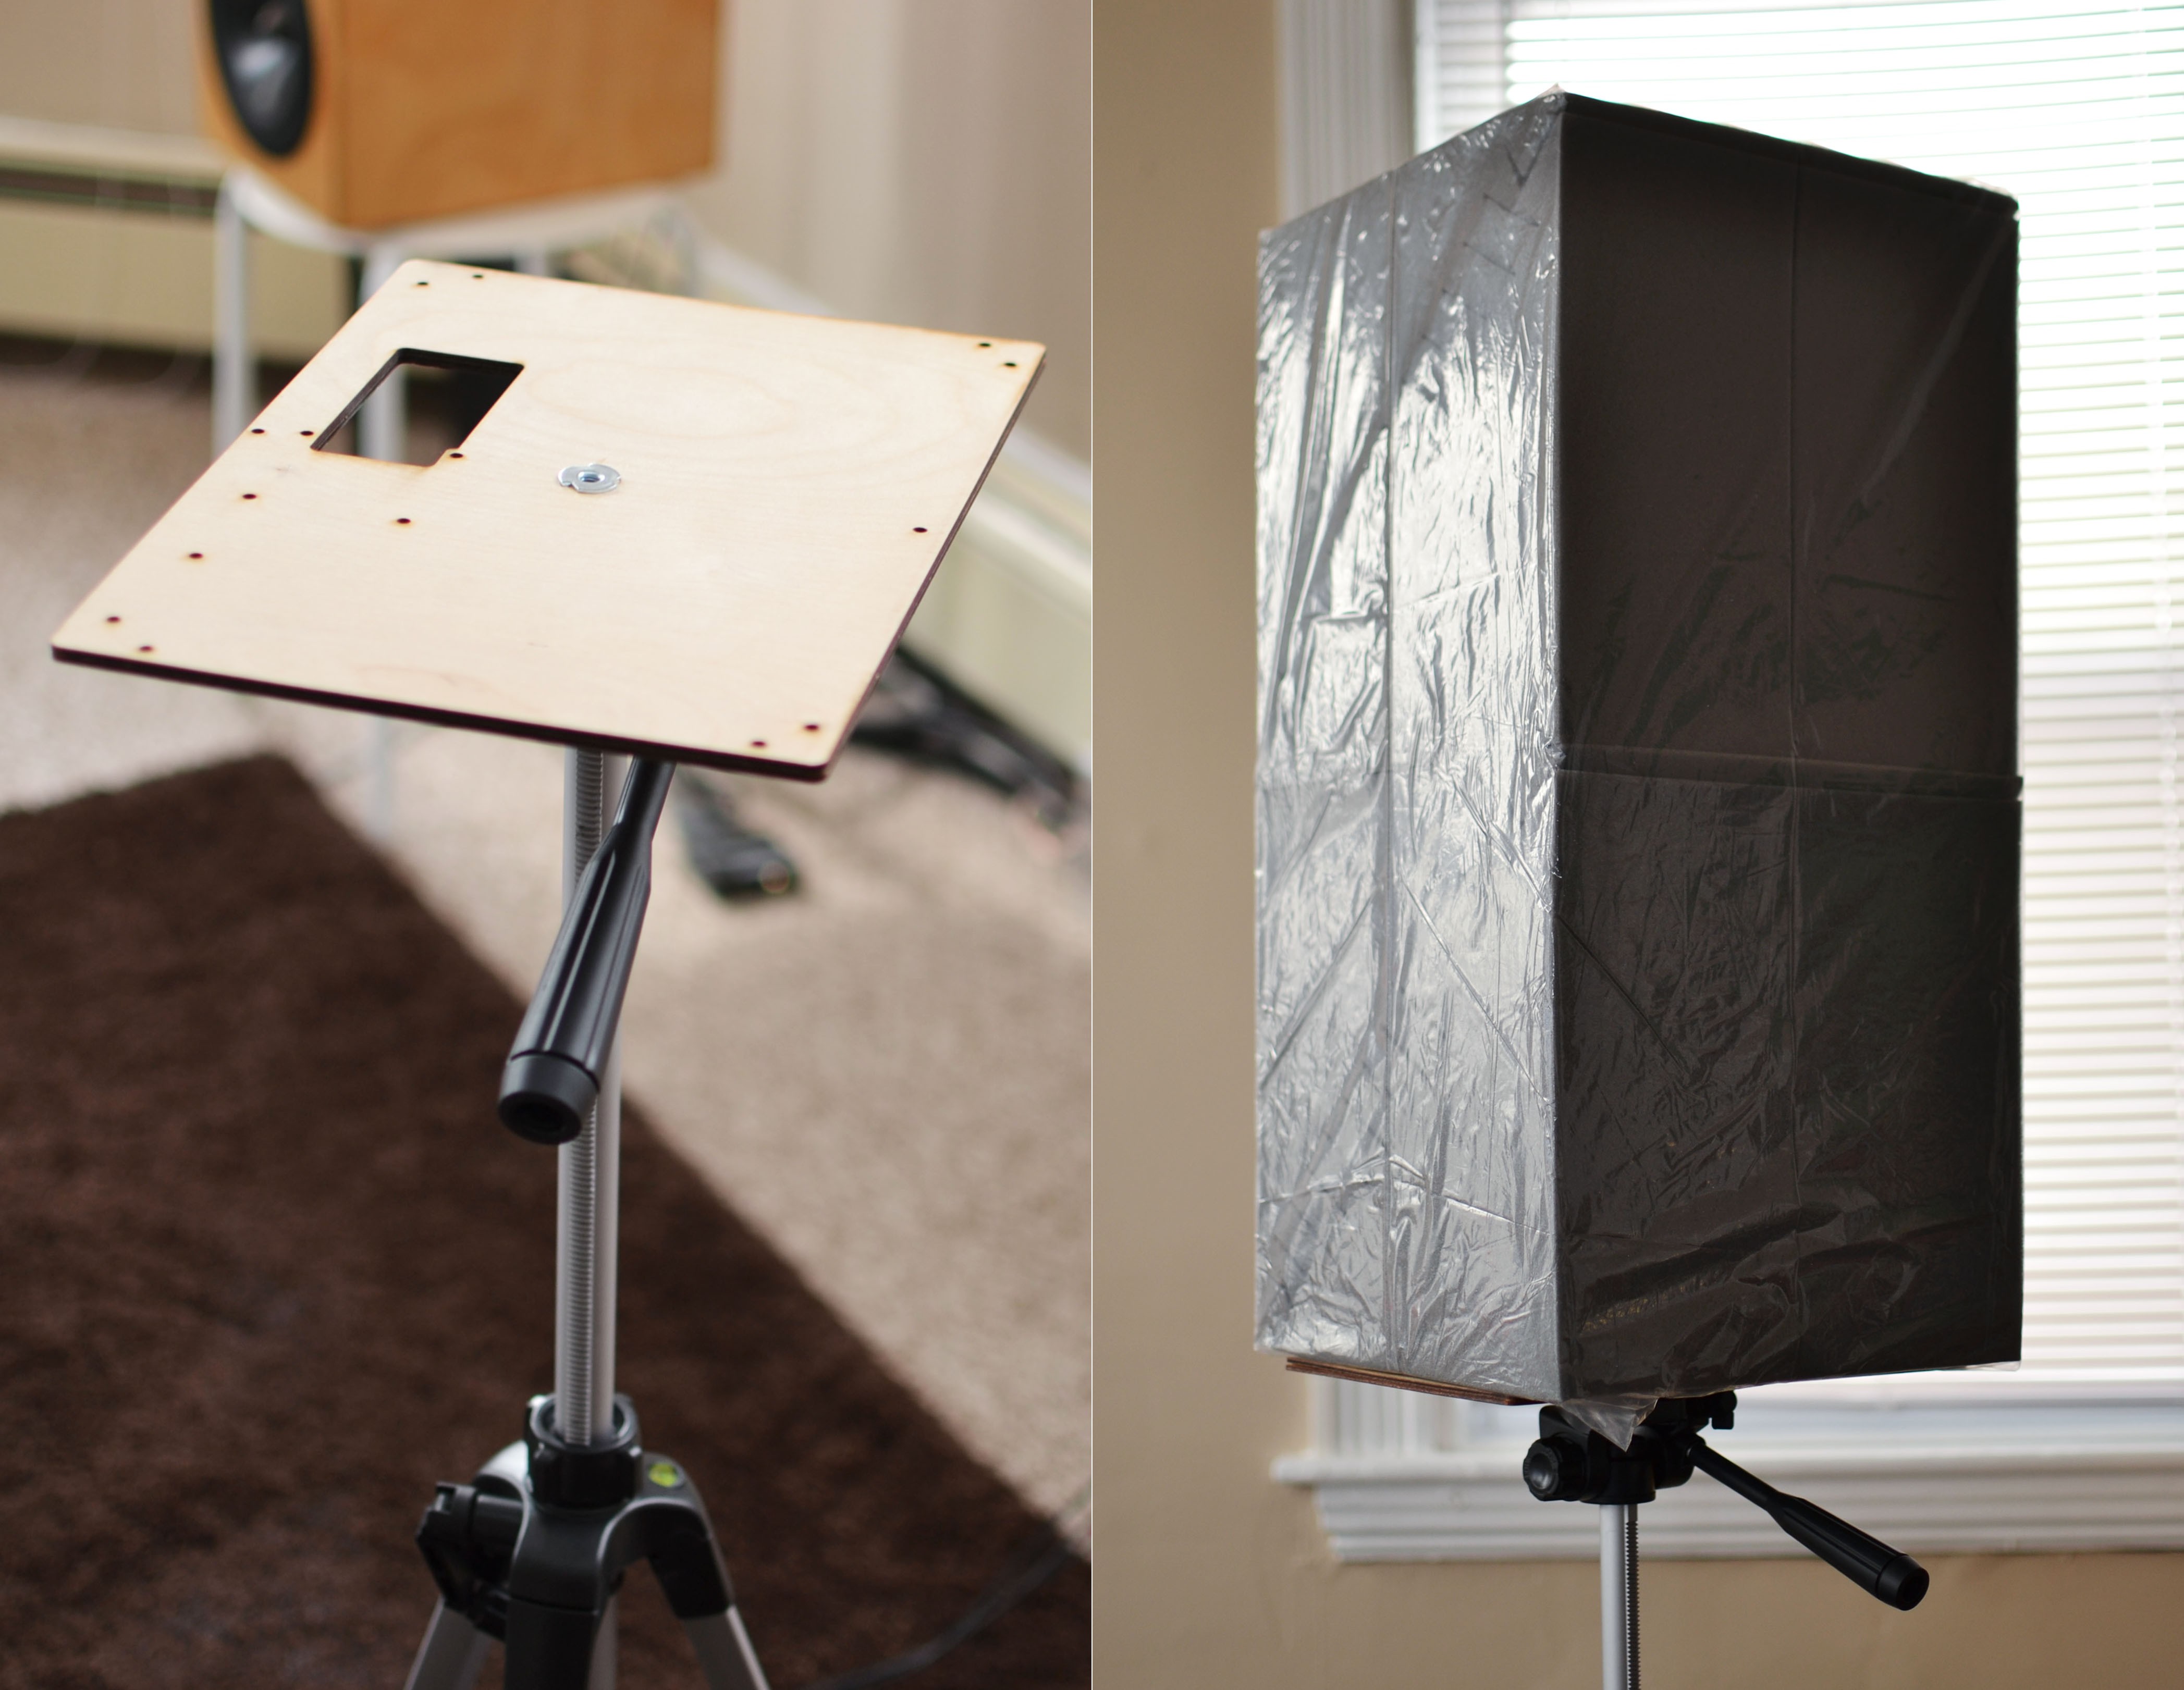 [hammer a 1/4-20 T-nut through some scrap plywood, and up it goes.]
[it almost looks cool!]
question 3: does it do anything?
my first step is to place the SPL meter at each of my four listening positions, and record the loudness of the 146Hz tone with and without the foam block.
here are the results (before and after):
- position 1: 51.6dBA to 50.5dBA
- position 2: 53.3dBA to 53.3dBA
- position 3: 50.7dBA to 50.1dBA
- position 4: 54.2dBA to 53.6dBA
that's.. not good? the difference is so small that it might as well be noise. so let's break out the real microphones, and compared averaged room measurements.
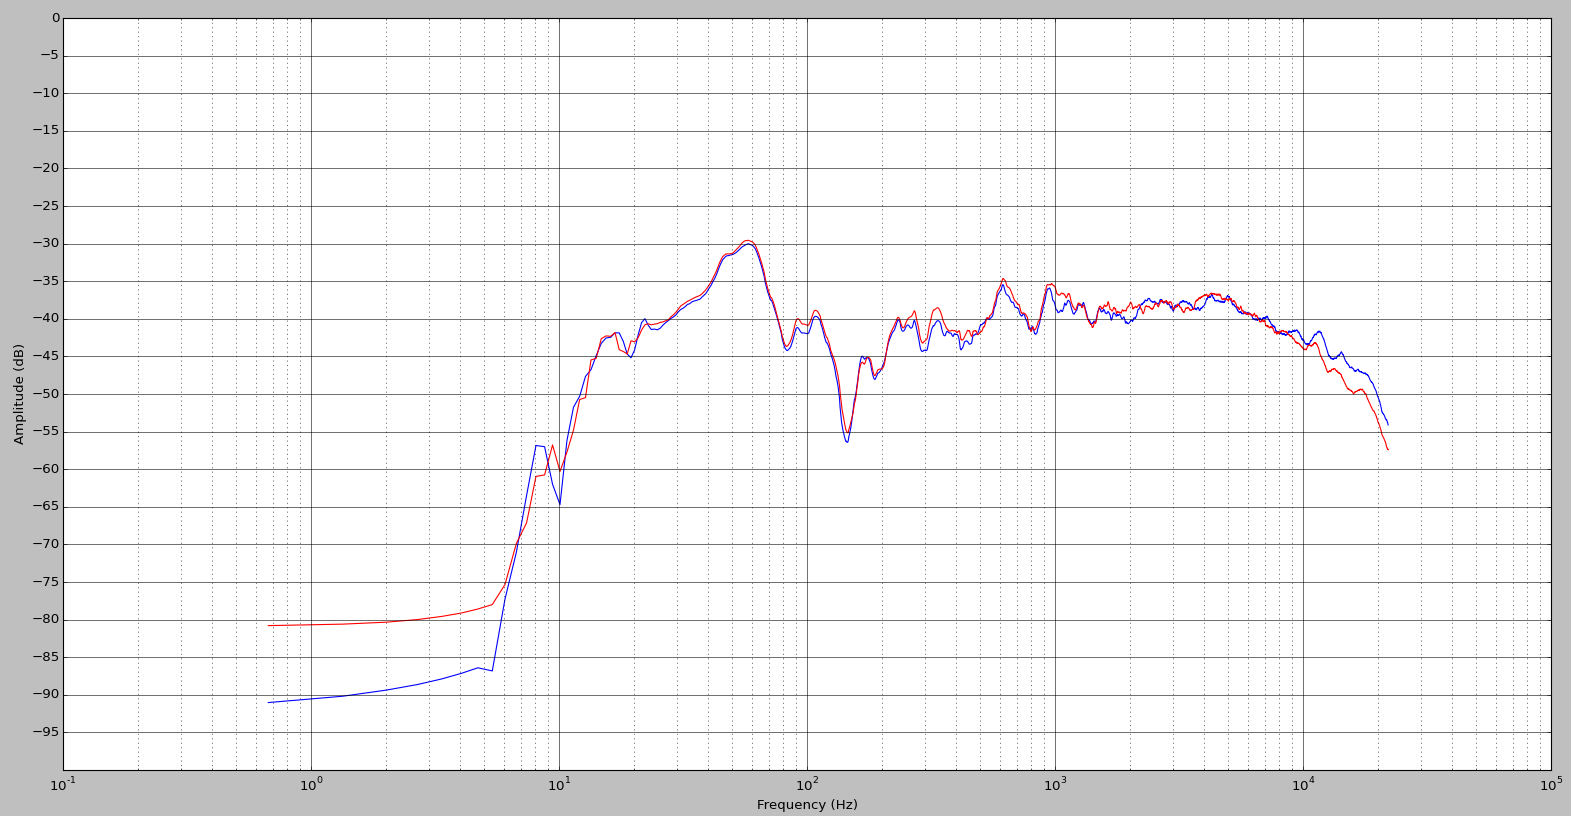
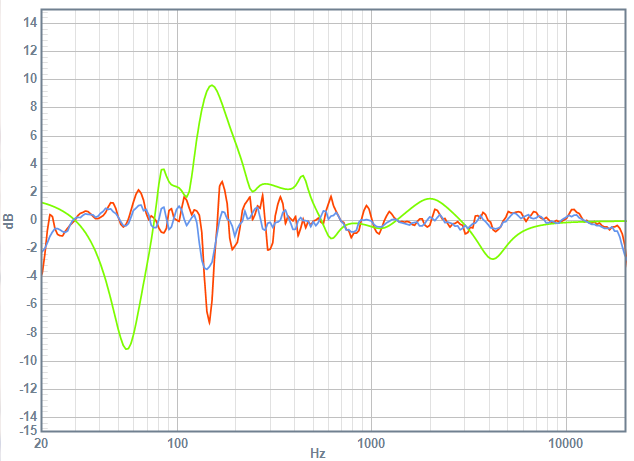
[left speaker frequency response, averaged over 4 listening positions, with 1/6-octave smoothing. without (blue) and with (red) foam block.]
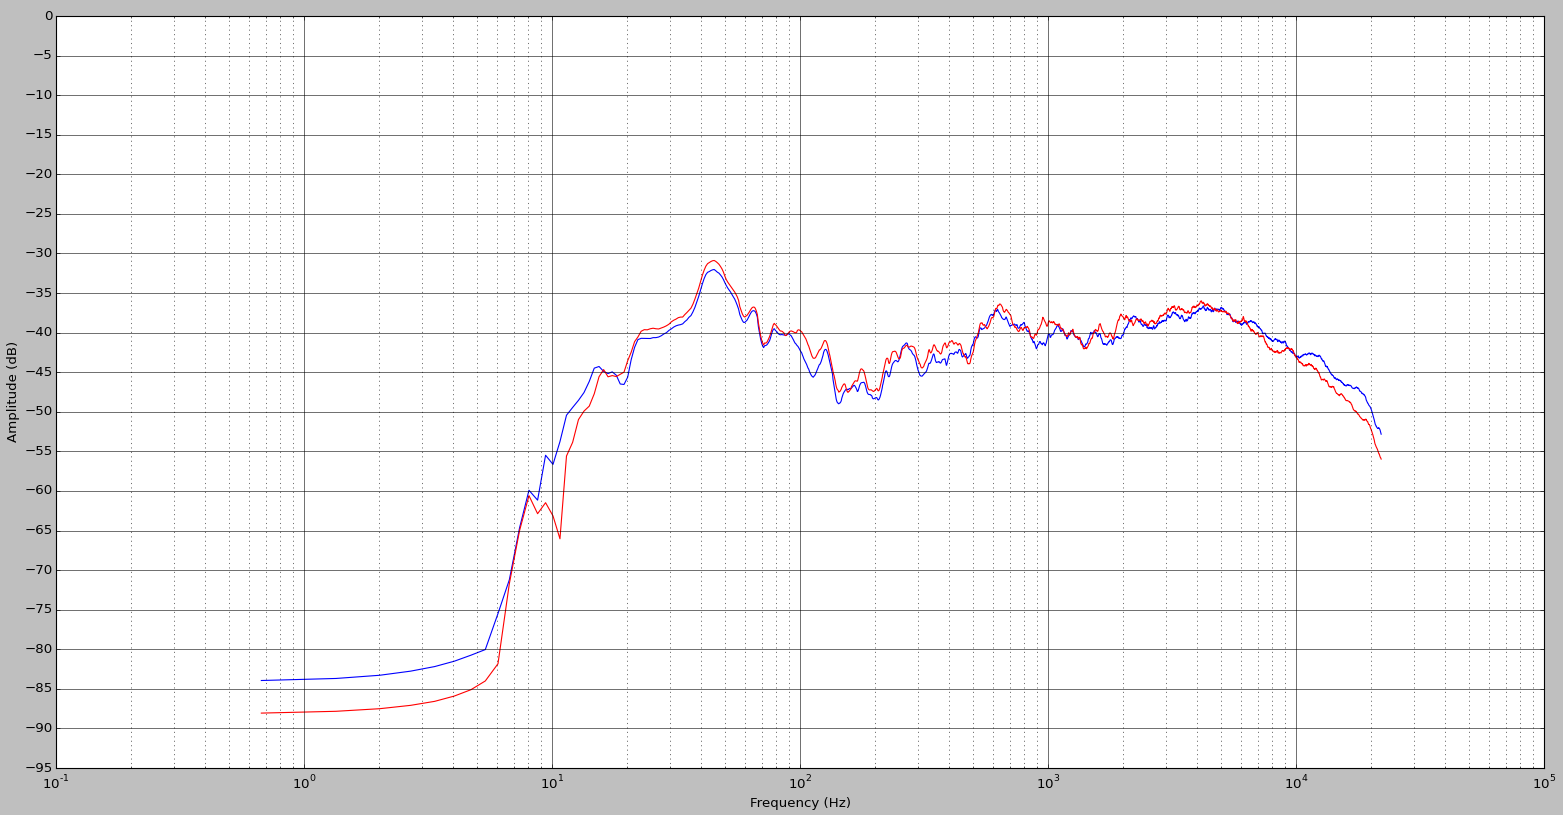
aside from slightly less treble (i left the 8.7kHz filter on) they're essentially the same curve. the foam block does nothing. so away it goes.
so much for that.
in my last update, i realized that it doesn't make sense to equalize-to-flat based on measurements taken from the listening position. the microphone records the speaker's steady-state frequency response - a bewildering mix of direct, early-reflected and reverberated sound - which only describes how we experience sound in the lowest frequencies (below a few hundred Hz). so how does one perform equalization anyways?
the literature (definitely not the only example) suggests that our perception of a speaker's performance above a few hundred Hz is controlled by the speaker's power response (frequency response at various angles, preferably measured in an anechoic chamber) and the broadband attenuation of the room's surfaces. both of these things are awfully hard to measure on a home-budget. rest assured that i'll be building the proper instrumentation eventually. but right now, what to do?
here i introduce the concept of the Blended Perception Curve (BPC). it's something i just made up. i'm beginning to realize what Bose meant when he said that there isn't a single measurement which really describes how a speaker sounds. so it makes sense to carefully combine many measurements from various sources, to end up with a single curve which attempts to describe our listening experience.
i'm not saying that the BPC is necessarily a good idea, or if what i do next is the right way to make one. it's just what i've decided to try today. so here's my procedure:
- measure the speaker close-in, at many horizontal angles, taking the average to approximate the power response.
- measure the speaker from the listening position, taking the average to approximate the room response.
- average a subset of the power response measurements (just narrow-forward angles) to approximate the direct response.
- smoothly merge the power response and room response from 300Hz to 1200Hz.
- smoothly merge step 4 with the direct response from 8kHz to 16kHz (to capture the beaming of the tweeter).
- the result of step 5 is the Blended Perception Curve.
this approach has problems. it doesn't capture the speaker's directivity over vertical angles. it assumes that a smoothed close-in measurement of the speaker is similar-enough to its anechoic response (at least it looks like the time-gated response..). it assumes the room's reflective surfaces have reasonably even absorption over frequency. it encourages equalization of baffle-step and crossover-dip, the 'correctness' of which is still in doubt.
i'll say this - this technique kind-of makes sense if you already have a good room and a speaker with well-controlled directivity. if you don't? who knows.
(if you want to play with my code and data, here are the Python scripts. extract the files and run workspace 0.py. you will need PythonXY.)
so here are the results:
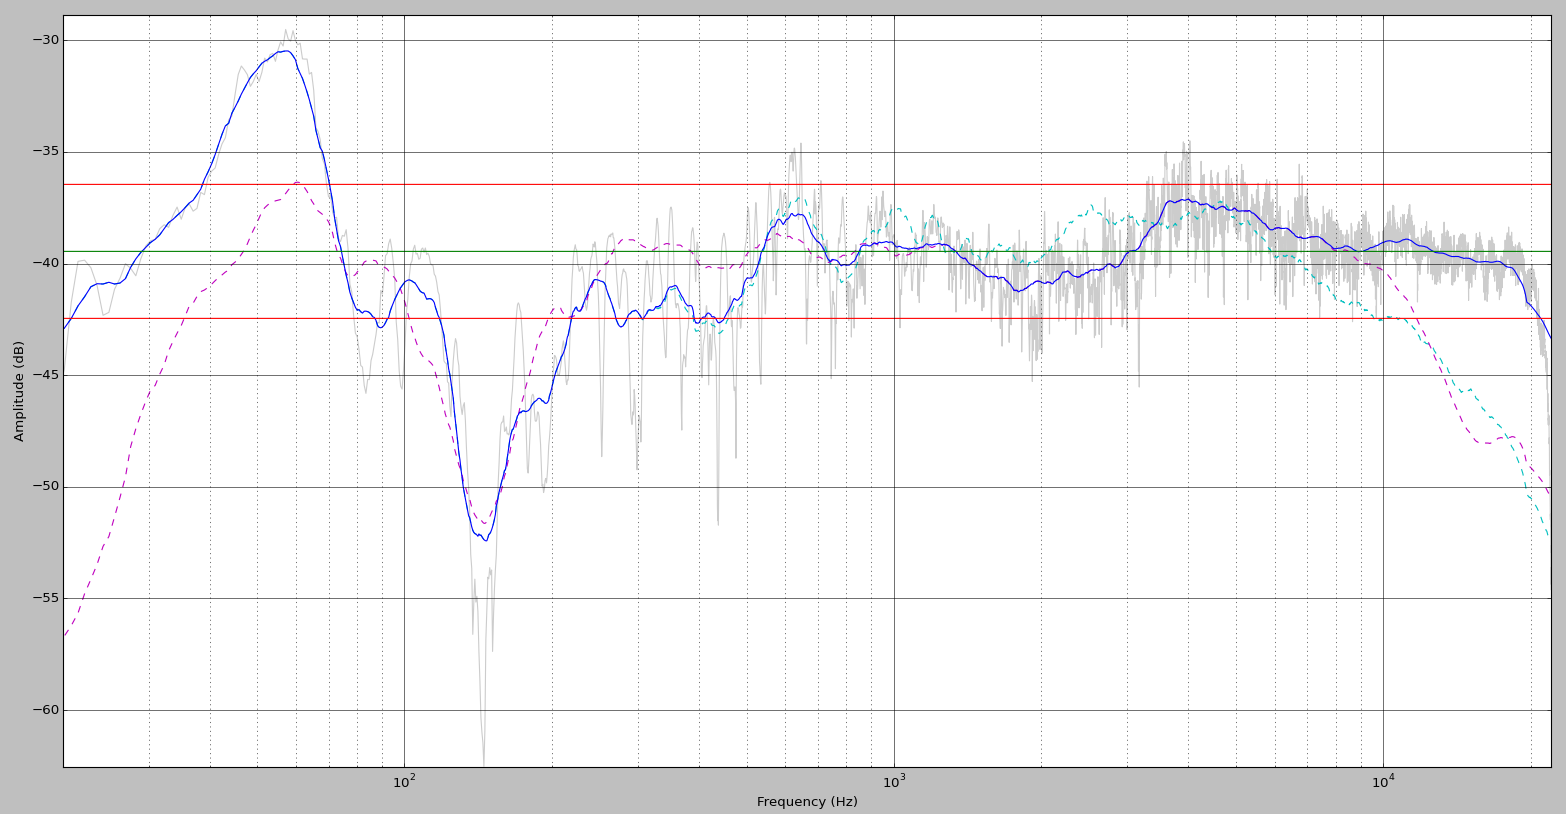
[Blended Perception Curve of left speaker, with 1/3-octave smoothing.]
these curves are quite a bit different from my previous measurements which were taken purely from the listening position. the treble is definitely less attenuated, and the midrange is smoother. it's interesting to see what happens when i run the BPC through my previous equalization settings:
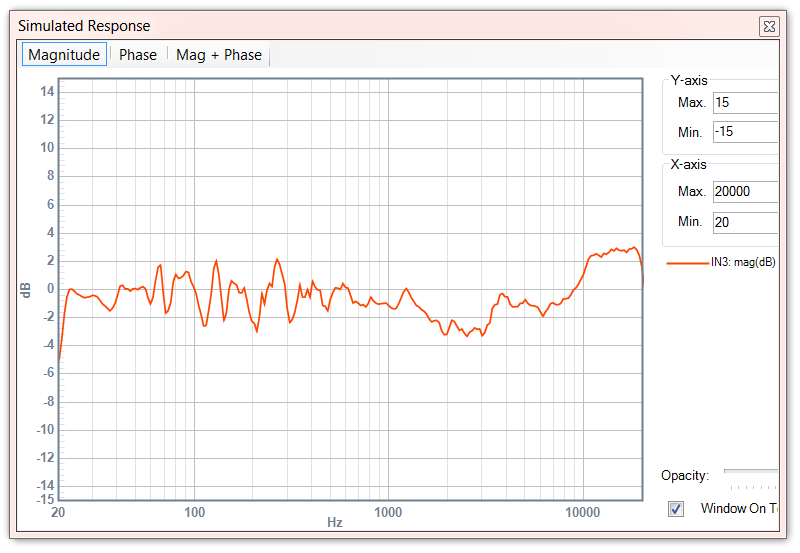
note the enormous overemphasis on the upper treble. that's probably why i needed a 8.7kHz low-pass filter..
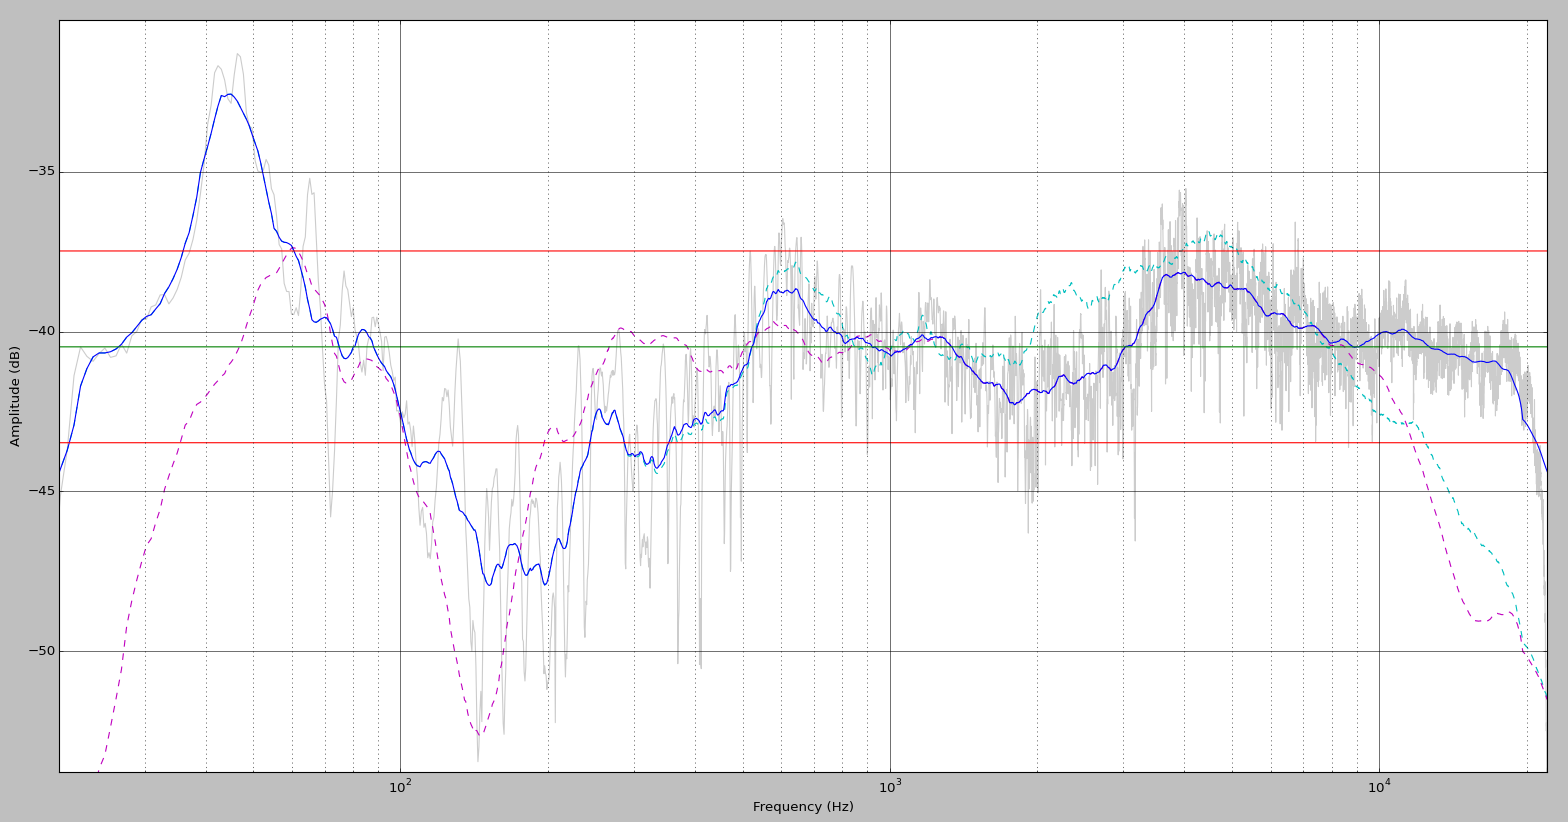
after re-equalizing everything, here's what i end up with:
[Blended Perception Curve of left speaker after equalization. with 1/3-octave smoothing (blue) and 1/6-octave smoothing (blue). equalization curve in green.]
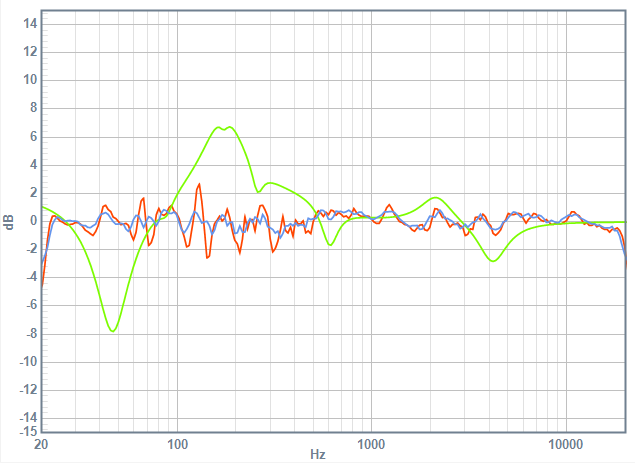
note that the equalization curve (green line) on both left and right speaker no longer has the enormous boost in the upper treble. both equalization curves also show more gain at 2kHz, which offsets the off-axis attenuation caused by the dip in the tweeter-midrange crossover. some of you may say, how dare i equalize that! it'll fix my power response, at the expense of my direct response!
you are correct. i don't know if this is the right way to do anything. the problem is fundamentally the speaker's directivity. i daresay my next audio project will have to involve building some kind of new speaker - probably a broadband-monopole or a cardioid/dipole.
update: after extensive listening tests, i have removed all equalization above 1kHz. that means no more bump at 2kHz, and no more dip at 4kHz. back when i first designed these speakers, i made sure they had a flat on-axis response. i've realized that at higher frequencies, no matter how screwed-up your power response, you still need a flat on-axis response at all costs. well-controlled directivity (to maintain the flat frequency response off-axis) is a highly-desirable bonus which you cannot achieve through EQ alone. these findings beg a new speaker design..
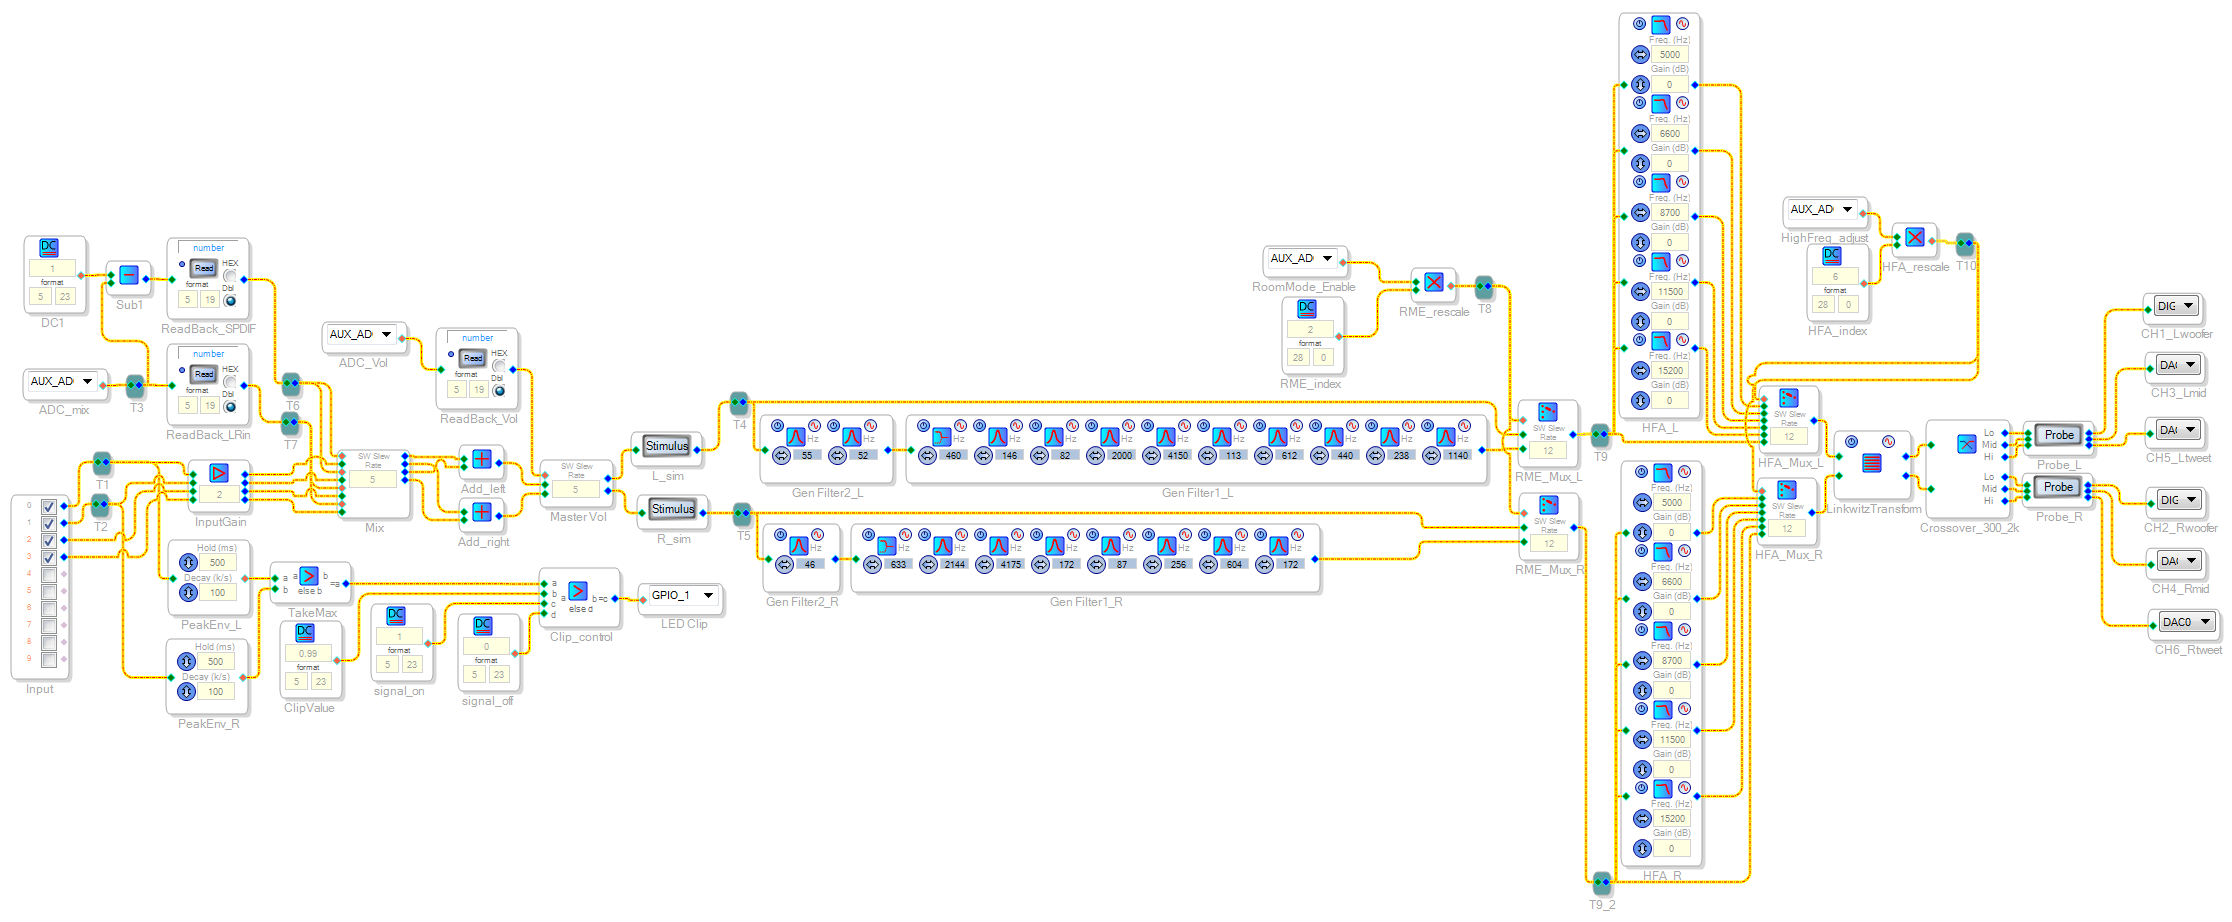
and one more vanity shot of the enormous signal chain:
where do i go from here?
i intend to build a much smaller, more carefully laid-out version of the DSP 01 main board, which can then be installed directly into speakers to get rid of the DSP/amplifier box on the floor. i intend to do a lot of things.
maybe i'll put up one more post where i gush about how good it sounds, just to make these rants more like all the other audiophile rants. one way or another, i think i can say that DSP 01 - Phase 2 is complete.
thanks for reading!
Tshen2 2015
Discussions
Become a Hackaday.io Member
Create an account to leave a comment. Already have an account? Log In.
Did you test the foam block with the plastic wrap still on it? I would not expect that to work well.
Are you sure? yes | no
Hmm seems like you tried that out that Eq I suggested on your own and decided against it =D
It's been a pleasure following along on your adventure. Thanks for taking all the time to share!
-Matt Long
________ San Francisco, CA
Are you sure? yes | no