 Bruce Land
Techniques Review
We are going to consider only time series analysis in this section. There are reviews of "complexity measures" (Feldman and Crutchfield 1998, Daw, et.al. 2002). Kuusela, et.al. (2002) compare the results of ten different complexity measures on heart rate and blood pressure time series.
- Information theory estimates of complexity
In general the entropy of a discrete probability distribution is given by
H = sumi(-pi*log(pi))
whereiindicates one of the discrete states andsumimeans to sum over all the discrete states. The entropy is larger if each discrete state has about the same probability of occurence. If you use a base-2 log, then the entropy represents the number of bits of information which can sent by a signal consisting of one state. As an example, if you have 4 possible states of a signal, all with equal probability, then the entropy isH = -4*(1/4*log2(1/4)) = -4*(1/4*(-2)) = 2bits. So sending one of the states (perhaps the one of letters A-D) would transmit 2 bits of information. Sleigh et.al. compare five measures of entropy used to classify EEG.- Approximate Entropy
Pincus (1991) introduced Approximate Entropy as a complexity measure. Given groups of N points in a series, the approximate entropy is related to the probabilty that two sequences which are similar for N points remain similar at the next point. He used this technique to characterize three chaotic systems.
- EEG
Rezek and Roberts (1998) compare Fourier entropy (see below) and approximate entropy and conclude that they both can distunguish anesthesia depth (as judged by agent concentration). Deeper anesthesia means lower complexity. Approximate entropy may have been slightly more sensitive to changes than Fourier entropy. Bhattacharya (2000) used approximate entropy to characterize the EEG of pathological groups compared with healthy groups. The degree of linear complexity is significantly reduced for the in the seizure group for most of the electrodes, whereas a distinct discrimination between the maniac and healthy
groups based on these nonlinear measures was not evident. - Respiration
Burioka et.al. (2003) used approximate entropy to measure the complexity of EEG and respiratory motion diring different stages of sleep. They found that the entropy of the two signals was related and both decreased during deep sleep.
- EEG
- Sample entropy
A modification of the Approximate Entropy introduced by Richman and Moorman (2000). They claim that approximate entropy as defined by Pincus is biased by including self-matchs. They also simplify the calculation somewhat. There is a matlab function available to compute the sample entropy. Authors are DK Lake (dlake@virginia.edu), JR Moorman and Cao Hanqing.- Neonatal heart
Lake et.al. (2002) use sample entropy to predict neonatal sepsis from heart rate data. They suggest ways to evaluate the optimal setting for the parameters (length of sequence, error tolerance) used in sample entropy. They found that sepsis could be predicted by the sample entropy, but that much of the difference was related to spike-like outliers in the data.
- Neonatal heart
- Fourier entropy
To compute the Fourier entropy, a power-spectral-density of a time series (or portion thereof) is computed. The PSD is normalized to produce a probability-like distribution, and the entropy calculated as shown above. Fourier entropy seems to be the baseline against which other methods are shown to be better, but quite often is the easiest compute if the data sets are large. - Wavelet entropy
Rosso et.al. (2003) use wavelet transforms (as well as other measures) to characterize seizure states from EEG recordings. Jones et.al. (2002) used a 2D wavelet transform of 2D recordings of head surface potentials. The complexity measure was related to the number of wavelet components needed to fit the signal. - Renyi Entropy (Gonzalez, et.al. 2000)
This scheme computes the time-frequency spectrogram of a signal, then counts the connected regions above some threshold energy. The idea here is that one peak in time-frequency space is an elementary event, so counting peaks gives an estimate of complexity. There are tools for time-frequency analysis available from François Auger, Patrick Flandrin, Olivier Lemoine, and Paulo Gonçalvès. - Higher Order methods. (Gu, et.al. 2004)
Break the time series into parts, compute the entropy of each part using your favorite method, then treat the entropy values as a time series and compute the entropy of that sequence. Gu, et.al. used this to study EEG and a couple of chaotic systems using Approximate Entropy (see above) as the entropy measure. They have a good discussion about periodicity, randomness and complexity. - Multiscale/Multiresolution methods
Any of the above entropy measures can be adapted to consider different time-scales of of the time series. To me, using a multiscale approach is essential to avoid artifacts of oversampling and noise and because different structures may emerge from a time series when observed at different time scales. The most basic way is to analyse the signal at different bandwidths, or equivalently by averaging together groups of points. Torres and Gamero (2000) using sliding windows of varying width to estimate a sort of "instantaneous complexity". Costa et.al. (2002) downsample the time-series using a rectangular window which they move along the series in jumps equal to the window width. They calibrate the method with 1/f noise and white noise. They found that multiscale methods could distinguish healthly, congestive heart failure, and atrial fibrillation subjects. There is also a tutorial and software online. Costa et.al. (2003) have also used multiscale methods to study normal human gait and used shuffled data as a control. Costa et.al. (2005) explain multiscale techniques well and apply them to heart rate and DNA sequences.
- Approximate Entropy
- Chaos-based estimates of complexity
- Lyapunov exponent
Efstathiou, et.al. compare entropy-based complexity measures with Lyapunov exponent estimates. They conjecture that the Lyapunov exponent measures the rate at which the system generates new information. - permutation entropy
Bandt and Pompe (2002) introduced a complexity measure which has aspects of both dyna mical systems and entropy measures. They propose to estimate complexity as the entropy of the distribution of permutations of groups of time samples. Take each member of the group and give it a sequence number (in the series) from 1 to n. Reorder the n members of each group into assending order and note the new order of the sequence numbers for each group. The new order serves as a bin number into which the total count of all groups with a given sequence is accumulated. The result is a histogram of number occurances of each sequence order. Normalize this to a probability distribution and compute the entropy. The authors used the method on model systems such as the logistic equation.
- Lyapunov exponent
- Komologrov estimates (algorithmic complexity)
- Lempel-Ziv (Ziv and Lempel 1978, Evans, et.al. 2002)
The time series is first reduced to a symbol list. Some authors set any voltage (or other measurement) above the mean to one and below the mean to zero. The string of symbols (often a pattern of 1/0s) is then scanned for repeated sequences of all lengths. Amazingly, this can be done in a single pass and is quite efficient. The measure of complexity is then related to the length of the original sequence and the (generally shorter) length of the description when repeated sequences are correctly noted and enumerated. This sceme is also the basis for compression of TIFF images and ZIP files, where it is refered to as LZW compression (Lempel-Ziv-Welch). Khalatur et.al. (2003) have actually used the UNIX utility GZIP compression ratio as a measure of complexity. See also Potapov, et.al. for web accessable tools. An optimized variant of compression-based complexity measure is described by Evans and Bush, 2002. Radhakrishnan et.al. (2000) propose an improved partitioning method of a continuous signal into symbols for LZ processing.The methoditeratively finds optimum amplitude clusters in the original signal. Rapp, et.al. (2001) show how to normalize LZ complexity measures to account for varying sample lengths and sampling frequencies.- Spike trains
Szczepanski, et.al.(2003) used LZ complexity to classify spike trains from ferret visual cortex. They used two methods to encode the train into symbols (e.g. binning or interspike interval) and showed that different codings produced different estimated complexities. Also, in vivo preps yielded higher complexities (carried more Shannon information) than in vitro preps.The same group (Amigo, et.al. 2004) uses the LZ complexity to estimate the entropy of spike trains. They found better convergence rates for estimates on short data sequences. - DNA
Many DNA studies are reviewed in Potapov et.al. and Orlov et.al. Complexity meaures may be able to distinguish coding from noncoding regions. They may be able to distinguish mutational mechanisms. They can distunguish repetitive regions. Allison et.al. (1998) suggest a scheme for using approximate string repeats, rather than exact matches and apply it DNA sequences. They also have sone online tools for DNA analysis. - EEG
Watanabe, et.al. (2003) showed that LZ complexity was sensitive to the state (eyes open/closed) of subjects. The EEG signals were converted to symbol sets by binary threshold at the median voltage. - Depth of Anaesthesia
Hunag et.al. (2003) used LZ complexity as an indicator of changes in the brain during anathesia. The complexity values were used as inputs to a neural net classifier.
- Spike trains
- Hidden Markov
Shalizi, Et.al. (2001 and 2002) are not actually concerned with complexity measures (In fact they dismiss them, Shalizi 2003,), but rather with estimating the minimal set of Markov states which can statistically reproduce the behavior of a data set. Other people (e.g. Gunther 1994) have related markov desciptions to complexity measures. - State machine
- Bird song (Sasahara and Ikegami 2004)
The birds are modeled as finite state-machines which are allowed to evolve. Complexity is measured as the ratio of total number of states to the total number of arrows connecting states. This is sort of an average index of branching in the song. Note that this paper was a modeling paper, with no attempt to fit state-machines to real songs.
- Bird song (Sasahara and Ikegami 2004)
- Lempel-Ziv (Ziv and Lempel 1978, Evans, et.al. 2002)
Our Attempts
We are interested in comparing communications signals between species, modalities, genera, etc. We tried a few different schemes to see if we could come up with a useful measure.
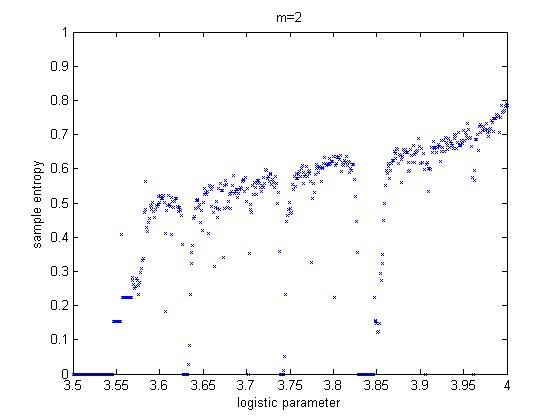
We found Matlab code to compute sample entropy. Test cases for sines, noise and a simple chaotic system (logistic equation) were written. The figure below shows output for the logistic equation over a range of growth values, for sample length m=2.
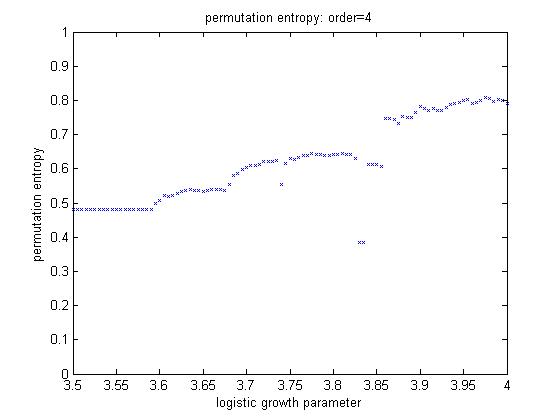
We also wrote code to compute permutation entropy. The test case used was, again, the logistic equation. The program plots the computed entropy versus the logistic growth rate, which is periodic for some regions and chaotic for others. The figure below shows output for 4th order. You can clearly see some regions of stability around 3.83.
Neither sample entropy or permutation entropy worked very well for the long data sets we are interested in analyzing, but we had not read about (nor yet figured out ourselves) the multiscale approachs mentioned above. We need to redo the sequences with multiscale techniques (for example, Costa et.al. 2003).
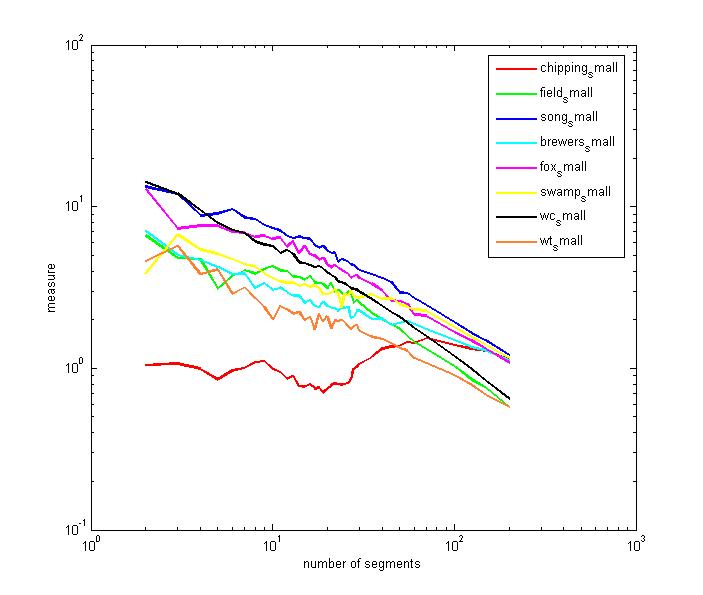
We developed a simple technique which is multiscale and which has given interesting results, but which suffers from all of the defects noted in various reviews of complexity measures: The technique is without relation to any other measure, it is not supported by theory, and has few physically interpretable parameters. A description of the algorithm follows. A signal is divided into N non-overlapping segments. For each segment, the Fourier entropy is calculated, then the mean and standard deviation of all N entropies are computed. The measure of entropy (at the time scale N) is the product of the mean and standard deviation. The measure is recomputed for a large range of Ns, to account for structuring on different scales. The measure tends to zero for sine waves and white noise. It indicates a higher "complexity" for many sorts of non-stationary signals. For example AM or FM modulation appears as higher complexity compared to noise or sine waves. A bird song example is shown below. Eight species of sparrow were characterized. Single repeats of the entire song were isolated (by Damian) and analysed. The spectrograms are here. The "complexity" ordering from the plot roughly matches the ordering of the spectrograms (as done by Damian, no double blind). The ordering was (from most complex to least) song, fox, swamp, field, white crown, brewers, white throat,chipping.
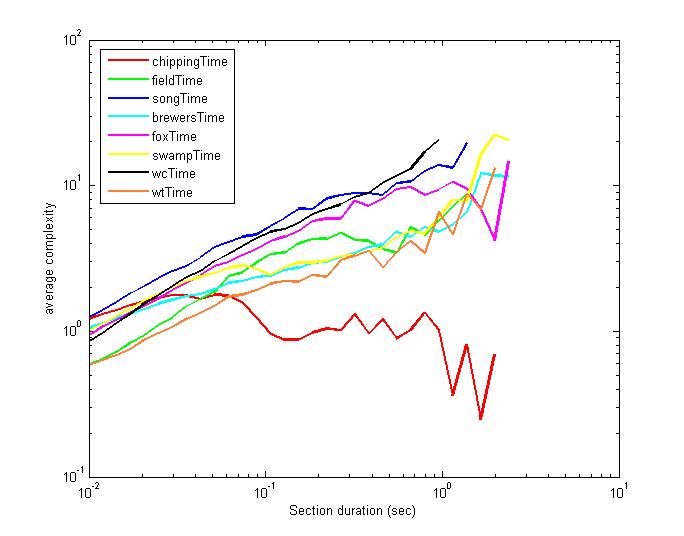
We redid the analysis using fixed length segments instead of N/song, as was done above. The ordering of the songs changes somewhat.
The next two things to try are the second order entropy techniques and the Renyi entropy.
References
- Adami, CI, Sequence Complexity in Darwinian Evolution, Complexity (2003) (pdf)
- Allison L, T. Edgoose, T. I. Dix, Compression of Strings with Approximate Repeats, Intelligent Systems in Molecular Biology (ISMB98) pp8-16, Montreal, 28 June - 1 July 1998
- Amigó J. M., Szczepaski J., Wajnryb E., Sanchez-V. MV, Estimating The Entropy Rate Of Spike Trains Via Lempel-Ziv Complexity, Neural Computation vol 16 717-736, . 2004
- Bandt C, Pompe B., Permutation entropy: a natural complexity measure for time series., Phys Rev Lett. 2002 Apr 29;88(17):174102.
- Bhattacharya, J, Complexity analysis of spontaneous EEG, Acta Neurobiol. Exp. 2000, 60: 495-501
- Burioka, N MD; Germaine Cornélissen, PhD; Franz Halberg, MD; Daniel T. Kaplan, PhD; Hisashi Suyama, MD; Takanori Sako, MD and Eiji Shimizu, MD, Approximate Entropy of Human Respiratory Movement During Eye-Closed Waking and Different Sleep Stages, Chest. 2003;123:80-86
- Bush SF, Todd Hughes, Ph. D. The Effectiveness of Estimates of Kolmogorov Complexity to Identify Semantic Types, http://www.atl.external.lmco.com/overview/papers/1172.pdf 2003
- Costa M., Goldberger AL, Peng CK Multiscale entropy analysis of physiologic time series. Phys Rev Lett 2002; 89:062102
- Costa M, Peng C-K, Goldberger AL, Hausdorff JM. Multiscale entropy analysis of human gait dynamics. Physica A 2003;330:53-60.
- Costa M, Ary L. Goldberger, and C.-K. Peng, Multiscale entropy analysis of biological signals. PHYSICAL REVIEW E 71, 021906 s2005d
- Crutchfield JP, D. P. Feldman and C. R. Shalizi. Comment I on ``Simple Measure for Complexity'' Physical Review E 62(2), 2996-7 (2000).
- Daw, CS, CEA Finney and Tracy ER, A review of symbolic analysis of experimental data, http://www-chaos.engr.utk.edu/pap/crg-rsi2002.pdf, 2002
- Efstathiou J, S Kariuki, L Huaccho Huatuco, S Sivadasan and A Calinescu, The relationship between information-theoretic and chaos-theoretic measures of the complexity of manufacturing systems, http://www.robots.ox.ac.uk/~manufsys/ncmr2001%20janet%20stella.pdf
- Evans S.C., J.E. Hershey and G. Saulnier, Kolmogorov Complexity Estimation and Analysis, GE Global Research Technical Report, 2002GRC177, October 2002
- Evans, Scott and Bush, Stephen. F. Symbol Compression Ratio for String Compression and Estimation of Kolmogorov Complexity. Submitted to 2002 IEEE International Symposium on Information Theory.
- Feldman DP, Jim Crutchfield, A Survey of “Complexity Measures”, http://www.santafe.edu/~cmg/compmech/tutorials/ComplexityMeasures.pdf , 1998
- Funes, P. Complexity measures for complex systems and complex objects, http://www.cs.brandeis.edu/~pablo/complex.maker.html
- Fusco G. ; Minelli A., Measuring morphological complexity of segmented animals: centipedes as model systems; Journal of Evolutionary Biology, January 2000, vol. 13, no. 1, pp. 38-46(9)
- Gonzalez Andino SL, Grave de Peralta Menendez R, Thut G, Spinelli L, Blanke O, Michel CM, Seeck M, Landis T., Measuring the complexity of time series: an application to neurophysiological signals. Hum Brain Mapp. 2000 Sep;11(1):46-57.
- Gu F,, E. Shen, X. Meng, Y. Cao, Z. Cai, Higher Order Complexity Of Time Series, International Journal of Bifurcation and Chaos V14 #8 pp2979-2990, Aug. 2004
- Gunther,R; Shapiro,B; Wagner,P; 1994, Complex Systems, complexity measures, grammars and model inferring, Chaos, Solitons and Fractals, 4, 635-651
- Gusev VD, Nemytikova LA, Chuzhanova NA., On the complexity measures of genetic sequences, Bioinformatics. 1999 Dec;15(12):994-9.
- Huang L, Fengchi Ju, Enke Zhang, Jingzhi Cheng, Real-time Estimation of Depth of Anaesthesia Using the Mutual Information of Electroencephalograms, Proceedings of the 1st International IEEE EMBS Conference on Neural Engineering Capri Island. Italy March 20-22, 2003
- JänttiV, S. Alahuhta, J. Barnard and J. W. Sleigh, Spectral entropy—what has it to do with anaesthesia, and the EEG?, British Journal of Anaesthesia, 2004, Vol. 93, No. 1 150-152
- Jones K, Begleiter H, Porjesz B, Wang K, Chorlian D. Complexity measures of event related potential surface Laplacian data calculated using the wavelet packet transform.Brain Topogr. 2002 Summer;14(4):333-44.
- Khalatur PG, Novikov VV, Khokhlov AR., Conformation-dependent evolution of copolymer sequences., Phys Rev E Stat Nonlin Soft Matter Phys. 2003 May;67(5 Pt 1):051901
- Kuusela TA, Tuomas T. Jartti, Kari U. O. Tahvanainen, and Timo J. Kaila, Nonlinear methods of biosignal analysis in assessing terbutaline-induced heart rate and blood pressure changes, Am J Physiol Heart Circ Physiol 282: H773-H781, 2002
- Lake DE, Richman JS, Griffin MP, Moorman JR., Sample entropy analysis of neonatal heart rate variability.Am J Physiol Regul Integr Comp Physiol. 2002 Sep;283(3):R789-97.
- Masum, H; TURING MACHINES AND COMPLEXITY, http://www.carleton.ca/~hmasum/TMandComplexity.html 1995
- Orlov, Y, V.N.Potapov, V.D.Gusev, L.A.Miroshnichenko, Review of the methods of genetic text complexity analysis, http://wwwmgs.bionet.nsc.ru/mgs/programs/lzcomposer/review.html
- Perakh, M, Defining Complexity, A Commentary to a paper by Charles H. Bennett, http://www.talkreason.org/articles/complexity.pdf
- Pincus SM, Approximate entropy as a measure of system complexity.Proc Natl Acad Sci U S A. 1991 March 15; 88(6): 2297–2301.
- Potapov VN, V.D.Gusev, L.A.Miroshnichenko(Nemytikova), Review of the methods of genetic text complexity analysis, http://wwwmgs2.bionet.nsc.ru:8080/low_complexity/review.jsp
- RADHAKRISHNAN N, JAMES D. WILSON, and PHILIPOS C. LOIZOU, AN ALTERNATE PARTITIONING TECHNIQUE TO QUANTIFY THE REGULARITY OF COMPLEX TIME SERIES, International Journal of Bifurcation and Chaos [in Applied Sciences and Engineering], Vol. 10, No. 7 (2000) 1773-1779
- Rapp PE, Cellucci CJ, Korslund KE, Watanabe TA, Jimenez-Montano MA., Effective normalization of complexity measurements for epoch length and sampling frequency.Phys Rev E Stat Nonlin Soft Matter Phys. 2001 Jul;64(1 Pt 2):016209
- Rezek I and Roberts SJ,. Stochastic Complexity Measures for Physiological Signal Analysis. IEEE Transactions on Biomedical Engineering Vol. 44, No 9, Sept., 1998, pages:1186-1191.
- RICARDO B. R. AZEVEDO, ROLF LOHAUS, VOLKER BRAUN, MARKUS GUMBEL, MURALIKRISHNA UMAMAHESHWAR, PAUL-MICHAEL AGAPOW, WOUTER HOUTHOOFD, UTE PLATZER, GAËTAN BORGONIE, HANS-PETER MEINZER and ARMAND M. LEROI, The simplicity of metazoan cell lineages, Nature 433, 152 - 156 (13 January 2005); doi:10.1038/nature03178
- Richman JS, Moorman JR., Physiological time-series analysis using approximate entropy and sample entropy. Am J Physiol Heart Circ Physiol. 2000 Jun;278(6):
- Rosso OA, MT Martin, A. Plastino, Brain electrical activity analysis using wavelet based informational tools, Physica A 313 (2002) 587-609.
- Sasahara, K. and Ikegami, T. (2004) Song Grammars as Complex Sexual Displays. Ninth International Conference on Artificial Life, September 2004
- Shalizi CR, Causal Architecture, Complexity and Self-Organization in Time Series and Cellular Automata, Ph.D. thesis, Univ. of Wisconsin, Madison, Physics Dept., 2001
- Shalizi CR, Kristina Lisa Shalizi, James P. Crutchfield, An Algorithm for Pattern Discovery in Time Series, http://arxiv.org/abs/cs.LG/0210025 2002
- Shalizi CR, Complexity Measures, http://cscs.umich.edu/~crshalizi/notebooks/complexity-measures.html 2003
- Sleigh JW, E. Olofsen, A. Dahan, J de Goede and A Steyn-Ross. ENTROPIES OF THE EEG: THE EFFECTS OF GENERAL ANAESTHESIA. http://phys.waikato.ac.nz/pdfs/cortical/research%20papers/EEG_entropies.pdf
- Szczepanski J, JM Amigo, E Wajnryb and MV Sanchez-Vives, Application of Lempel–Ziv complexity to the analysis of neural discharges, NETWORK: COMPUTATION IN NEURAL SYSTEMS, 14 (2003) 335–350
- Torres ME and L. G. Gamero, Relative Complexity Changes in Time Series using Information Measures, Physica A, Vol. 286, Iss. 3-4, pp.457-473, Oct. 2000.
- Watanabe TA, Cellucci CJ, Kohegyi E, Bashore TR, Josiassen RC, Greenbaun NN, Rapp PE. The algorithmic complexity of multichannel EEGs is sensitive to changes in behavior. Psychophysiology. 2003 Jan;40(1):77-97.
- ZIV J AND ABRAHAM LEMPEL, Compression of Individual Sequences via Variable-Rate Coding, IEEE TRANSACTIONS ON INFORMATION THEORY, VOL. IT-24, NO. 5, SEPTEMBER 1978