 tiefpunkt
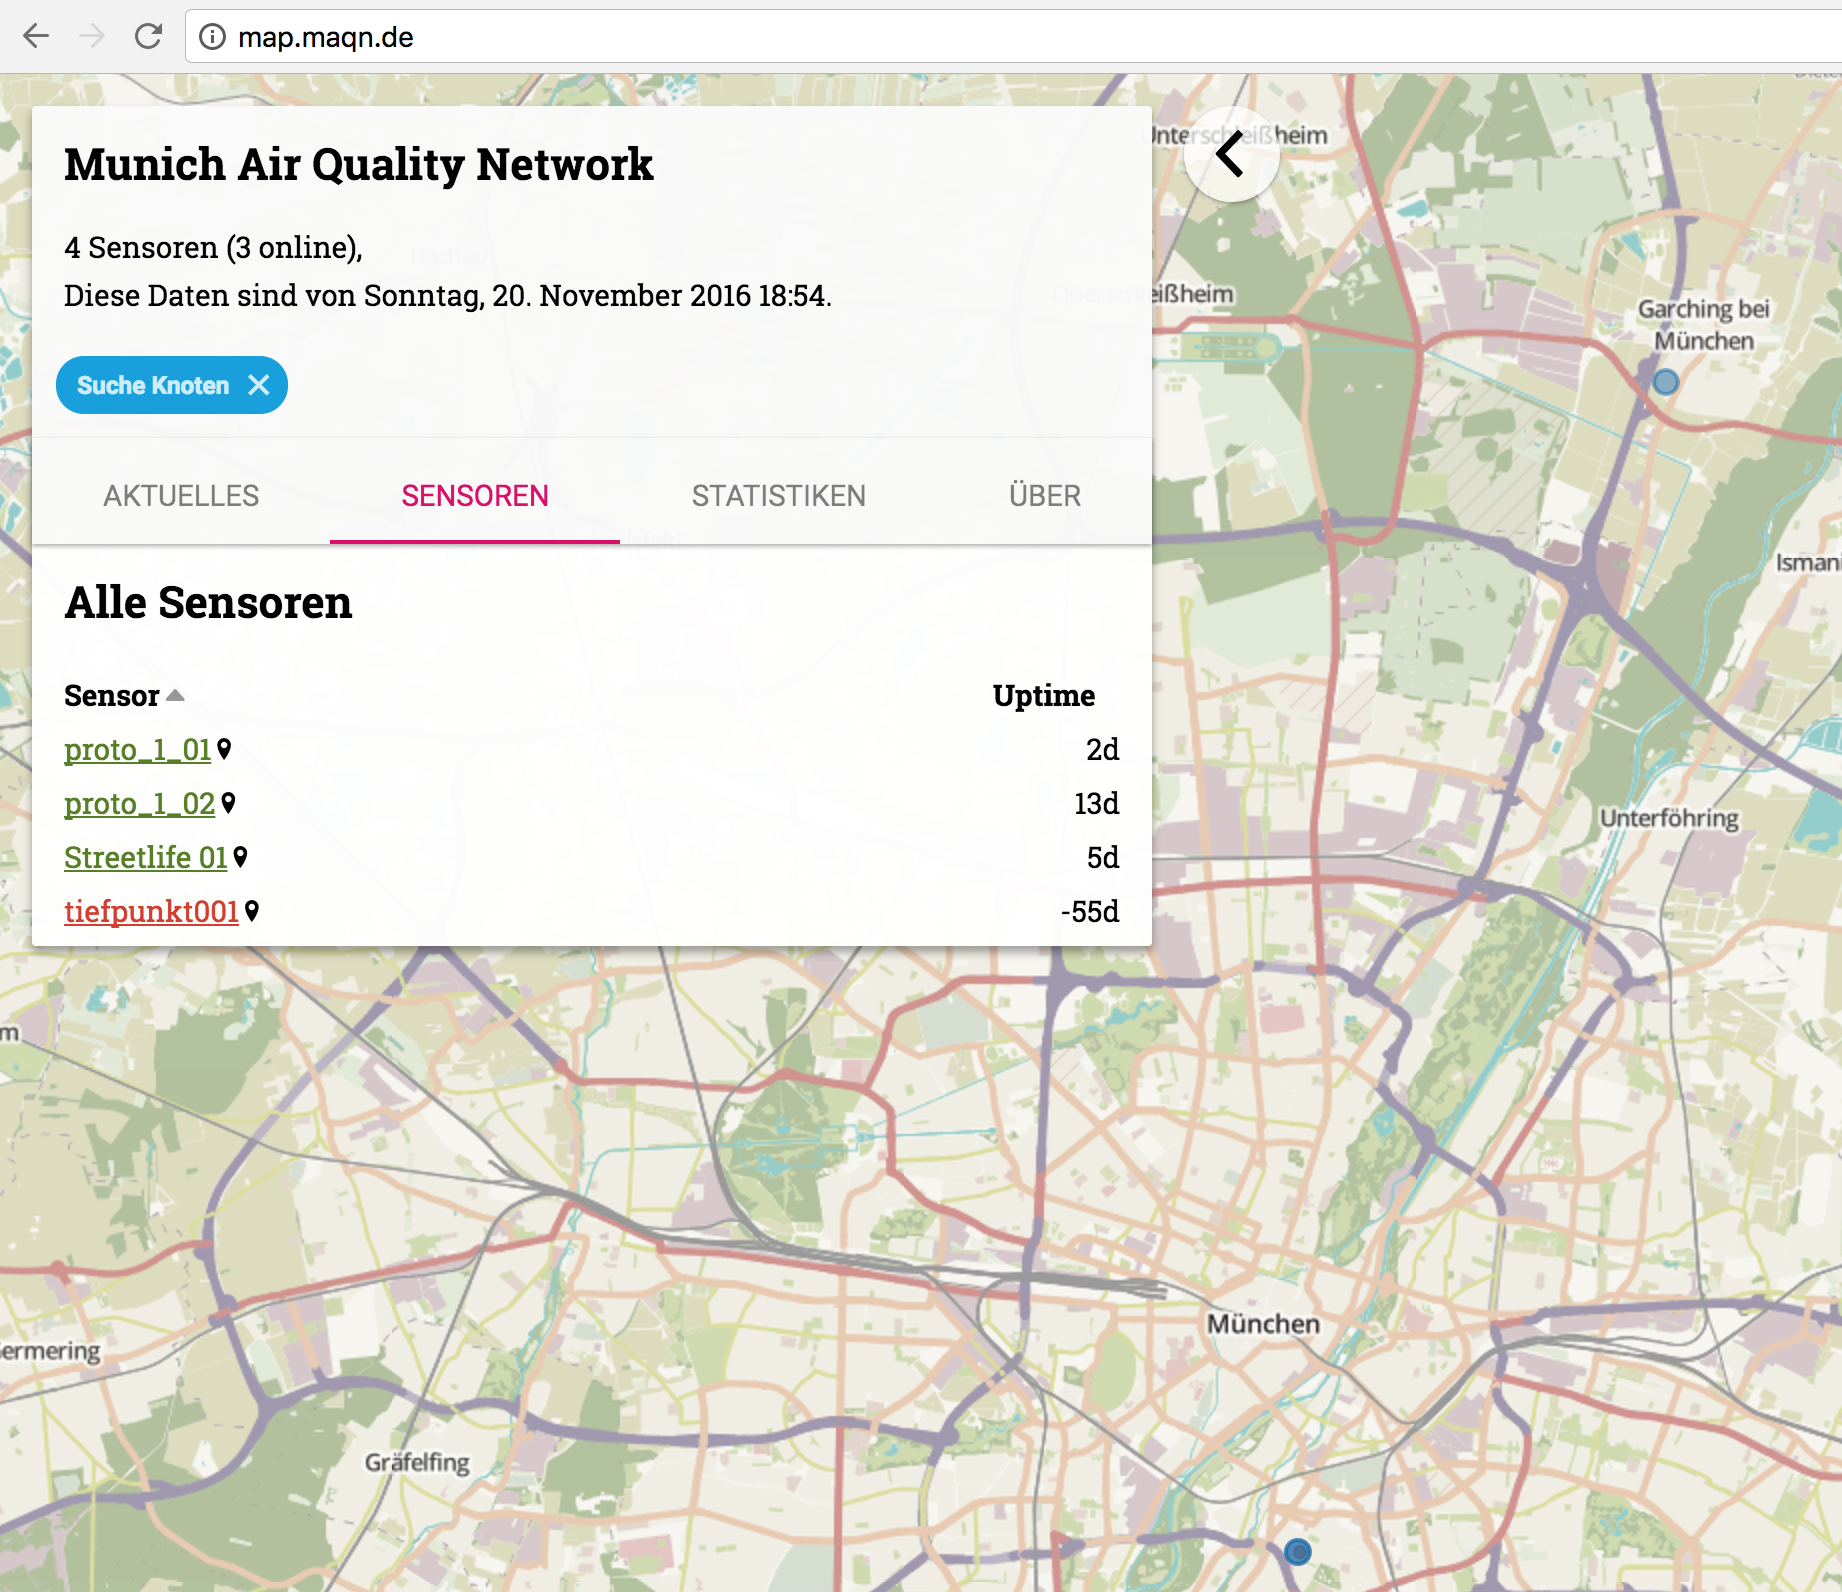
A big part of our project is to make the data we gather available to everyone. We plan to do that with a web portal. So how does it all work?
The data of course starts out on the sensor itself. That sensor then makes an HTTP request to an API, written in Python. That API takes the data, and plugs it into an InfluxDB time series database.
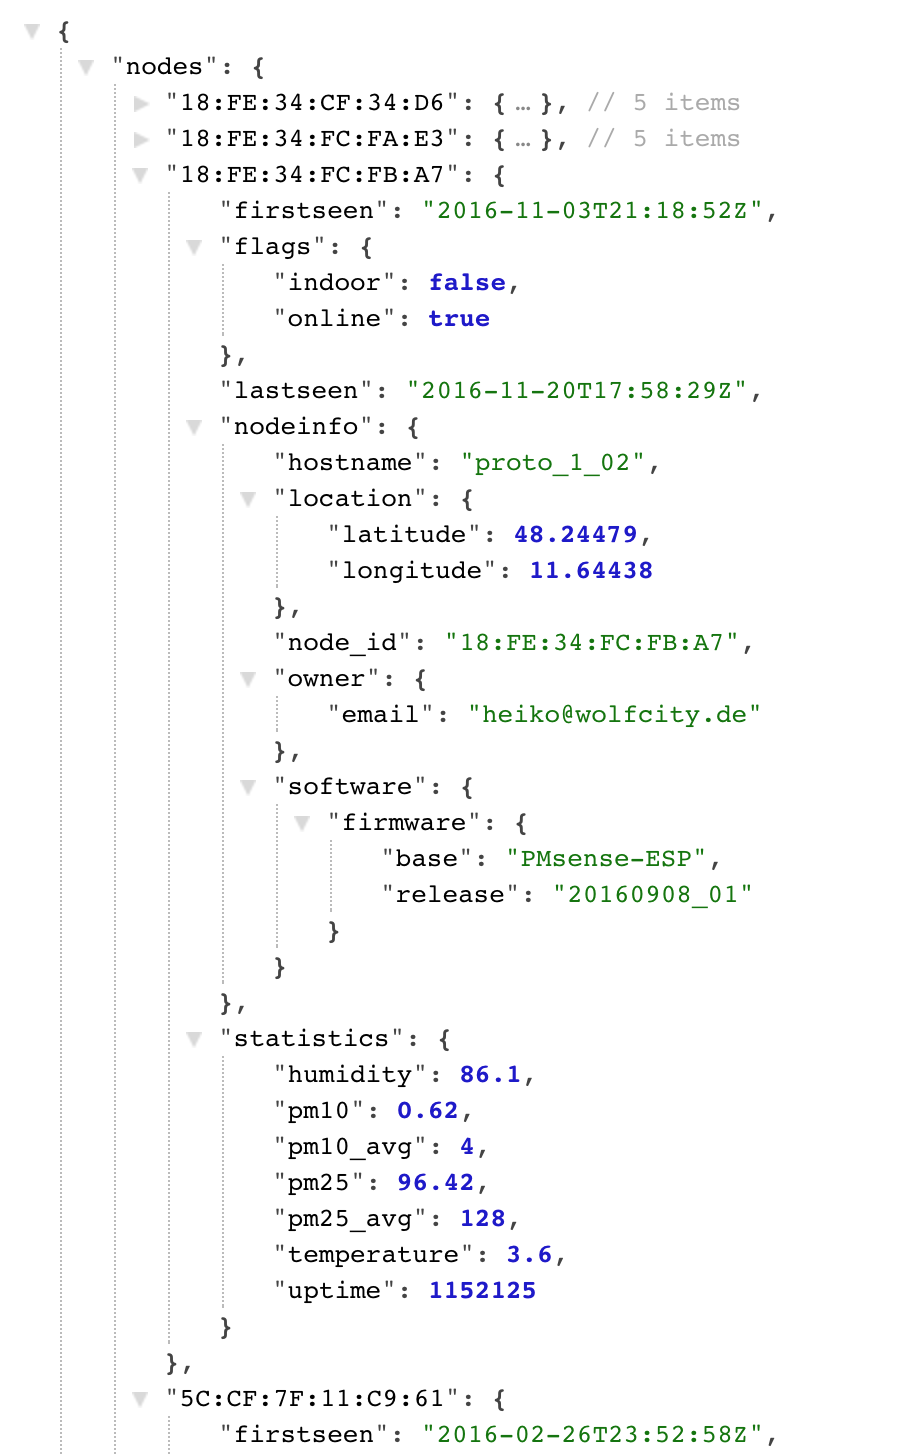
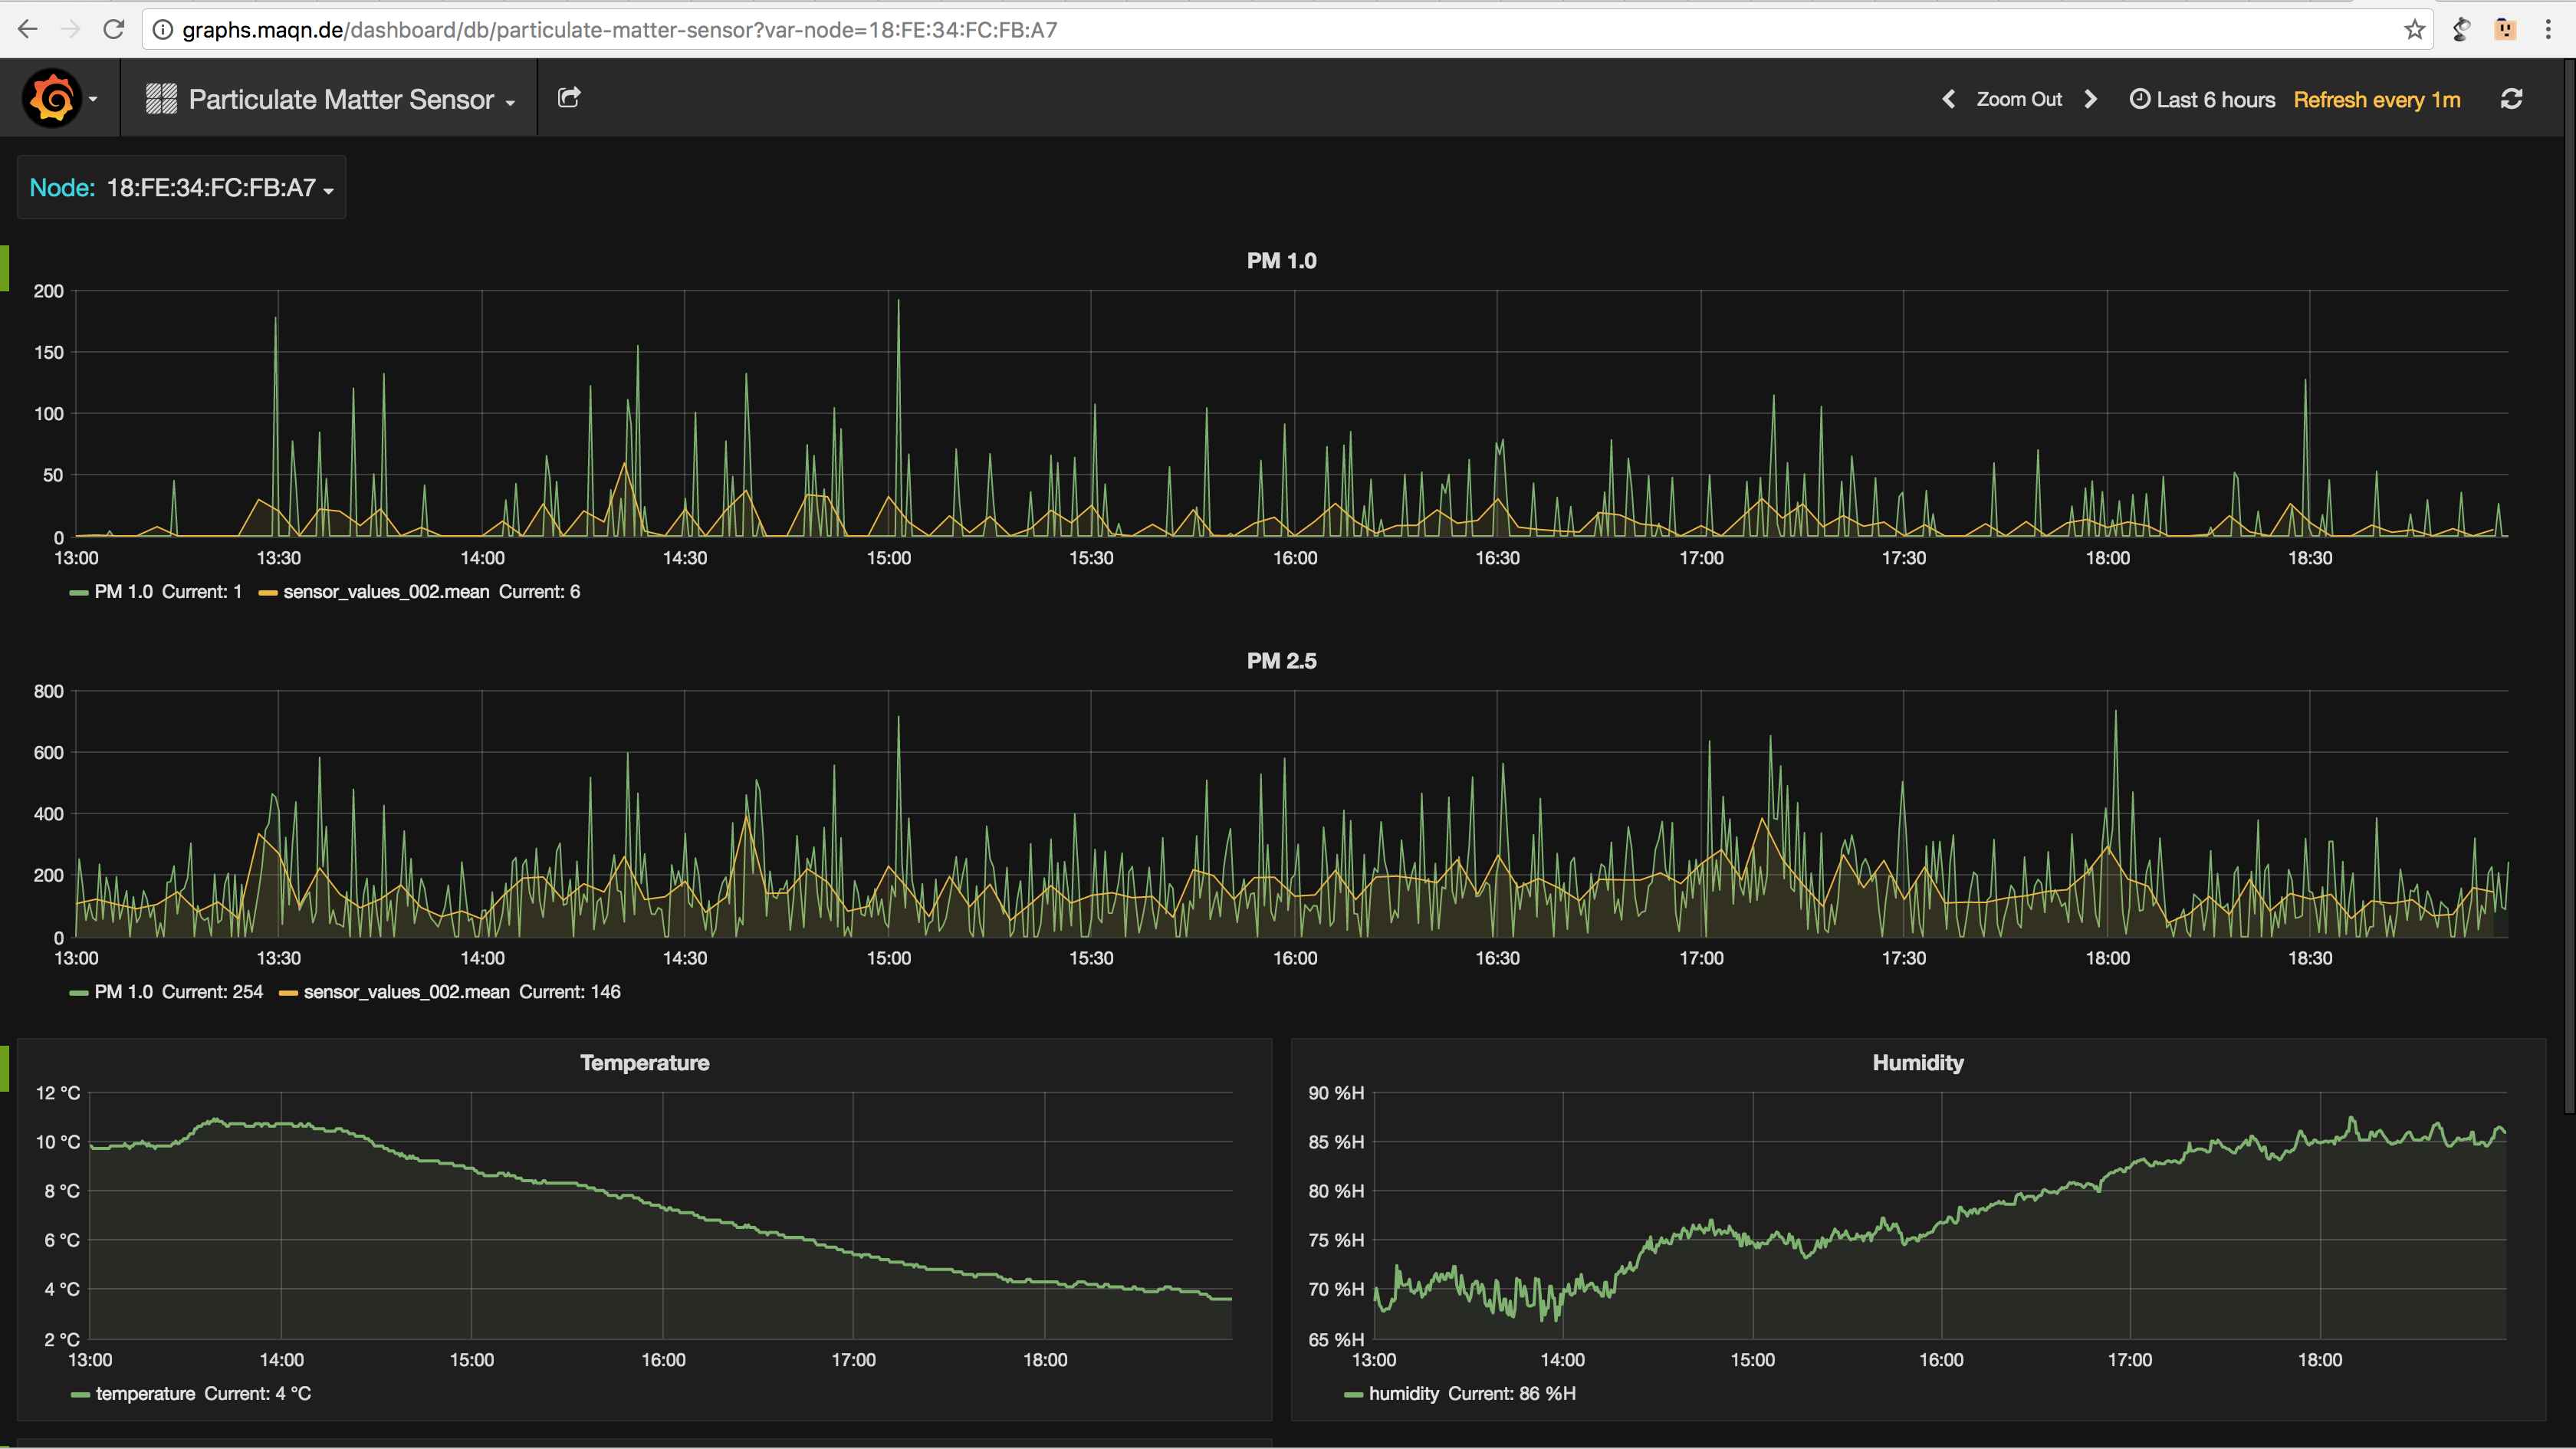
To show the data, we primarily use a map, which is derived from the Freifunk project. It takes a description of all sensor nodes from the API, and displays them on an OSM map. The API therefor takes the latest data from the InfluxDB, gets some more static information on the sensor from another MySQL database, and creates a JSON file to be read by the map. On the map, we also show graphs of some of the sensor values. These graphs are created by Grafana, which allows for a deeper dive into the data each sensor generates. It's connected to the InfluxDB, but has no access to the additional information the MySQL database has in store.
Now, if you want to see it live and in action, check out http://map.maqn.de/. We have all the source on GitHub, some on https://github.com/maqn, some still in my personal repository, https://github.com/tiefpunkt. But it'll eventually all be transferred to the MAQN (Munich Air Quality Network) organisation.
Discussions
Become a Hackaday.io Member
Create an account to leave a comment. Already have an account? Log In.