 Ted Yapo
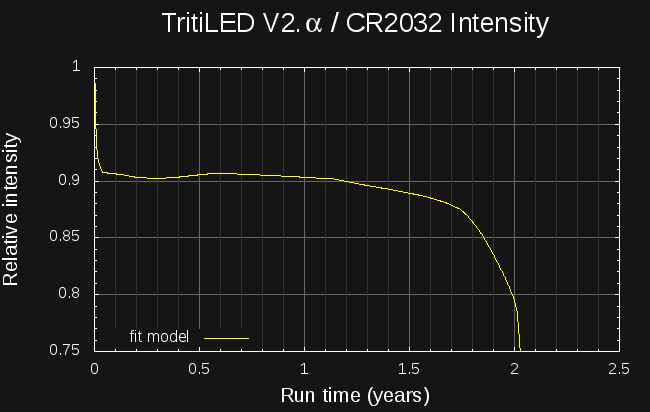
I've created a model for common lithium primary cells to predict the run-time for very-low-drain devices. Here's the estimated intensity of the V2.0α circuit run from a CR2032 cell. The light lasts for over two years, with the brightness only dropping about 10% in the last six months.
To estimate the performance, the first thing I did was make a better prototype, shown here consuming less than 13uA from a not-quite-fresh CR2032:
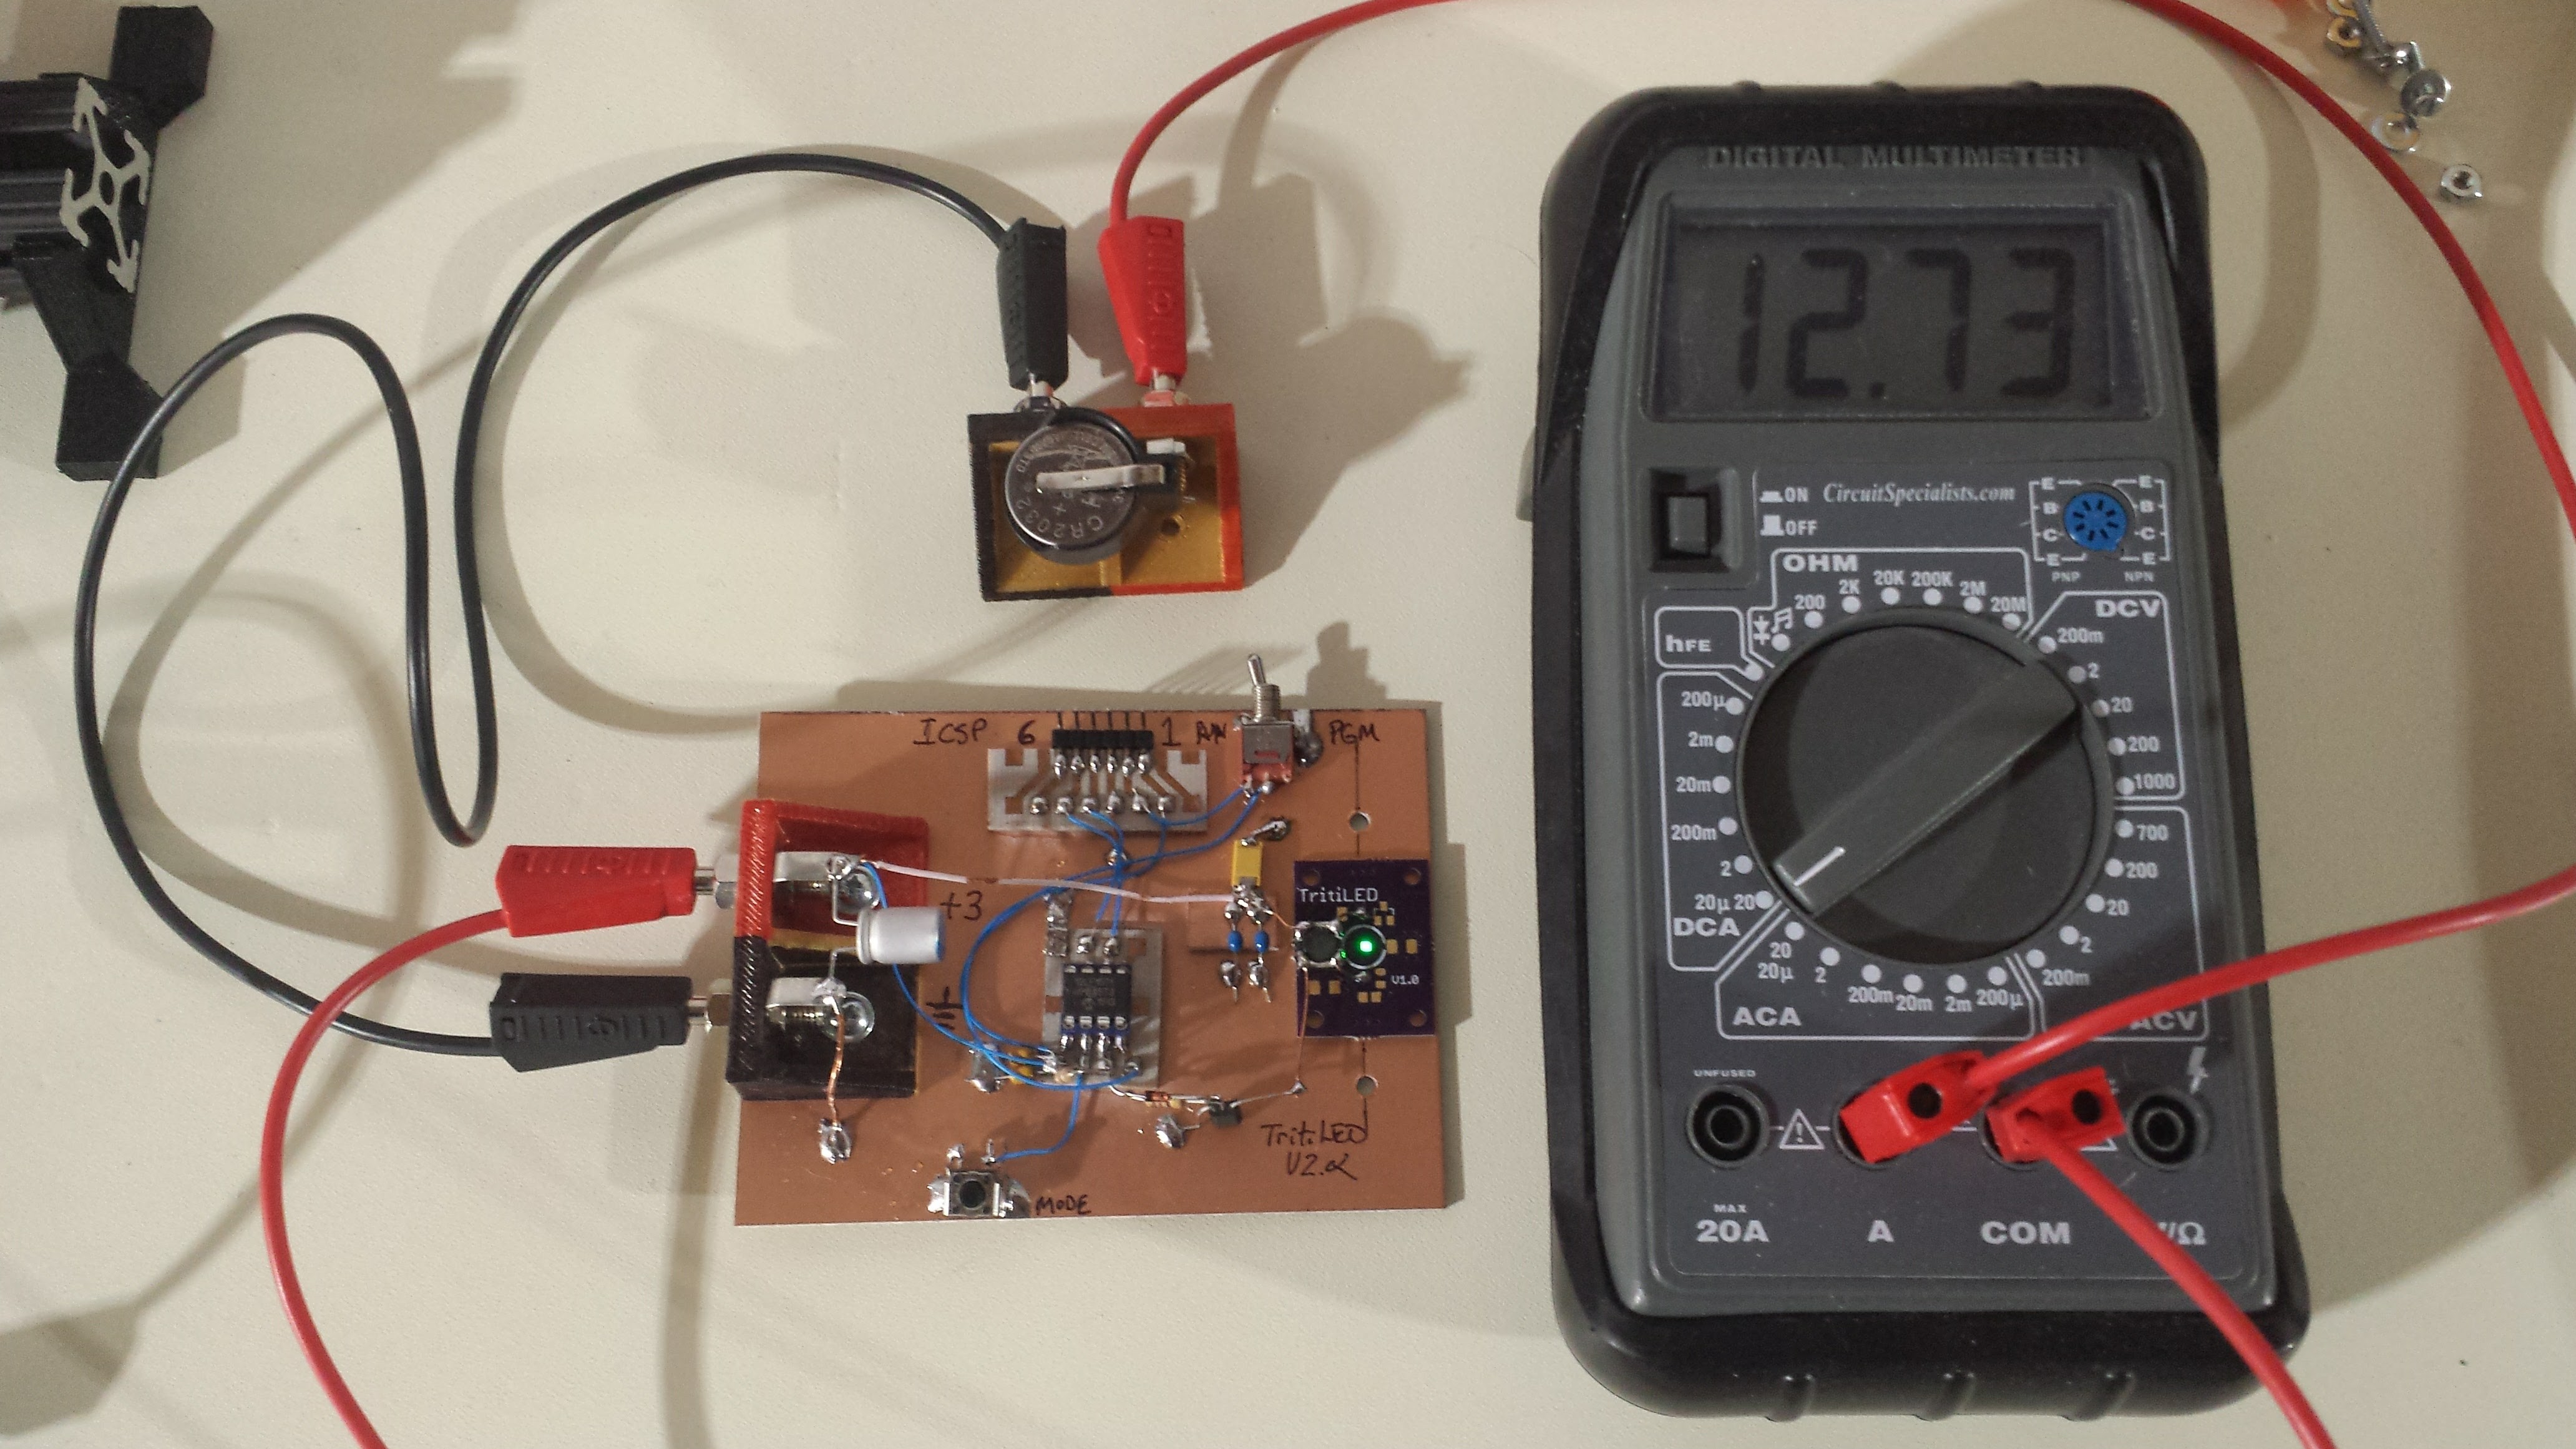
This prototype uses an SMD 1mH inductor, which was glued to the top of a V1.0 PCB. In this case, the PCB just acts as a mount for the Luxeon Z LED, which has to be reflow soldered - no other components of the V1.0 circuit were populated. The circuit is the same as shown in the previous log, using a PIC12LF1571 and a ZTX618 transistor as switch. No RC snubber network is used. This breadboarded version uses almost 1uA less than the solderless-breadboard one. I haven't directly compared the brightness yet, but it seems similar. The difference may be due to the new SMD inductor vs the previous through-hole one.
LiMnO2 Battery Model
I've been using a simple model for LiMnO2 batteries (the "CRx" series like CR2032's or CR123A's) for some time. The model seems to work pretty well under the following assumptions:
- current drain is averaged, by capacitance if required, to near-DC: no strong current pulses
- average drain is less than 0.0005C. This is around 100uA or less for a CR2032 or 800uA for a CR123A.
- temperature is assumed to be constant around 20C
- battery shelf-life is not exceeded. The model considers the battery dead after the shelf-life has elapsed, regardless of the predicted remaining capacity. Shelf-life for LiMnO2 batteries is commonly considered to be 10 years, while that of LiFeS2 cells (lithium AA and AAA) is 20 years.
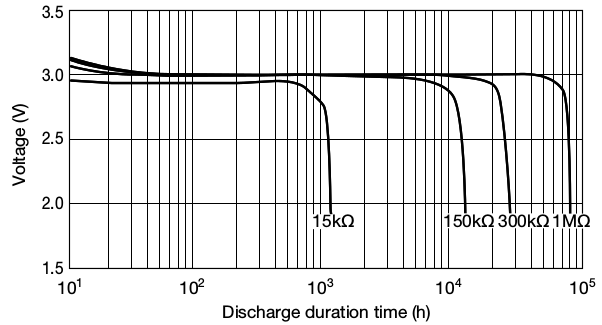
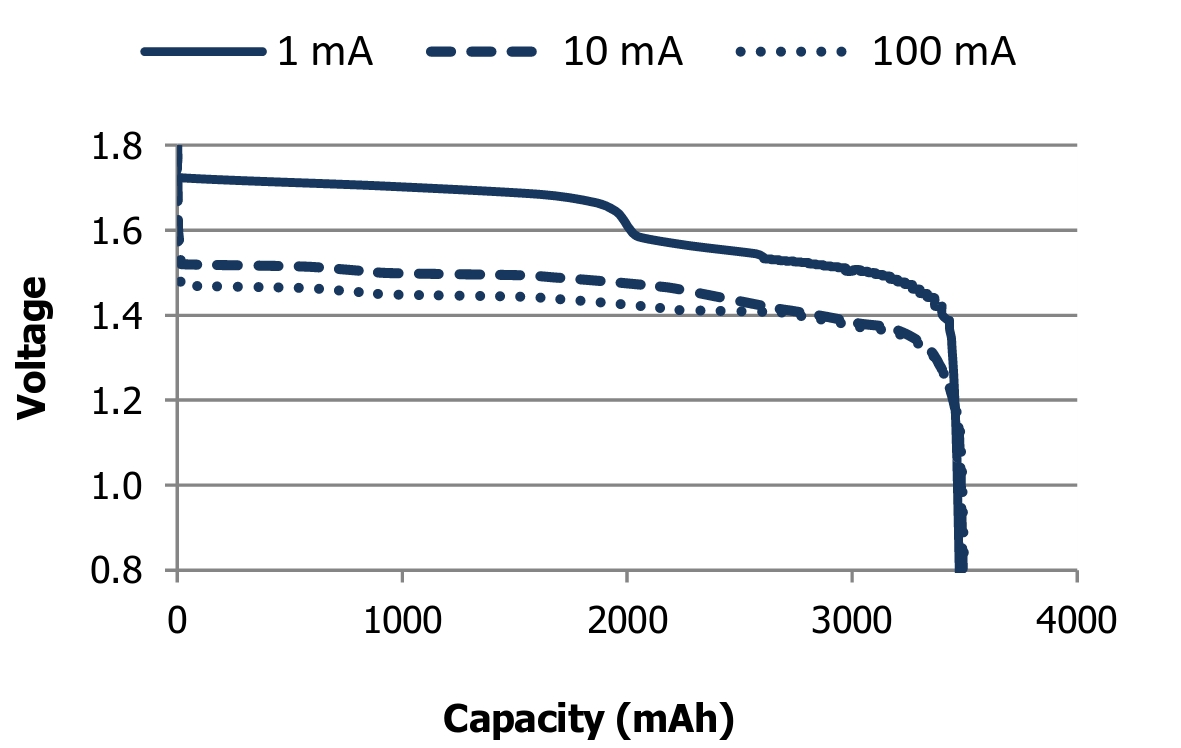
I based the model on the following curve from the Maxell CR2032 datasheet, which shows the cell voltage vs used capacity for a 1M resistor (solid line; ignore the lower pulsed discharge curve):

I digitized this curve and wrote some python code to model the battery from this data. The battery object is initialized with the nominal cell capacity (in mAh), so that different sized cells can be modeled. Three functions complete the battery model:
- battery.dead(): reports true once either the remaining capacity drops to zero or the shelf life is exceeded
- battery.voltage(): returns the cell voltage based on the remaining capacity using interpolated digitized data from the above curve
- battery.use_amp_seconds(amps, seconds): decreases the remaining capacity of the cell by amps * seconds
The model is intended to be used in an integration loop, as shown in the following code for simulating constant-resistance discharge. At each time-step (chosen to be one hour here), the battery voltage is estimated based on the remaining cell capacity. The current draw of the device (in this case a resistor) is evaluated given the source voltage, and this current is used to decrease the remaining cell capacity. The loop continues until the battery reports dead.
#!/usr/bin/env python
import sys
import Li_battery
# constant resistance discharge
R = float(sys.argv[1])
# integration time step in seconds
timestep = 3600.
battery = Li_battery.LiMnO2(220.)
t = 0
while not battery.dead():
  voltage = battery.voltage()
  print t/3600., voltage
  current = voltage / R
  battery.use_amp_seconds(current, timestep)
  t += timestep
Using this program, I was able to re-create the following plot from the datasheet for constant-resistance discharges:
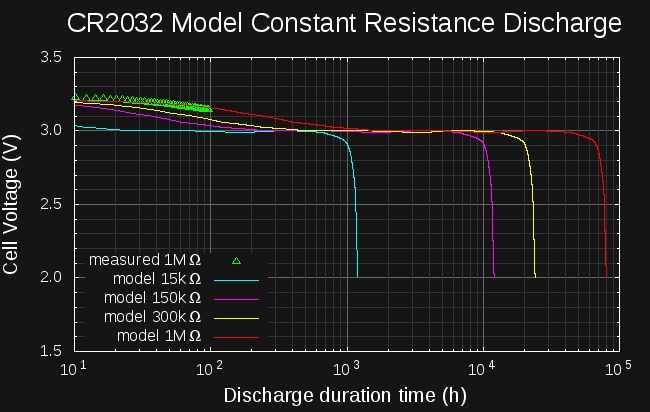
The curves match very well, and the model is able to re-produce the expected run-times and voltages with two exceptions. First, the predicted voltage for the 15k curve is too high - but, this resistance results in a nominal drain of 200uA, or 0.0009C, which exceeds the valid range of the model (violates assumption 2 above). For high-drain devices, which deplete the battery relatively quickly, you might be better off just testing the real device than trying to model it. Devices at the model cutoff of 0.0005C would run for around 90 days (the 15k resistor would only run for about 50 days).
For the higher resistances, the predicted voltages are very close, except for the initial segment. In the datasheet curves, the cell voltage falls from the initial peak to the nominal 3.0V within the first 20-30 hours. The model predicts a much slower drop, up to 1000 hours for the 1M resistance. To reconcile the two, I have been testing a battery with a 1M resistor this week. I've connected a fresh CR2032 to a 1.1M resistor in parallel with 10M input-resistance RS232 current meter, and have been logging the voltage during discharge. Shown as green triangles in the right-hand plot, the measured discharge curve is very close to the model, and doesn't drop quickly as the datasheet shows. I have no idea how the datasheet curve was produced, but the model actually seems closer to a real battery.
Circuit Power Model
The battery model is only half of the simulation: to predict device run-time, the current vs voltage characteristics of the device must be known. For the resistor simulations above, Herr Ohm has conveniently given us V = IR, but for other devices, we need to come up with our own model. As luck would have it, the analyzer I am building to measure LEDs and laser diodes can also measure the I/V curves of other devices, including whole circuits. In this case, I've used it to measure the I/V curve and brightness of the new TritiLED circuit:
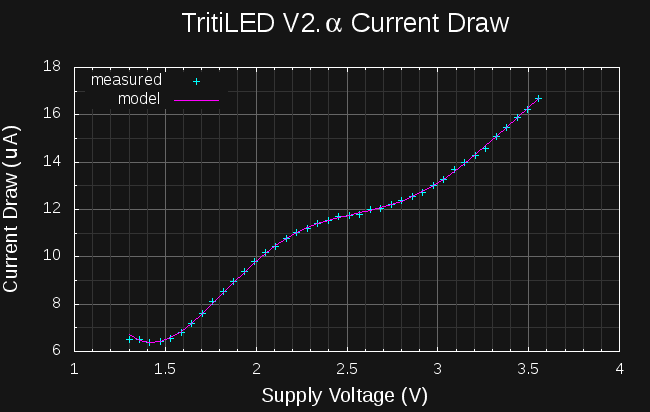
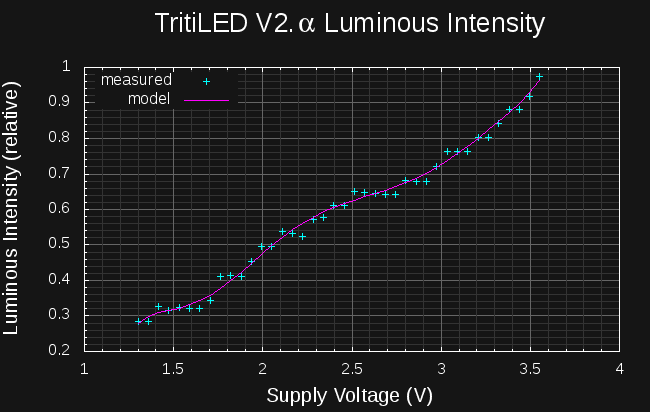
On the left, the current consumed by the circuit is shown as a function of supply voltage, while the right-side plot shows the relative brightness of the LED vs. supply voltage. I used these curves to make a device model that can predict the runtime and brightness of the circuit: simple polynomials have been fit to filter and interpolate the raw data points. The simulation code is similar to that for fixed resistors, except the device current and brightness are evaluated based on the measured curves:
#!/usr/bin/env python
import Li_battery
import tritiled_v2a
device = tritiled_v2a.tritiLED_model()
battery = Li_battery.LiMnO2(220)
# integration time step in seconds
timestep = 3600 * 24
t = 0
while not battery.dead():
  voltage = battery.voltage()
  current = device.current(voltage)
  intensity = device.intensity(voltage)
  print t/3600, intensity, voltage
  battery.use_amp_seconds(current, timestep)
  t += timestep
The results of this simulation were plotted to produce the brightness vs time graph shown at the top of this log.
LiFeS2 Battery Model
I've also made a model for lithium AA and AAA cells. These cells are unique in that they have a 20-year shelf life; low-drain devices should be able to run this long. The Energizer LR91 (AA) datasheet shows the following curves:
I digitized this plot and created a similar model for these cells. Again, I consider the model valid for drains up to 0.0005C, which equates to 625uA for AAA or 1.75mA for AA cells. Using this model, I predicted the following brightness for a TritiLED run from a pair of AAA cells. The light should last for over 9 years, with the brightness falling roughly 10% in the first five years, and an additional 10% in the last four.

At the limit of 0.0005C, devices would last about 83 days: the model is useful for predicting run-times longer than this. The limiting factor in the accuracy of this model for higher drains seems to be the battery internal resistance. If a good model for this resistance can be developed, it may be possible to extend the useful range of the battery model to higher-drain devices.
Code
The code for the battery models can be downloaded here on hackaday.io. It's released under the MIT license.
Discussions
Become a Hackaday.io Member
Create an account to leave a comment. Already have an account? Log In.