 Ted Yapo
Results
I linked the prototype viewer in the description; but here it is again for completeness:
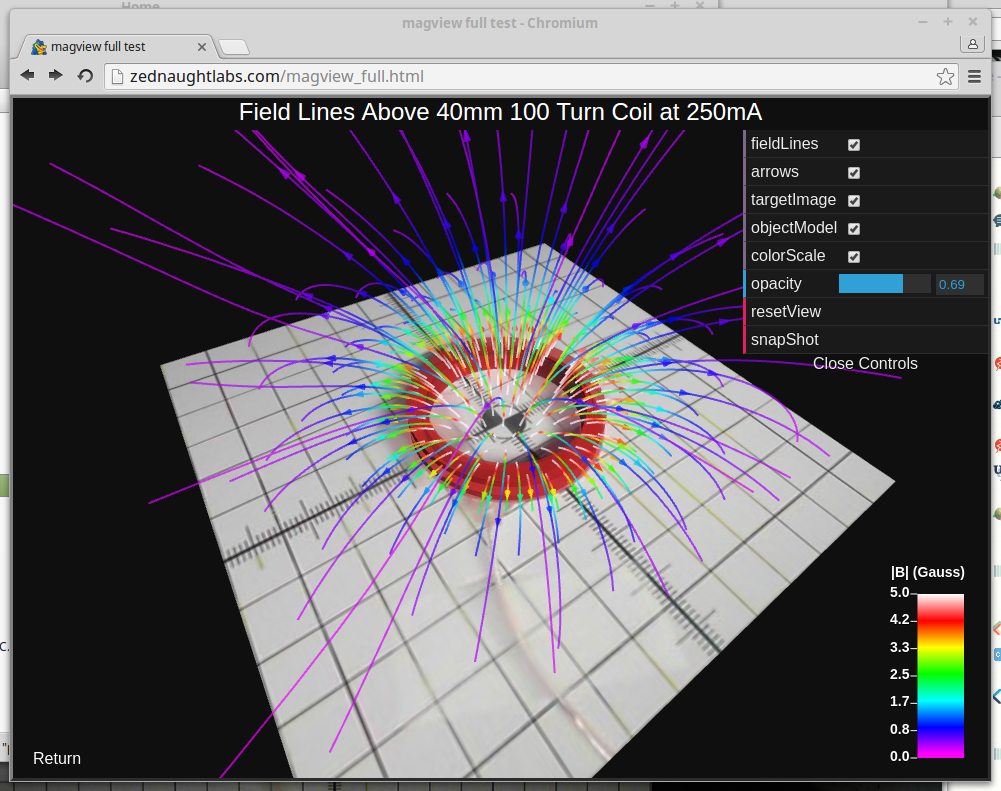
For anyone who can't run the visualization for some reason, here's a screenshot:
Software
The first proof of concept used three quick software prototypes:
- Scanner: a python program for controlling the printer and sensor
- Processor: C++ code to apply the calibration, interpolate the data, and generate the field line visualization
- Viewer: WebGL code (and necessary HTML) to display the visualization in a browser
Going forward, I intend to eliminate the second step, and generate the visualizations "on-the-fly" in JavaScript, allowing for a much more interactive exploration of the field.
Hardware
I used my Solidoodle 3 printer as a testbed for this first run. An Arduino Uno responds to serial-port commands from the python "scanner" code and communicates with an Adafruit HMC5883L breakout board over I2C.
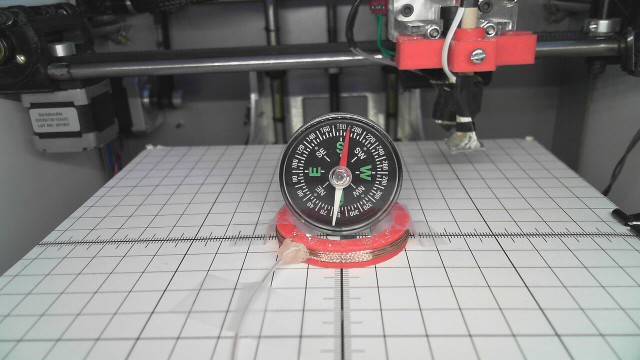
As a first scanning target, I printed a 40mm diameter coil form and wound 100 turns of magnet wire scavenged from an old oscillating fan on it - the wire is approximately 28 gauge. I drove the coil with a constant current of 250mA since this produced a good range of field strength without saturating the sensor. Using a coreless electromagnet for testing makes compensating for external fields easy - take a sample with the coil on, another with the coil off, and subtract. Here's a picture of the setup (I used the compass for a quick check of the field). The scanning head (in the background) is attached to the printer's extruder with a printed clip (in red).
A printed target sheet was attached to the printer bed, and an overhead image was used to texture-map the 3D model in the viewer. An initial experiment used controlled LEDs (just visible unilluminated at the grid corners) for automatic registration of the 2D image with the 3D model.
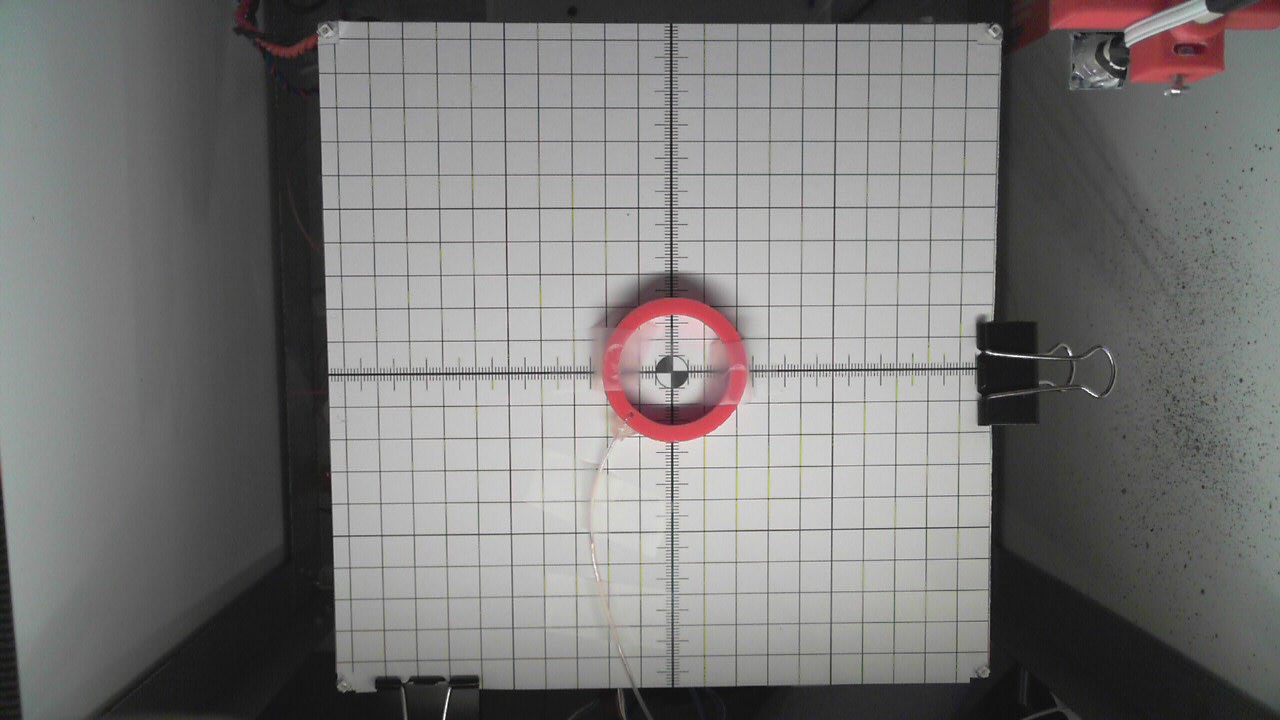
When using a known 3D model for scan boundaries, this type of (2D) printed grid will be used to align the object in the scanner's coordinate system. A PDF file containing the grid with an outline of the object's footprint can be generated - then you simply have to place the object on its 2D footprint.
Anomalies
I noticed some strange behavior with the HMC5883 sensor. The datasheet states:
In the event the ADC reading overflows or underflows for the given channel, or if there is a math overflow during the bias measurement, this data register will contain the value -4096
while this may be true specifically regarding the ADC and math overflows, I found that exceeding the range of the sensor actually generates bad data. At first I suspected the Adafruit code I used to drive the HMC5883 (sorry for the thought, Adafruit, your code is blameless here), but found the same results when I wrote my own driver. Here's what I found in a quick test with the HMC5883 inside a Maxwell coil (which produces a nearly uniform field):
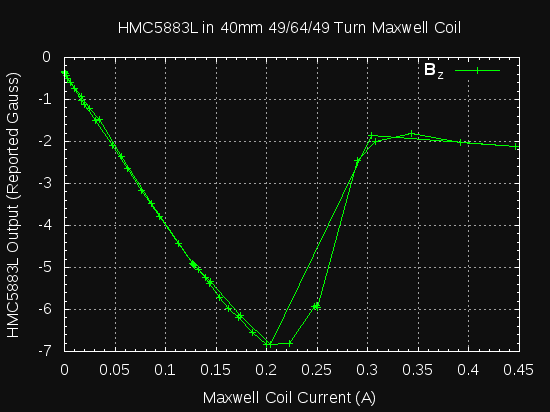
The results up to about 200mA look pretty good, then things fall apart - the output doesn't saturate as the datasheet initially led me to believe. I ran the current up, then back down looking for a tell-tale hysteresis loop that would indicate something on the board becoming magnetized (the nickel in an ENIG finish? ferrous contacts on SMD passives?), but don't see one in the lower range. The troubling part is the fold-over in the curve. If you measure -2 Gauss, is it really -2, or more like -12? I need to re-run these experiments more carefully and then determine how to proceed. If this data is correct, options include surrounding the sensor with a servo'd "compensation coil" or finding a new sensor, possibly a homebrew fluxgate on toroid cores. For now, I'll be careful not to exceed the maximum range during scans.
Discussions
Become a Hackaday.io Member
Create an account to leave a comment. Already have an account? Log In.