 Jeremy
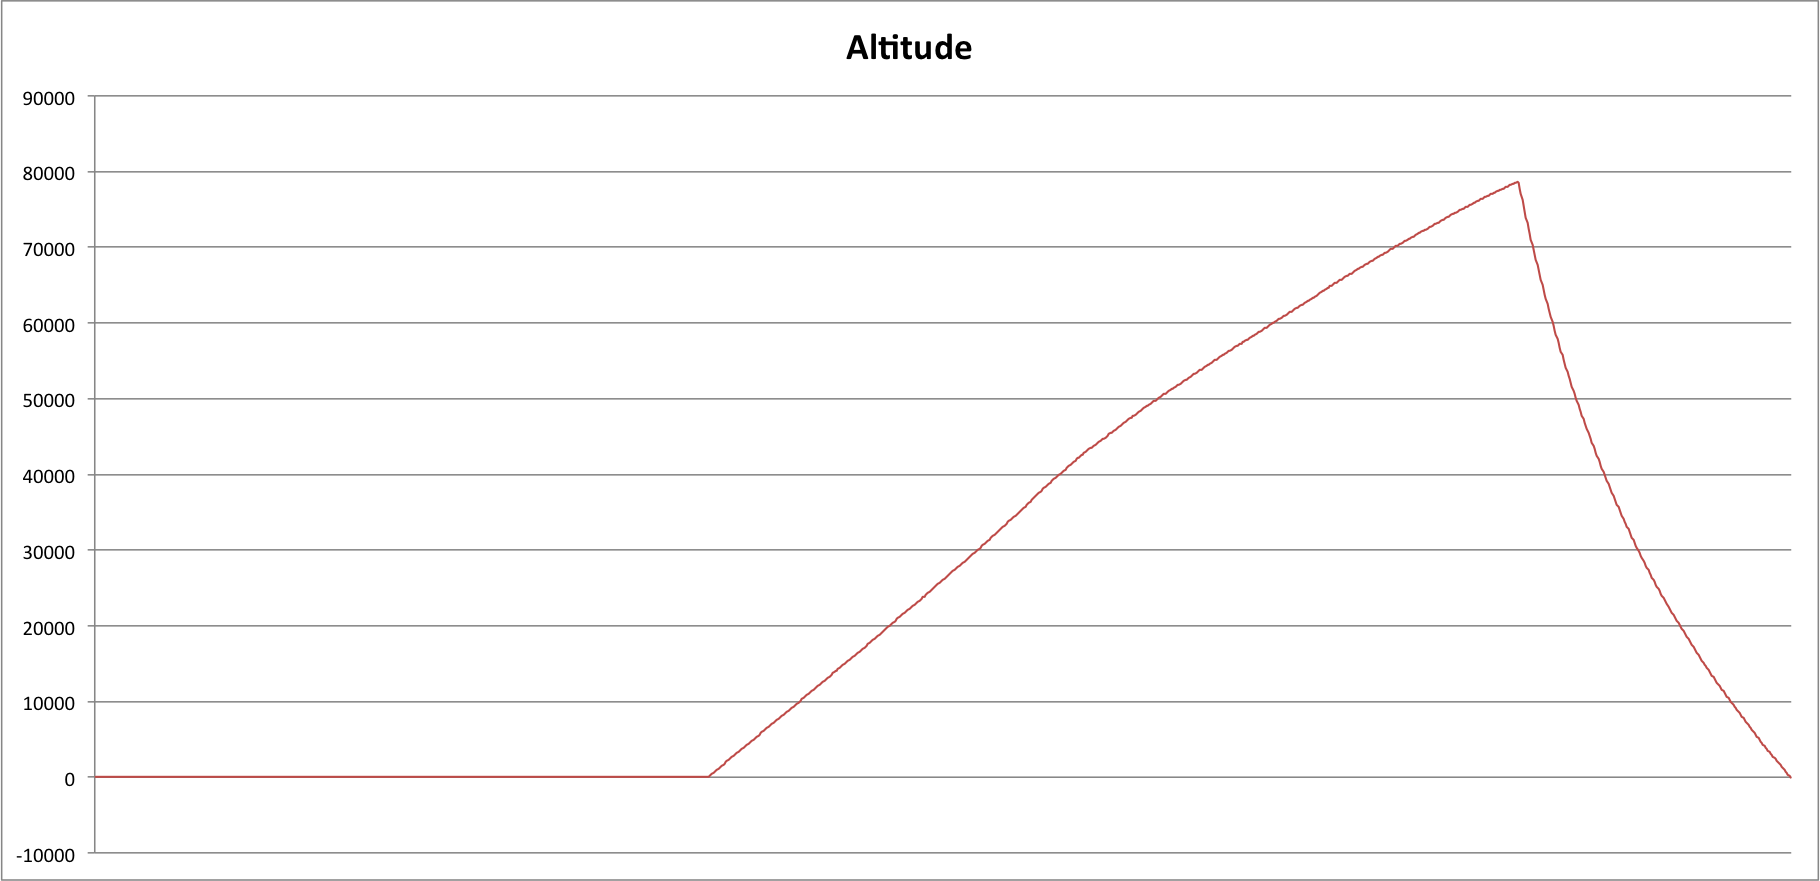
The FlightCPU provided very interesting data throughout the flight. Unfortunately due to calibration issues, the barometer did not give us accurate results in terms of absolute altitude, but we can infer the overall flight path using relative values. Other data points from gyroscope and magnetometer were difficult to parse, and even harder to graph. We are still working on the best way to visualize this data, so any suggestions would be appreciated!
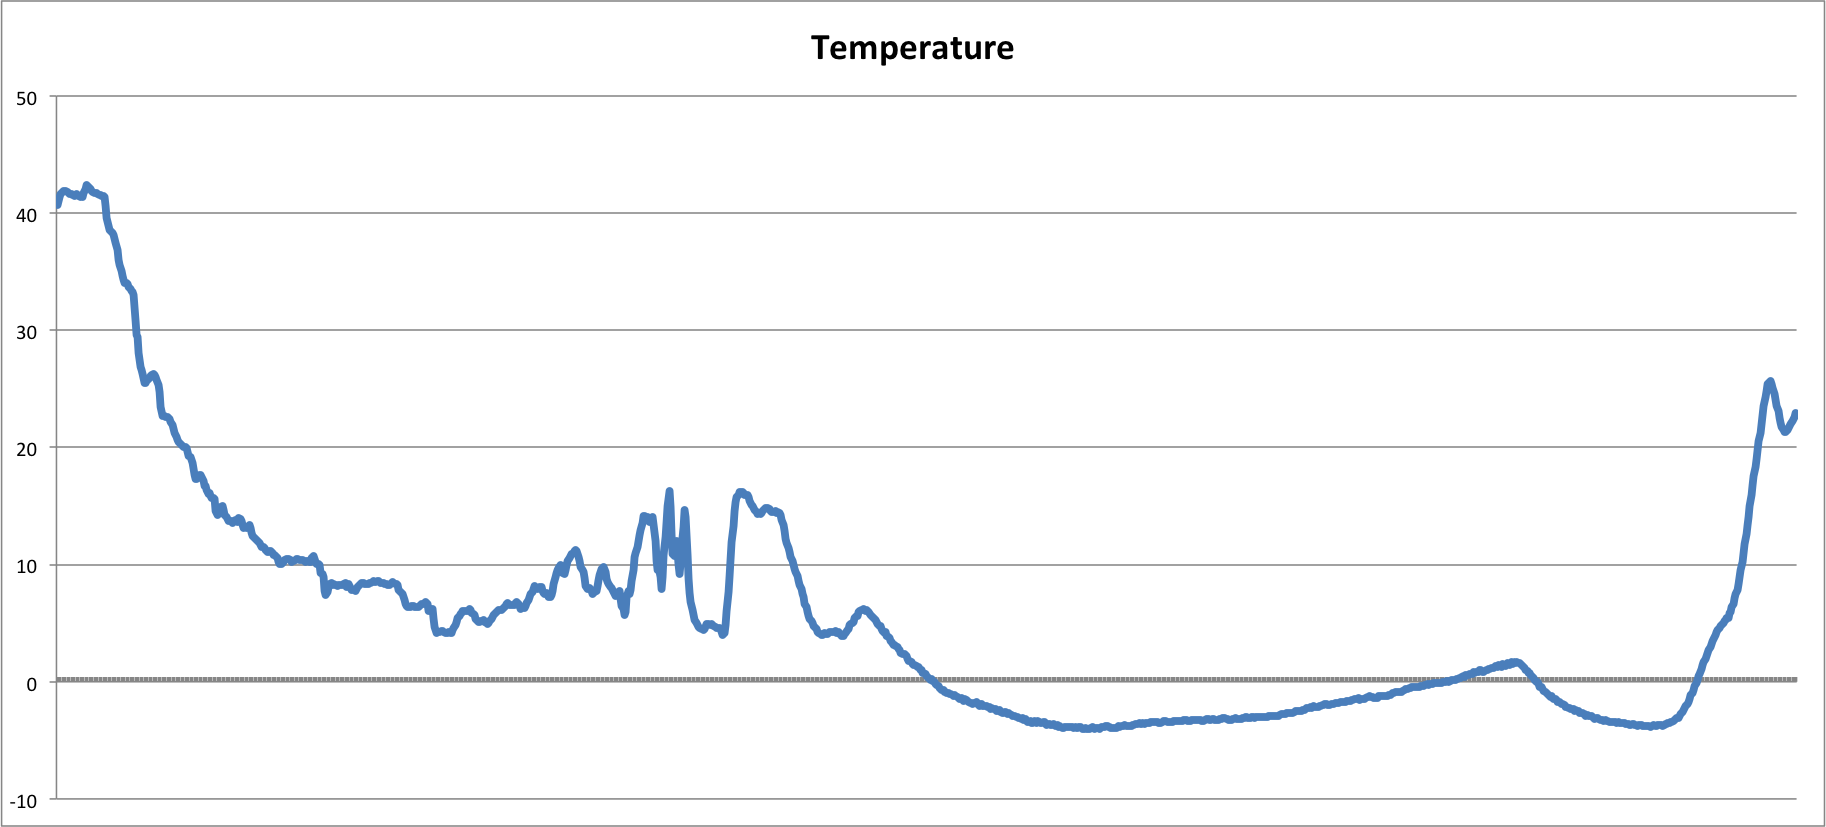
As you can see above, the temperature seems to fluctuate as the balloon rises through the atmosphere. Why is this so? Our best guess is cloud coverage (although the cameras didn't seem to indicate many clouds). It is also curious to see the temperature rise as reaches the top of the assent. Perhaps the sun had something to do with it? Note on the descent, you can see a slight change in the rate of temperature increase, we believe this lines up with the fluctuations we saw during the rise (keeping in mind the descent was much faster than the rise). One final note, the temperature starts to decrease right at the end of the graph. Because we found the payload in the woods in the shade, we believe this decrease at the end signifies the payload at rest, waiting to be found.
Discussions
Become a Hackaday.io Member
Create an account to leave a comment. Already have an account? Log In.