Close
0%
0%

Open Source FFT Spectrum Analyzer

An FFT spectrum analyzer for machinery vibration analysis, using open source hardware and software

Similar projects worth following
A computer running a program written in Python and using the libraries, Numpy, Scipy, Matplotlib, and Pyserial is the FFT spectrum analyzer. An Arduino Nano is used as the data acquisition system for reading acceleration form a ADXL335 accelerometer.
This combination makes an effective, simple and low cost FFT spectrum analyzer for machinery vibration analysis.

Overview

Machinery vibration is usually the best indicator of overall mechanical condition. It is used in preventive and corrective maintenance.

It can be measured using displacement and velocity transducers, and accelerometers. You can get an overall reading indicating the maximum value of vibration, but the most useful information is obtained with a FFT spectrum analysis of a time period reading.

Machinery vibration analyzers are usually expensive and complicated and many small and medium sized industries can't afford this instruments, particularly in my country (Bolivia).

Open source hardware and software tools are very accessible this days, and a simple, inexpensive and open source FFT spectrum analyzer can be easily built using some of this tools.

Description

For this project, an Arduino Nano is used as the data acquisition system, it contains an USB to serial converter and ADC channels. A common accelerometer, the ADXL335 is used as the transducer for vibration measurement, and a computer is the FFT analyzer, using Python and Numy, Scipy and Matplotlib libraries.

A system diagram is shown below.
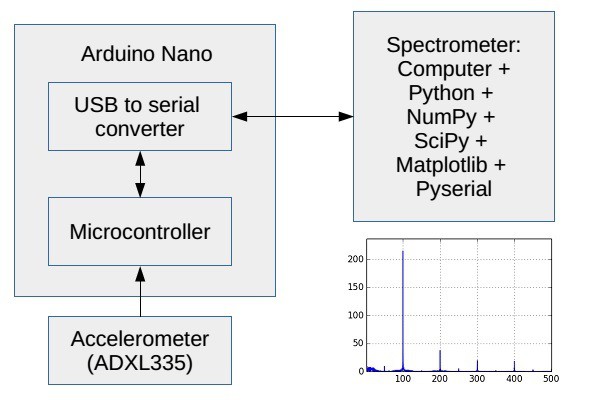
The Arduino Nano listens for an incoming command from the computer, that tells it to start or stop sending ADC readings. The ADC reads the accelerometer vibration channels on a given sampling frequency (5000 Hz), controlled by one of the micro controller timers. This readings are sent on the serial port at a speed of 0.5 Mbps.

The Arduino Nano program (adxl335_01.c ) is compiled with Avr gcc, and programmed using Avrdude and the Arduino Bootloader installed in the atMega328 microcontroller. The Arduino libraries and IDE are not used.

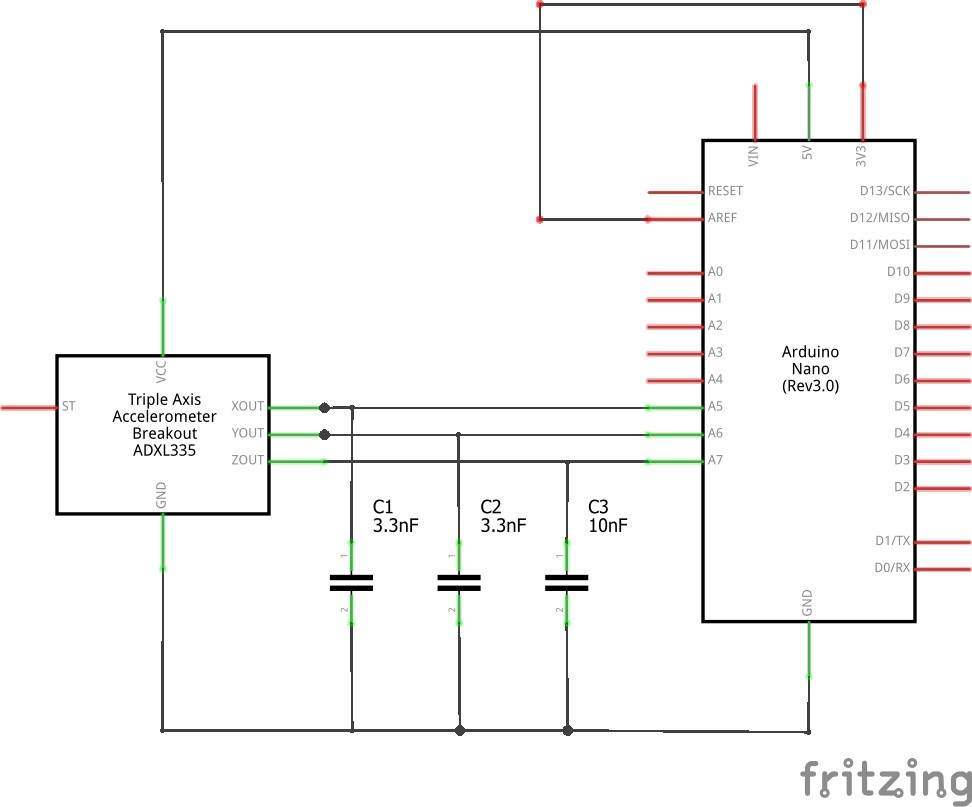
The ADXL335 is a small, thin, low power, complete 3-axis accelerometer with signal conditioned voltage outputs. Maximum bandwidth is selected for the application, with a range of 1600 Hz for the X and Y axes. The Z axis maximum range is 550Hz, and is not used because the limited range, but it is wired to the micro controller in case it is used in the future.

A circuit diagram is shown next.
The computer controls the data acquisition sending commands to start or stop the transmission of samples. The program counts the amount of data received and the amount of data it needs (sample size). When the necessary amount of data has been taken, a command to stop is send to the microcontroller. Pyserial is the python library used to control the serial communication.

The serial communication is binary based and a mechanism to mark the end of packages is necessary. A PPP type byte stuffing algorithm is used for this. In PPP frame boundaries are marked with a reserved byte value 0x7E. This reserved value is not permitted to occur in any other place than frame boundary. In a case the reserved value should occur in data packet, an escape sequence is used to transfer 0x7E into byte sequence of 0x7D, 0x5E. The byte value 0x7D means that a possible escape follows and is called a Control Escape value. Also the Control Escape itself needs to be escaped and becomes to byte sequence of 0x7D, 0x5D.

This PPP framing algorithm is used in the Arduino Nano and on the python program for the computer.

There are two python programs, one for data acquisition from the serial port and saving that data, and the second for file opening, plotting of data and FFT spectrum calculation and plotting.

Program serial_avr_01.py sends commands to the Arduino and reads data from the serial port. Once the desired amount of data has been acquired, it is saved on a file, as text, separated by comas and delimited by tags.

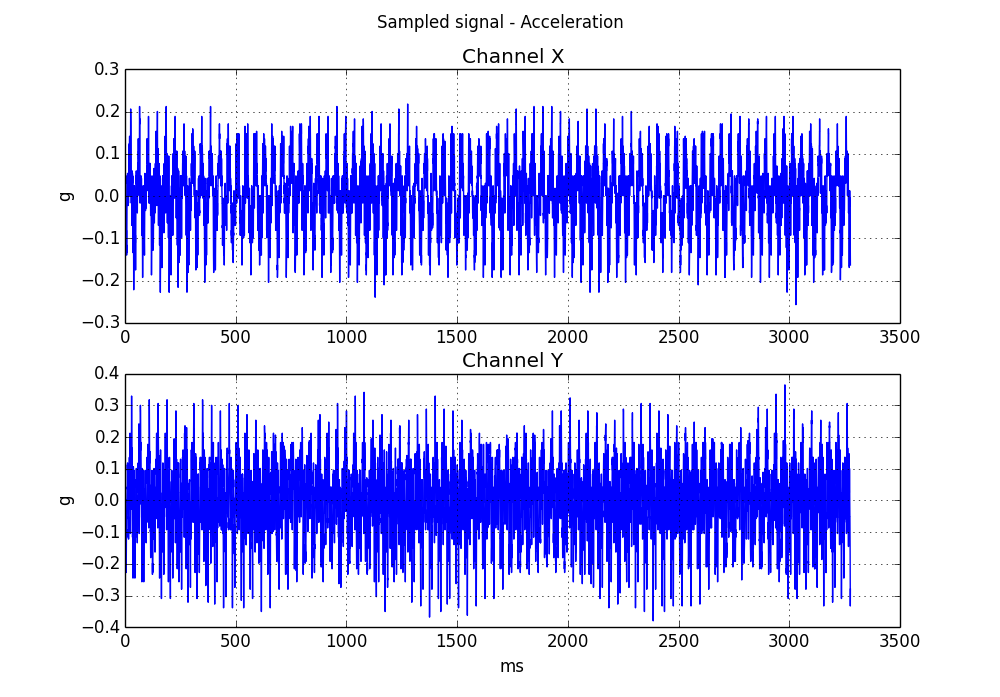
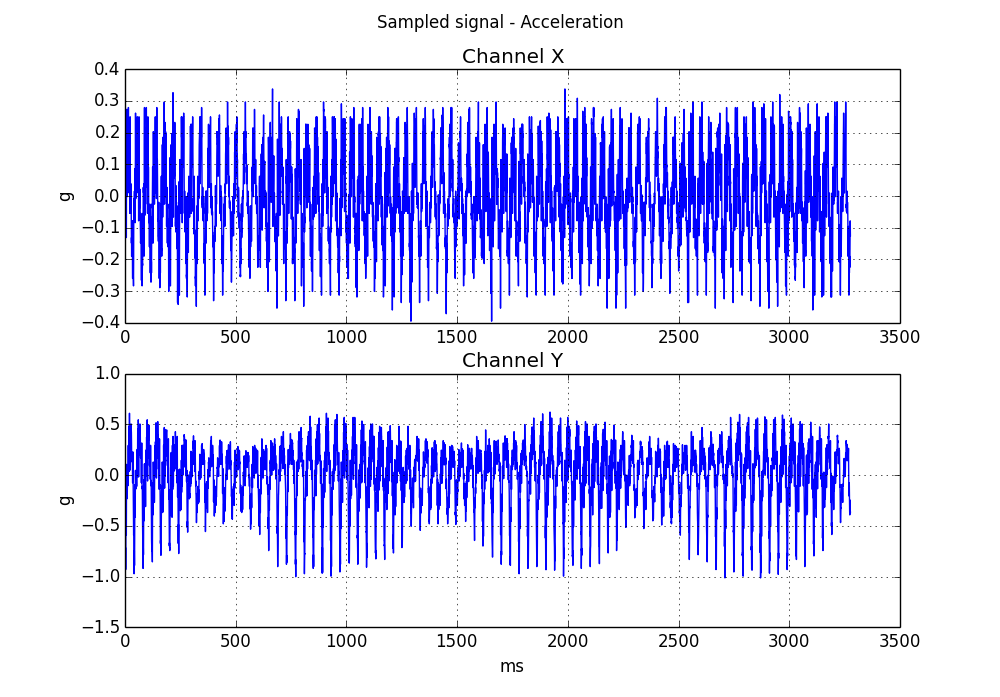
Program acel_file_plot_02.py waits for a file name introduced on console, opens the file and plots the signal from the accelerometer. It is shown on the next picture.
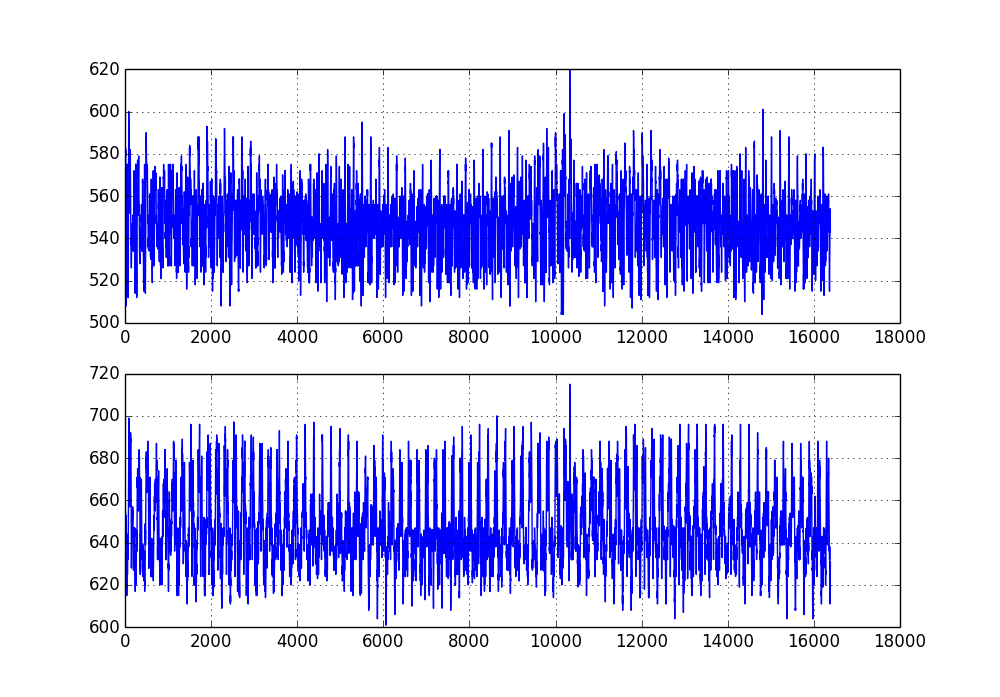
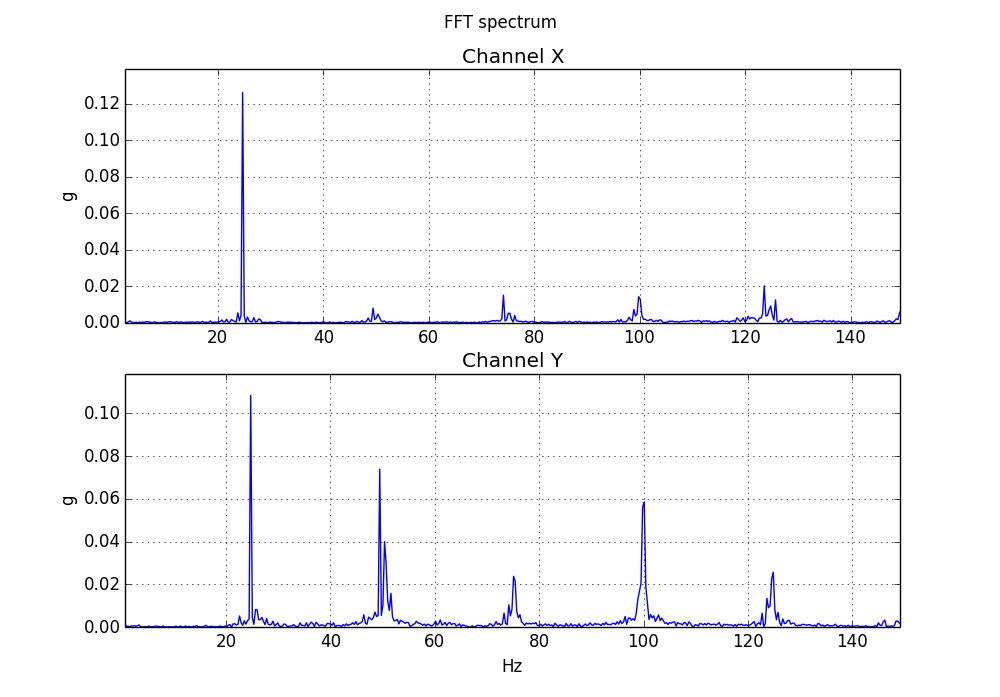
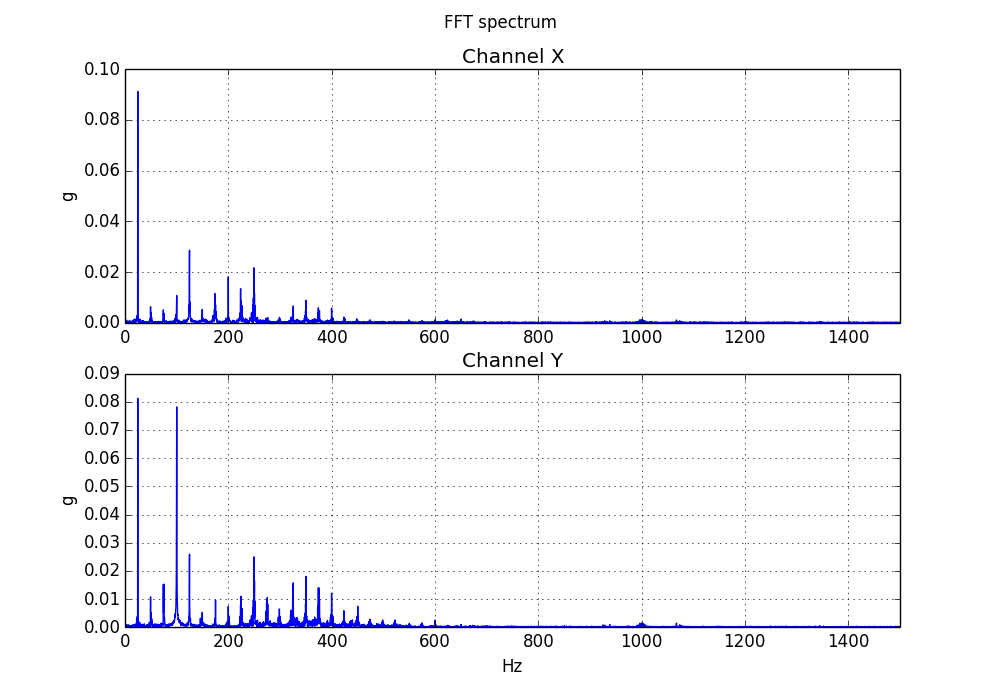
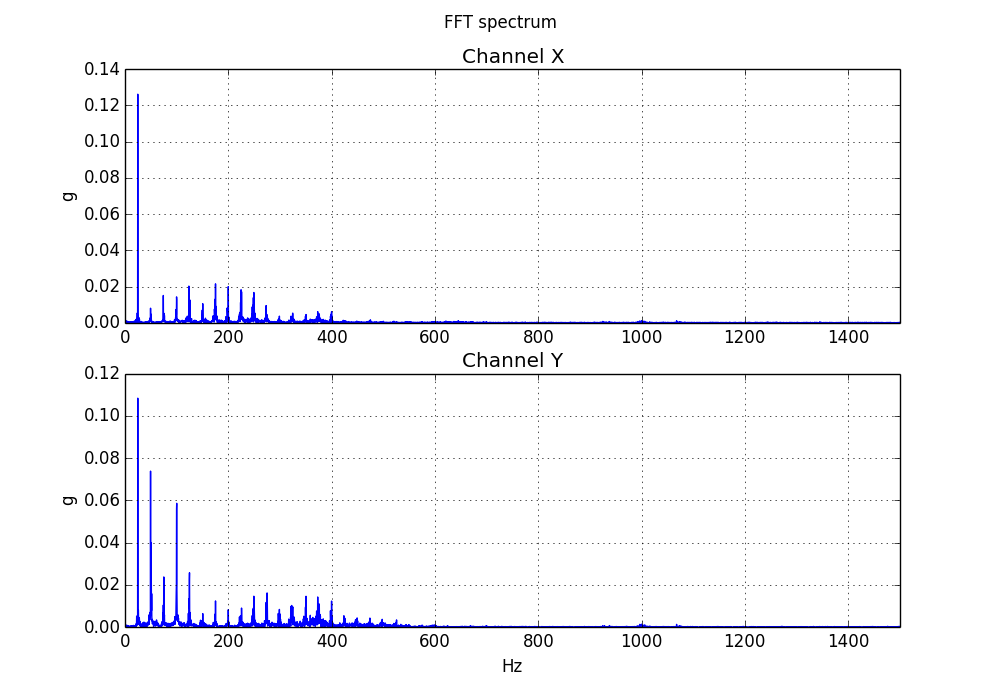
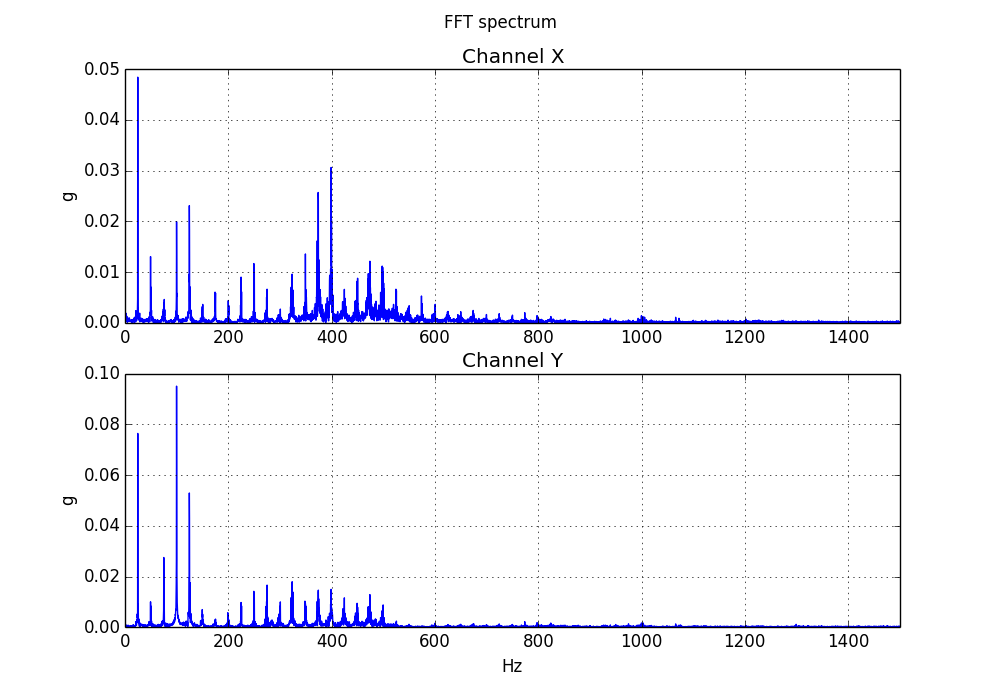
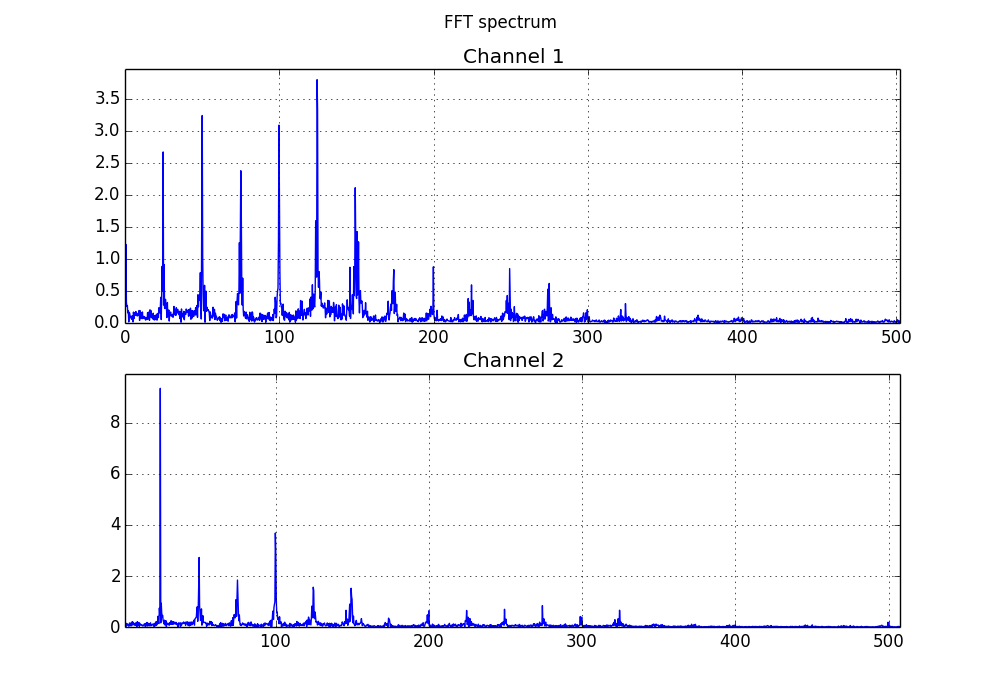
Then, the FFT spectrum is calculated and plotted. It can be seen in the next picture.

This images correspond to a motor running at 1450 rpm (24.17 Hz). It can be seen that the peaks in the FFT spectrum are multiples of this frequency (24.17, 48.33, 72.5, 95.67, 120.83 and so on).
This... Read more »

ino - 4.82 kB - 04/10/2017 at 12:44

Download

plain - 192.06 kB - 12/20/2016 at 19:20

Download

fft_spectrum_gui_3can_py3_01.py

FFT sperctrum analyzer for 3 accelerometer axis. Python 3.5

text/plain - 22.95 kB - 01/12/2017 at 20:18

Download

fft_spectrum_gui_3can.py

FFT sperctrum analyzer for 3 accelerometer axis. Python 2.7

plain - 21.50 kB - 12/20/2016 at 19:08

Download

adxl335_3can_01_en.c

AtMega328 program to send 3 accelerometer axis.

C Source File - 5.54 kB - 12/20/2016 at 19:08

Download

View all 17 files

  • 1 × Arduino Nano Microcontroller atMega328 and USB to serial converter on a single and small board.
  • 1 × ADXL335 breakoutboard ADXL335 3-axis accelerometer and a breakout board to make signals accessible.

  • Correction in g calculation

    Ariel Quezada02/08/2018 at 14:41 0 comments

    An error regarding the g_scale for calculating g from accelerometer voltage was pointed and corrected by Steve Ferry (thank you Steve).

    adc_resolution = 3.3 / 1024 # Vref = 3.3V, 10 bit ADC.

    accelerometer_sensitivity = 1000/300 # 300 mv/g

    g_scale = adc_resolution * accelerometer_sensitivity = (3.3 / 1024) * (1000/300)

    The Python 3 program has been corrected with this new value.

    I think the mistake was to assume that +-3g would cover the whole ADC range, but it will cover only around 2 V, not all the 3.3 V (Vref) range.

    Looking through the ADXL335 datasheet, the output is ratiometric (proportional to supply voltage), and the 300 mV/g is the approximate value using a 3.0 V supply. This numbers can have around 10% variation between devices, so I think that an additional correction factor will have to be introduced and calculated (calibrated) for each different accelerometer used.

  • Third axis and Python 3.5

    Ariel Quezada12/20/2016 at 19:39 0 comments

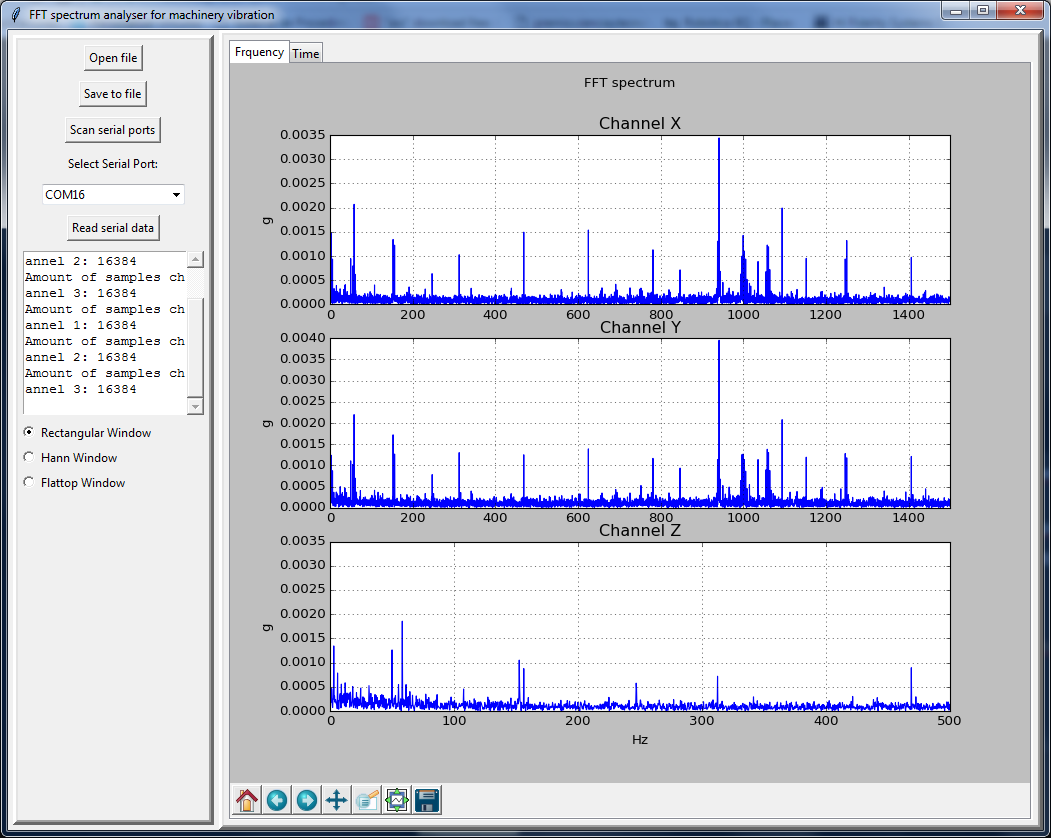
    I have added a third axis to the spectrum analyzer. The atMega328 (Arduino Nano) program is adxl335_3can_01_en.c. The Python 2.7 program is fft_spectrum_gui_3can.py.

    I also made a version of the three axis analyzer that works with Python 3.5, fft_spectrum_gui_3can_py3_01.py.

    There is also a file with sampled data for testing purposes datos_3can_20-12-2016__11_39_50.txt. Works with both versions of the 3 axis FFT analyzer.

    Notice that the accelerometer Z axis is limited to 500 Hz.

    This files are also available on GitHub at https://github.com/ariquezada/FFT-spectrum-analyzer/tree/master/3_axis.

    The screen shot is shown below.

  • GUI program with window functions

    Ariel Quezada07/13/2016 at 21:40 0 comments

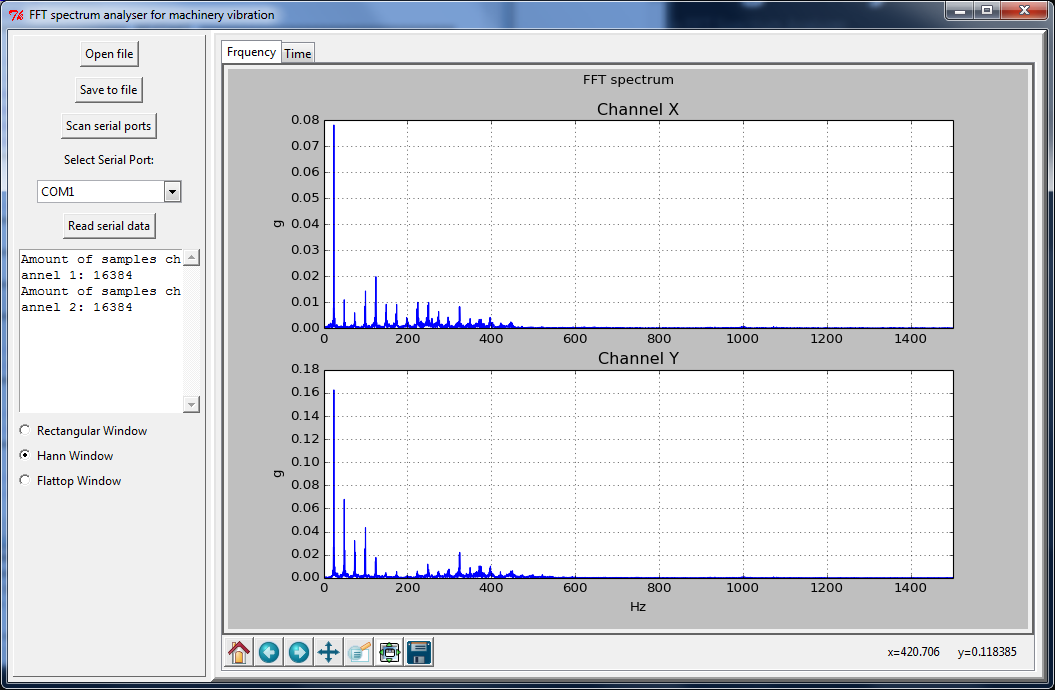
    I updated the GUI program, and now it includes the window functions (rectangular, Hann and Flattop). These functions can be selected using radio buttons.

    This is a screen shot of the new GUI. The radio buttons are at the end of the left panel.

    I also uploaded some text files with acceleration measurements. The file names start with “datos…” and a date and time. These files can be used for testing.

  • GUI program

    Ariel Quezada06/24/2016 at 19:39 0 comments

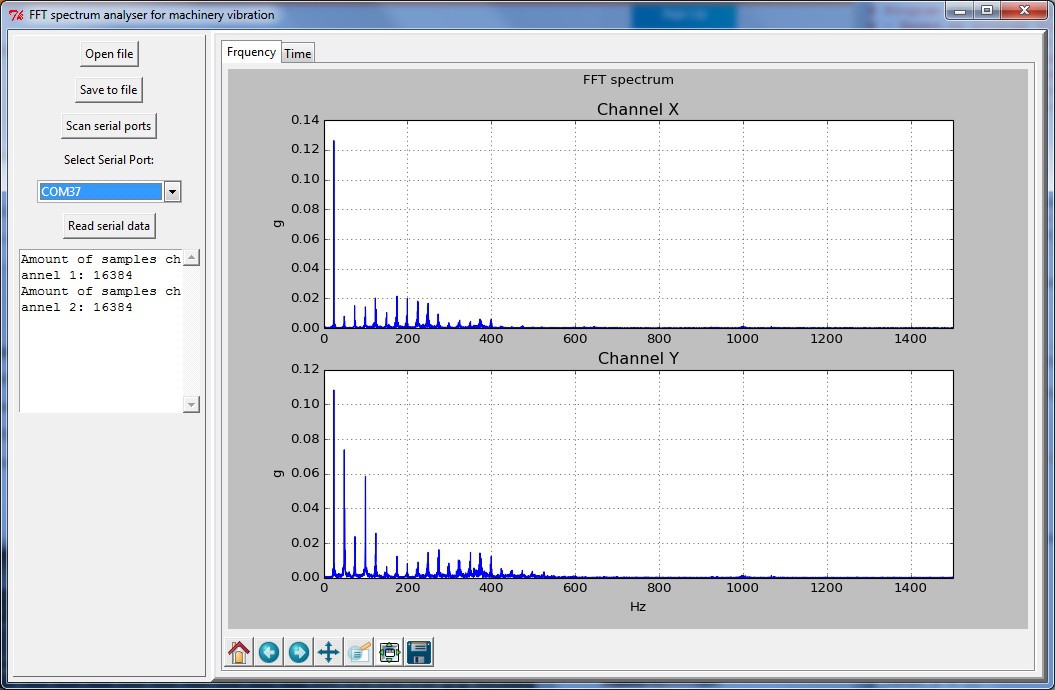
    A program with a GUI has been developed (fft_spectrum_gui.py). It uses the Tkinter library, basically because it is the one included with Python, and no additional programs are needed. Also, it integrates very well with matplotlib.

    The new program combines the programs acel_file_plot_03.py and serial_avr_01.py. This new interface lets you scan serial ports, select the serial port, save the sampled data to file, and open files with sampled data previously saved. It also has a scrolled textbox where messages are displayed (the ones printed on the previous programs).

    A screen shot is shown below.

  • Window functions

    Ariel Quezada06/09/2016 at 15:15 0 comments

    Window functions are used to avoid signal leakage, that can hide low amplitude level signals when their frequency is close to high amplitude level ones. To avoid this leakage, the input samples are multiplied to a mathematical function, so the samples at the center of the sampled time are favored while the values of the samples at the extremes, are lowered. Usually Hann and Flattop windows are applied. Using Python and Scipy, applying window functions is very simple.

    First, you have to import the signal module

    from scipy import signal

    Then create the window function coefficients. For the Hann window use

    w = signal.hann(N, sym=False)

    For the Flattop window use

    w = signal.flattop(N, sym=False)

    N is the length of the signal (number of samples).

    Finally apply the FFT to the signal weighted with the window function.

    yf = fftpack.fft(y*w)

    Program acel_file_plot_win_01.py plots the FFT spectrum using the window functions.

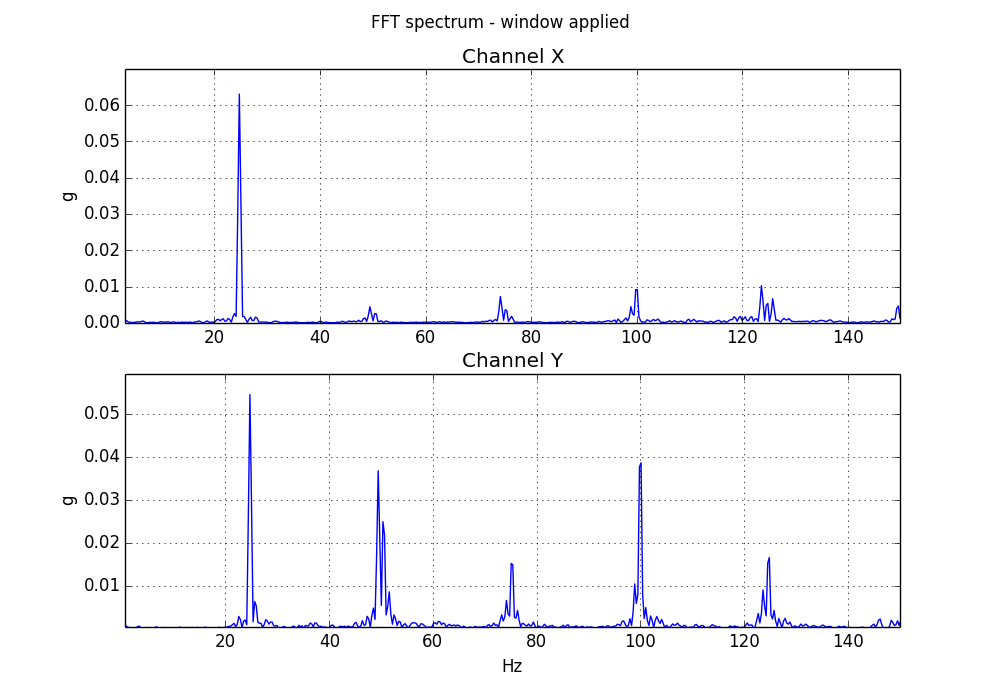
    After applying the window functions, no much change is visible in the signal frequency separation and only the amplitude is reduced. Apparently, signal leakage is low for the sampled data used, and further testing would be required to validate this functions.

  • Some testing

    Ariel Quezada06/08/2016 at 18:06 0 comments

    Three measurements on the same rotating machine were taken for testing the instrument response. The first measurement was taken without modifying the machine.


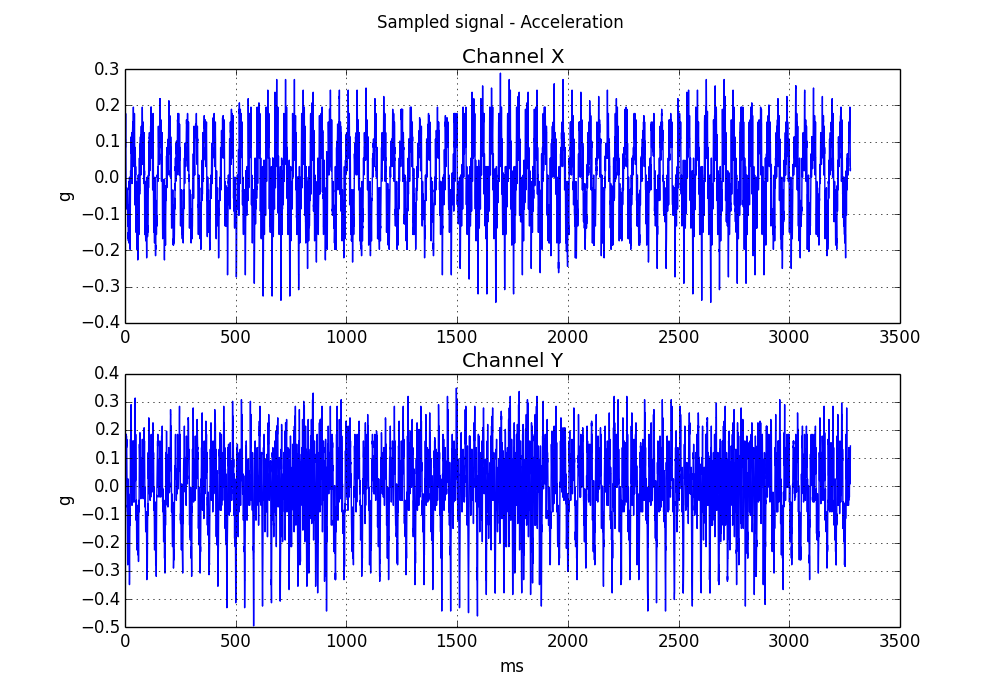
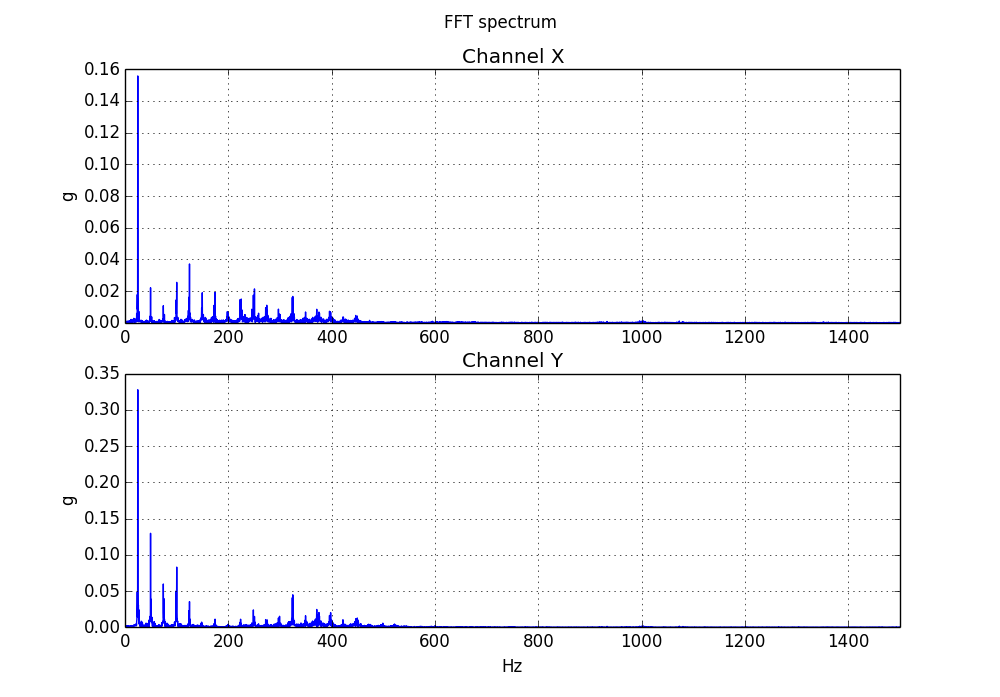
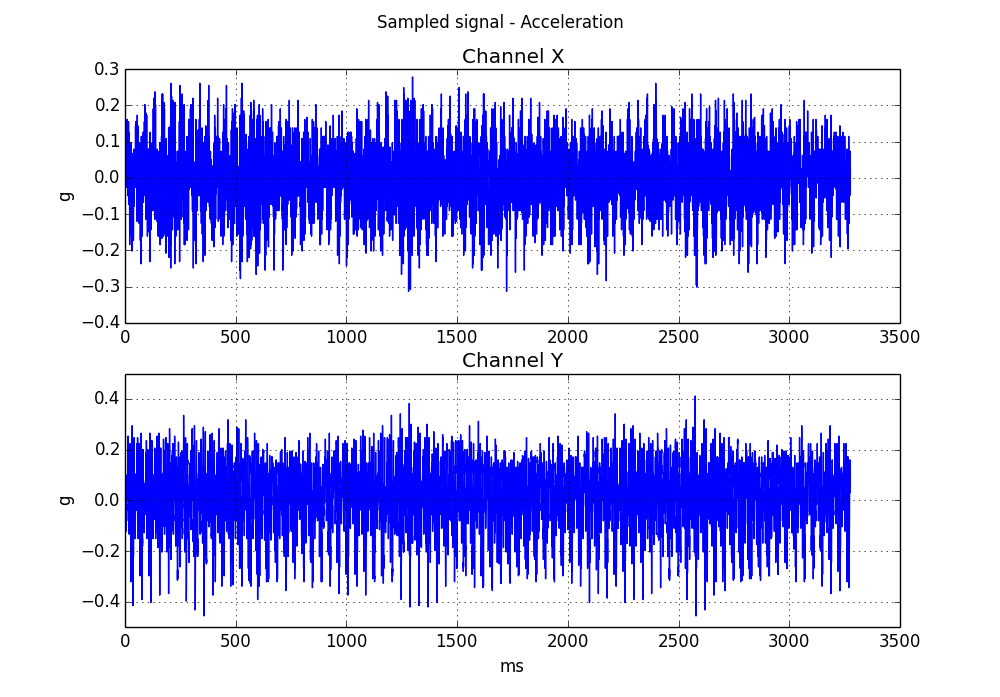
    The second test was taken adding weight to a certain place on the machine, for creating an imbalance. It can be clearly seen an increase in the magnitude of the acceleration, both in time domain and frequency domain.

    Finally, more weight was added to increase the imbalance and a third measurement was made. Again, an increase in the acceleration amplitude is observed.


    From the test results, it can be seen that the instrument can detect the imbalance variations, and seems to be working properly.

  • Software scaling correction

    Ariel Quezada06/07/2016 at 19:31 0 comments

    The original program was not properly scaled. The signals were plotted using the ADC values and the number of samples obtained.

    The signal size has been scaled to g. The ADXL335 has an output from -3g to +3g, for a voltage range from 0 to 3.3 V, that is converted by the ADC to values from 0 to 1023. The original signal is multiplied by 3.0/512, and then the DC offset is determined, taking the average of all the readings. This approach assumes that the average value of the vibration signal is 0.

    A correction to the time scale has also been done, considering the sampling rate and the number of samples taken. Frequency range has been limited to 1500 Hz, the maximum frequency that the ADXL335 con provide on the X and Y axes.

    The corrected program is acel_file_plot_03.py, and the resulting plots are now properly scaled.

  • Accelerometer probe construction

    Ariel Quezada06/07/2016 at 14:03 0 comments

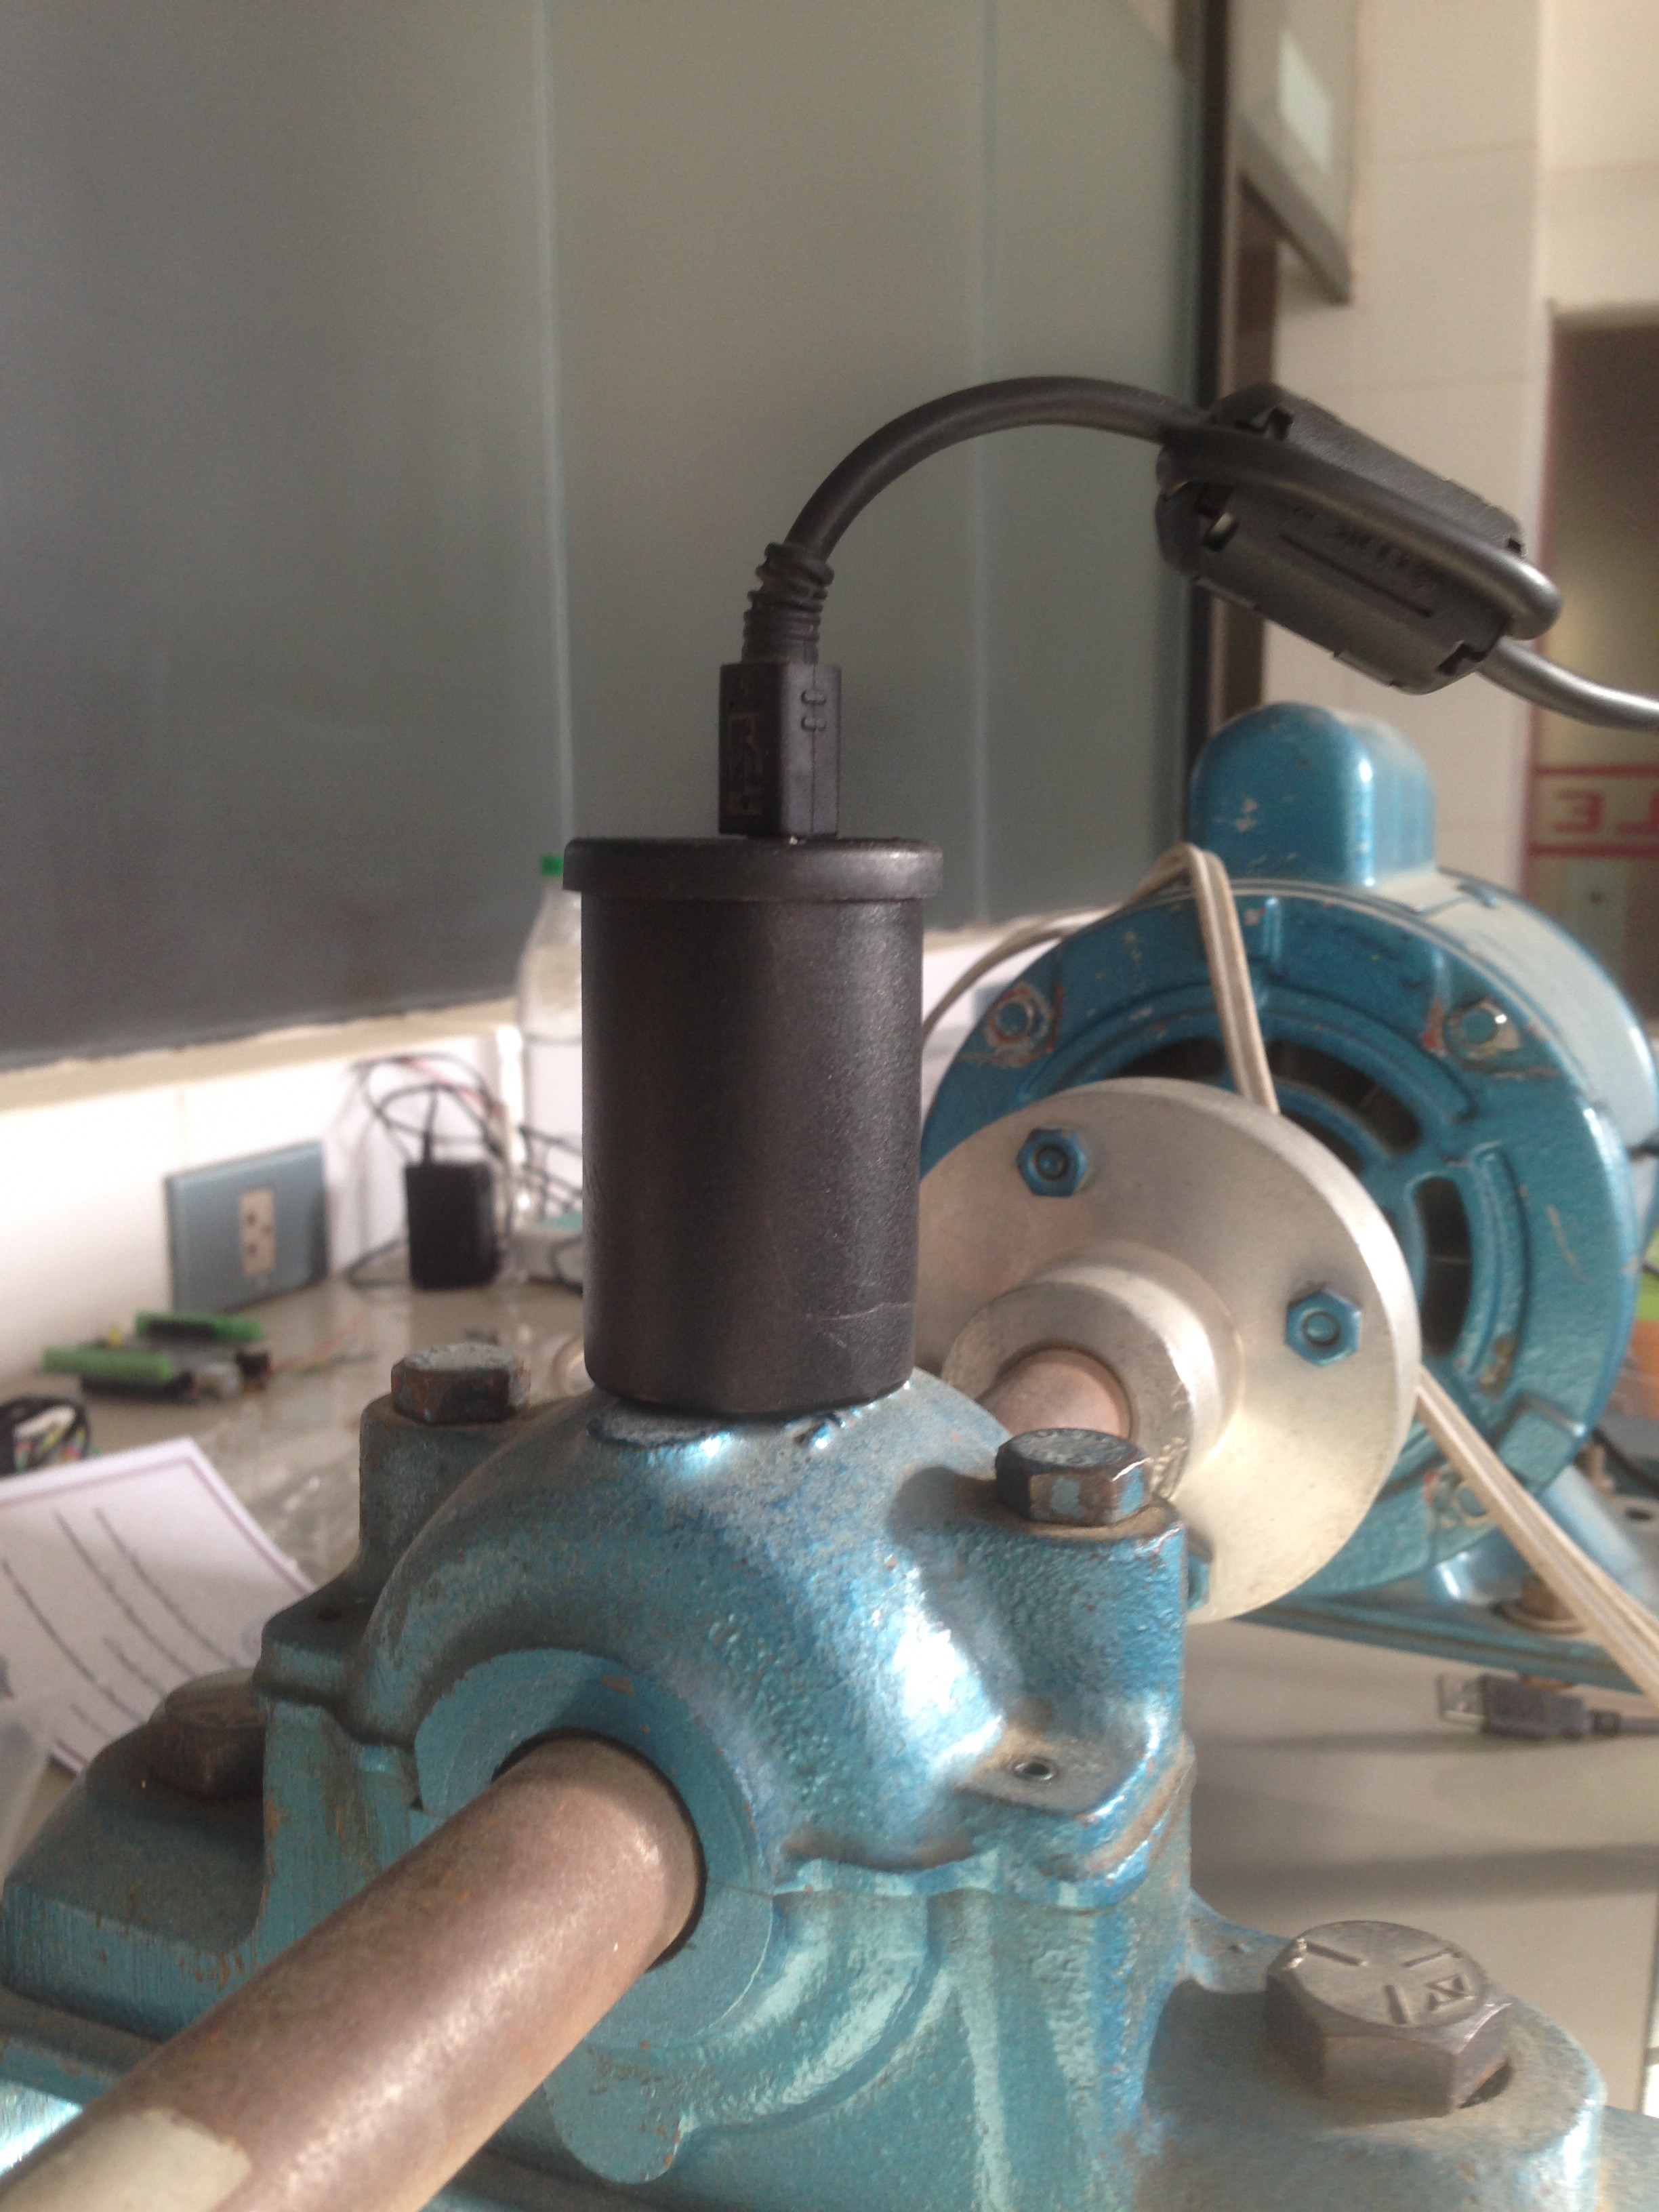
    The accelerometer and the Arduino Nano fit together inside a plastic probe (camera film canister). A strong magnet is also included inside, so the probe can be attached very firmly to different parts of a rotating machine and measure its vibration.


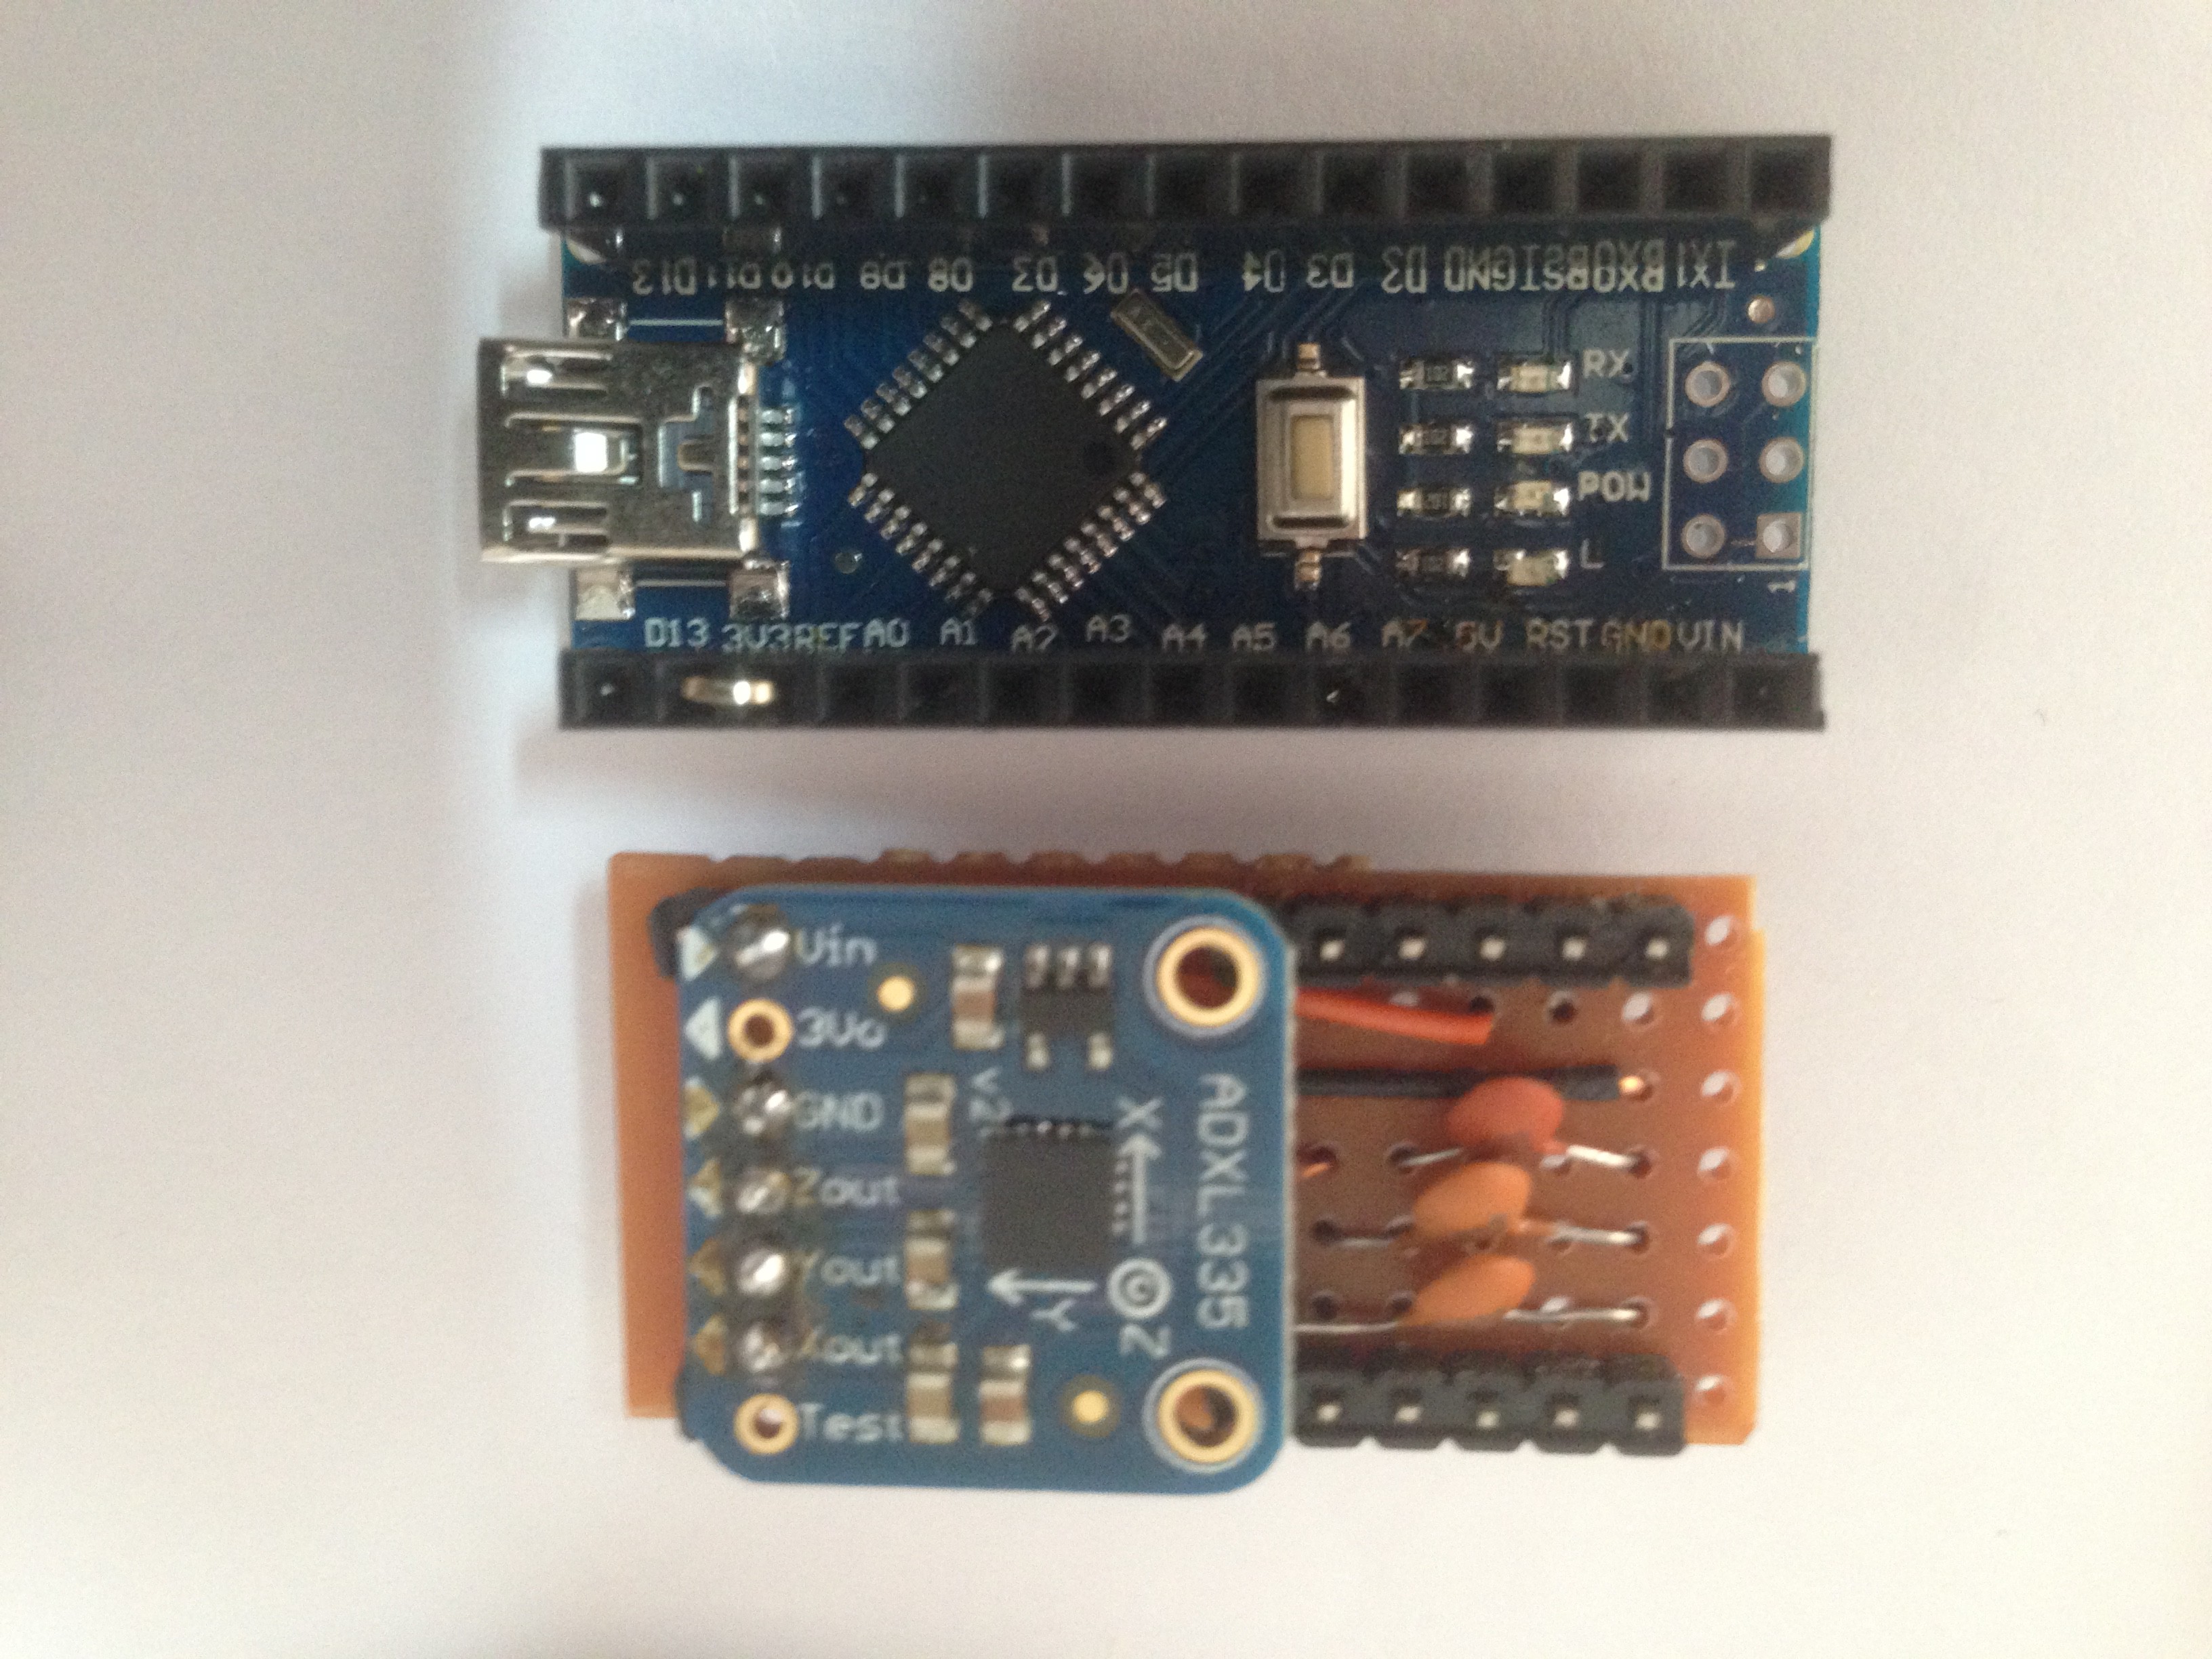
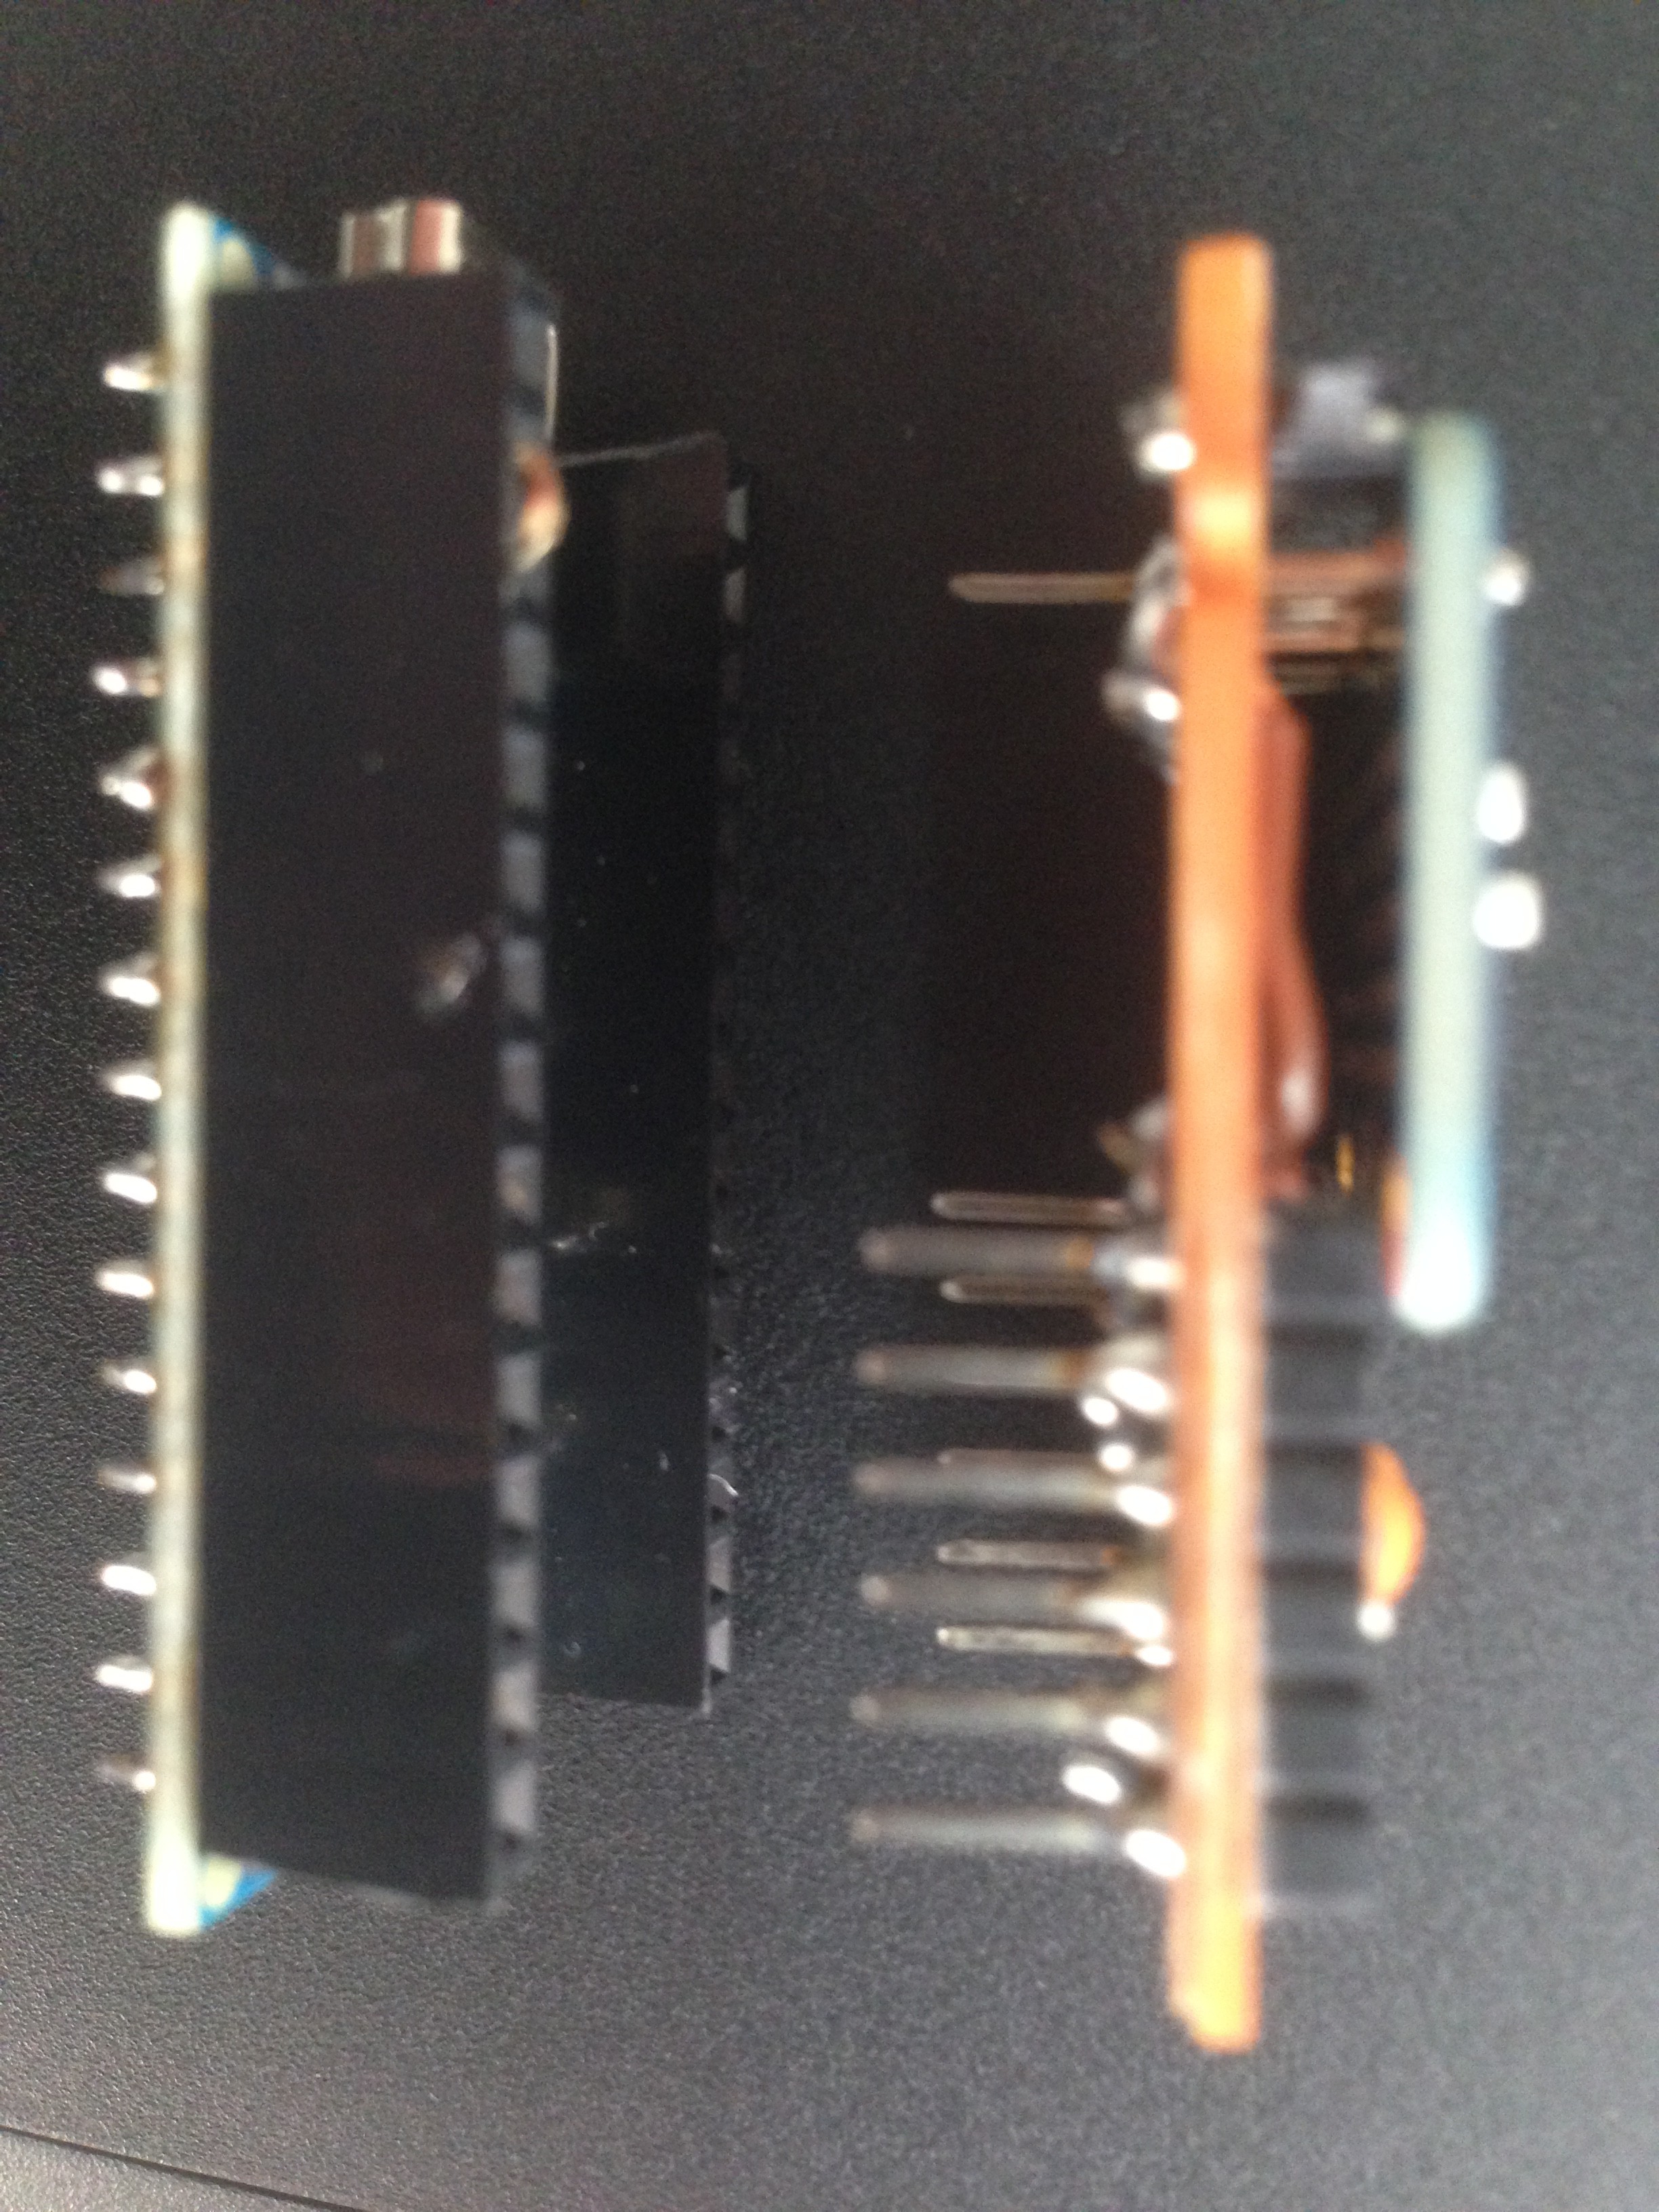
    The accelerometer breakout board is soldered to a perforated board and three capacitors are connected and soldered, one to every analog output form the ADXL335. Header pins are placed at the sides of the board and arranged so this pins fit inside single line sockets soldered on the Arduino Nano, instead of the regular connector headers.


View all 8 project logs

Enjoy this project?

Share

Discussions

Jaime Chaparro wrote 11/09/2016 at 15:18 point

Hi, this is a very useful industrial application, I'm very interested in replicate it by myself! But, is any practical improvement (sensibility, range, etc.) in changing the adxl335 for the "new" adxl345 or even for a piezoelectric vibration sensor? thanks!

  Are you sure? yes | no

Ariel Quezada wrote 01/09/2017 at 12:42 point

Hi, I don't know why I missed your message, very sorry. I think the adxl345 is a good replacement, and you can select between many sensitivities. 2g to 16g. Interfacing shoud also be easier, no badwith limiting capacitors nor sampling needed. Also the lowest resolution seems to be 10 bits, that is the same in the atMega328 ADC. A piezo sensor should work fine, but maybe you would need some extra signal conditioning.

  Are you sure? yes | no

edward wrote 08/18/2016 at 16:31 point

con la señal FFT que conclusión llegó?  pudo determinar algún tipo de falla, quizás pudo concluir errores en el motor por fallas de desbalanceo, desalineamiento, rodamientos,etc. Con este acelerómetro y en esa posición que tipo de fallas se pueden detectar. 

  Are you sure? yes | no

Ariel Quezada wrote 08/18/2016 at 19:27 point

En el LOG número 3 (Some Testing), se muestra el resultado de hacer un desbalanceo en un equipo de prueba. Se muestra el espectro sin el desbalance, y luego dos espectros, con distinto desbalance. Se observa claramente que el pico en la frecuencia de operación del equipo (24.17 Hz o 1450 rpm) se incrementa con el desbalanceo. Los otros picos en múltiplos de 24.17 Hz muestran que el equipo está desalineado. Los archivos datos_08-06-2016__13_34_50.txt, datos_08-06-2016__13_37_26.txt y datos_08-06-2016__13_45_09.txt corresponden a estas mediciones.

  Are you sure? yes | no

edward wrote 08/11/2016 at 03:01 point

Hola

buen tutorial "An FFT spectrum analyzer for machinery vibration
analysis, using open source hardware and software", quisiera saber como hizo para colocar el
acelerómetro al  cable(donde lo puedo conseguir?¿Qué tipo de
cable es?) , ¿Tiene algún tutorial de la construcción del
empotrado del acelerómetro al cable?,ese pequeño circuito de condensadores me imagino
que es son filtros, es correcto?, de que valores son los condensadores, tiene
un diagrama?,¿Cómo lo puedo comprarlo o hacerlo?. Gracias.

  Are you sure? yes | no

Ariel Quezada wrote 08/11/2016 at 12:23 point

Hola edward, en la página del proyecto hay una galería de imágenes, y ahí puedes encontrar el diagrama esquemático de la conexión entre el Arduino y el acelerómetro. Todo el sistema entra en un antiguo envase de rollo de película fotográfica, y el cable es solamente un cable USB mini para conectar al puerto USB del Arduino Nano.

Los capacitores se utilizan como filtros paso bajo, para limitar el ancho de banda de la señal antes de digitalizarla. Los valores están en el equemático y corresponden a una frecuencia de 1500 Hz para los canales X e Y.

El acelerómetro está en una placa 'break out', y se consigue en ebay (http://www.ebay.com/itm/ADXL335-3-axis-Analog-Output-Accelerometer-Module-angular-transducer-for-Arduino-/400985206886?hash=item5d5c94b066:g:ZokAAOSwq5lTmAS9) o en Adafruit (https://www.adafruit.com/product/163).

Los capacitores van en una placa inermedia, que sirve de enlace entre el módulo del acelerómetro y el Arduino.

Saludos.

  Are you sure? yes | no

edward wrote 08/10/2016 at 17:37 point

for this type of non-stationary signals, it is not better to use an ARM or FPGA or DSP?


Why you prefer to use Arduino?

  Are you sure? yes | no

Ariel Quezada wrote 08/10/2016 at 21:19 point

The microcontroller is used only for data acquisition. The signal processing (FFT and windows) is done by the PC program. I chose the Arduino Nano because of its avalilability and its size.

  Are you sure? yes | no

edward wrote 08/11/2016 at 02:16 point

El adc de arduino es limitado(número de bits ) para la adquisición de datos. Usando un adc paralelo de 10 bit(ad9215) te ayudaría a mejorar la calidad de data almacenada.

  Are you sure? yes | no

Ariel Quezada wrote 08/11/2016 at 12:28 point

Una de mis opciones es usar una placa con STM32F103C8T6 (http://www.ebay.com/itm/1pcs-STM32F103C8T6-ARM-STM32-Minimum-System-Development-Board-Module-Arduino-/201414966215?hash=item2ee5447bc7:g:X-oAAOSw6BtVVACk), que además de un procesador  ARM tiene un puerto USB y dos canales paralelos de 12 bits, y es muy económico, pero es un poco más grande que el Arduino Nano, y no cabe en el envase que tengo disponible. Sin tomar en cuenta el tema del envase, este micro es una mejor opción.

  Are you sure? yes | no

Bob Hannent wrote 07/08/2016 at 07:47 point

I really like this, I've often wondered if such an analysis would be beneficial in domestic cars. Given the low cost of the components it must be getting closer to a time when such analysis is practical for every day mechanics, the issue then becomes the interpretation rather than the tools.

  Are you sure? yes | no

Similar Projects

Does this project spark your interest?

Become a member to follow this project and never miss any updates