Because I was unable to detect a chlorophyll fluorescence signal last week from the water I sampled from a local lake I decided to try and extract chlorophyll from some leaves to do some testing. I picked some lettuce from my garden and cut it up with scissors and ground the leaves in rubbing alcohol with a mortar and pestle to break down the tissue I filtered the ground up leaves into a vial to remove any solid tissue.
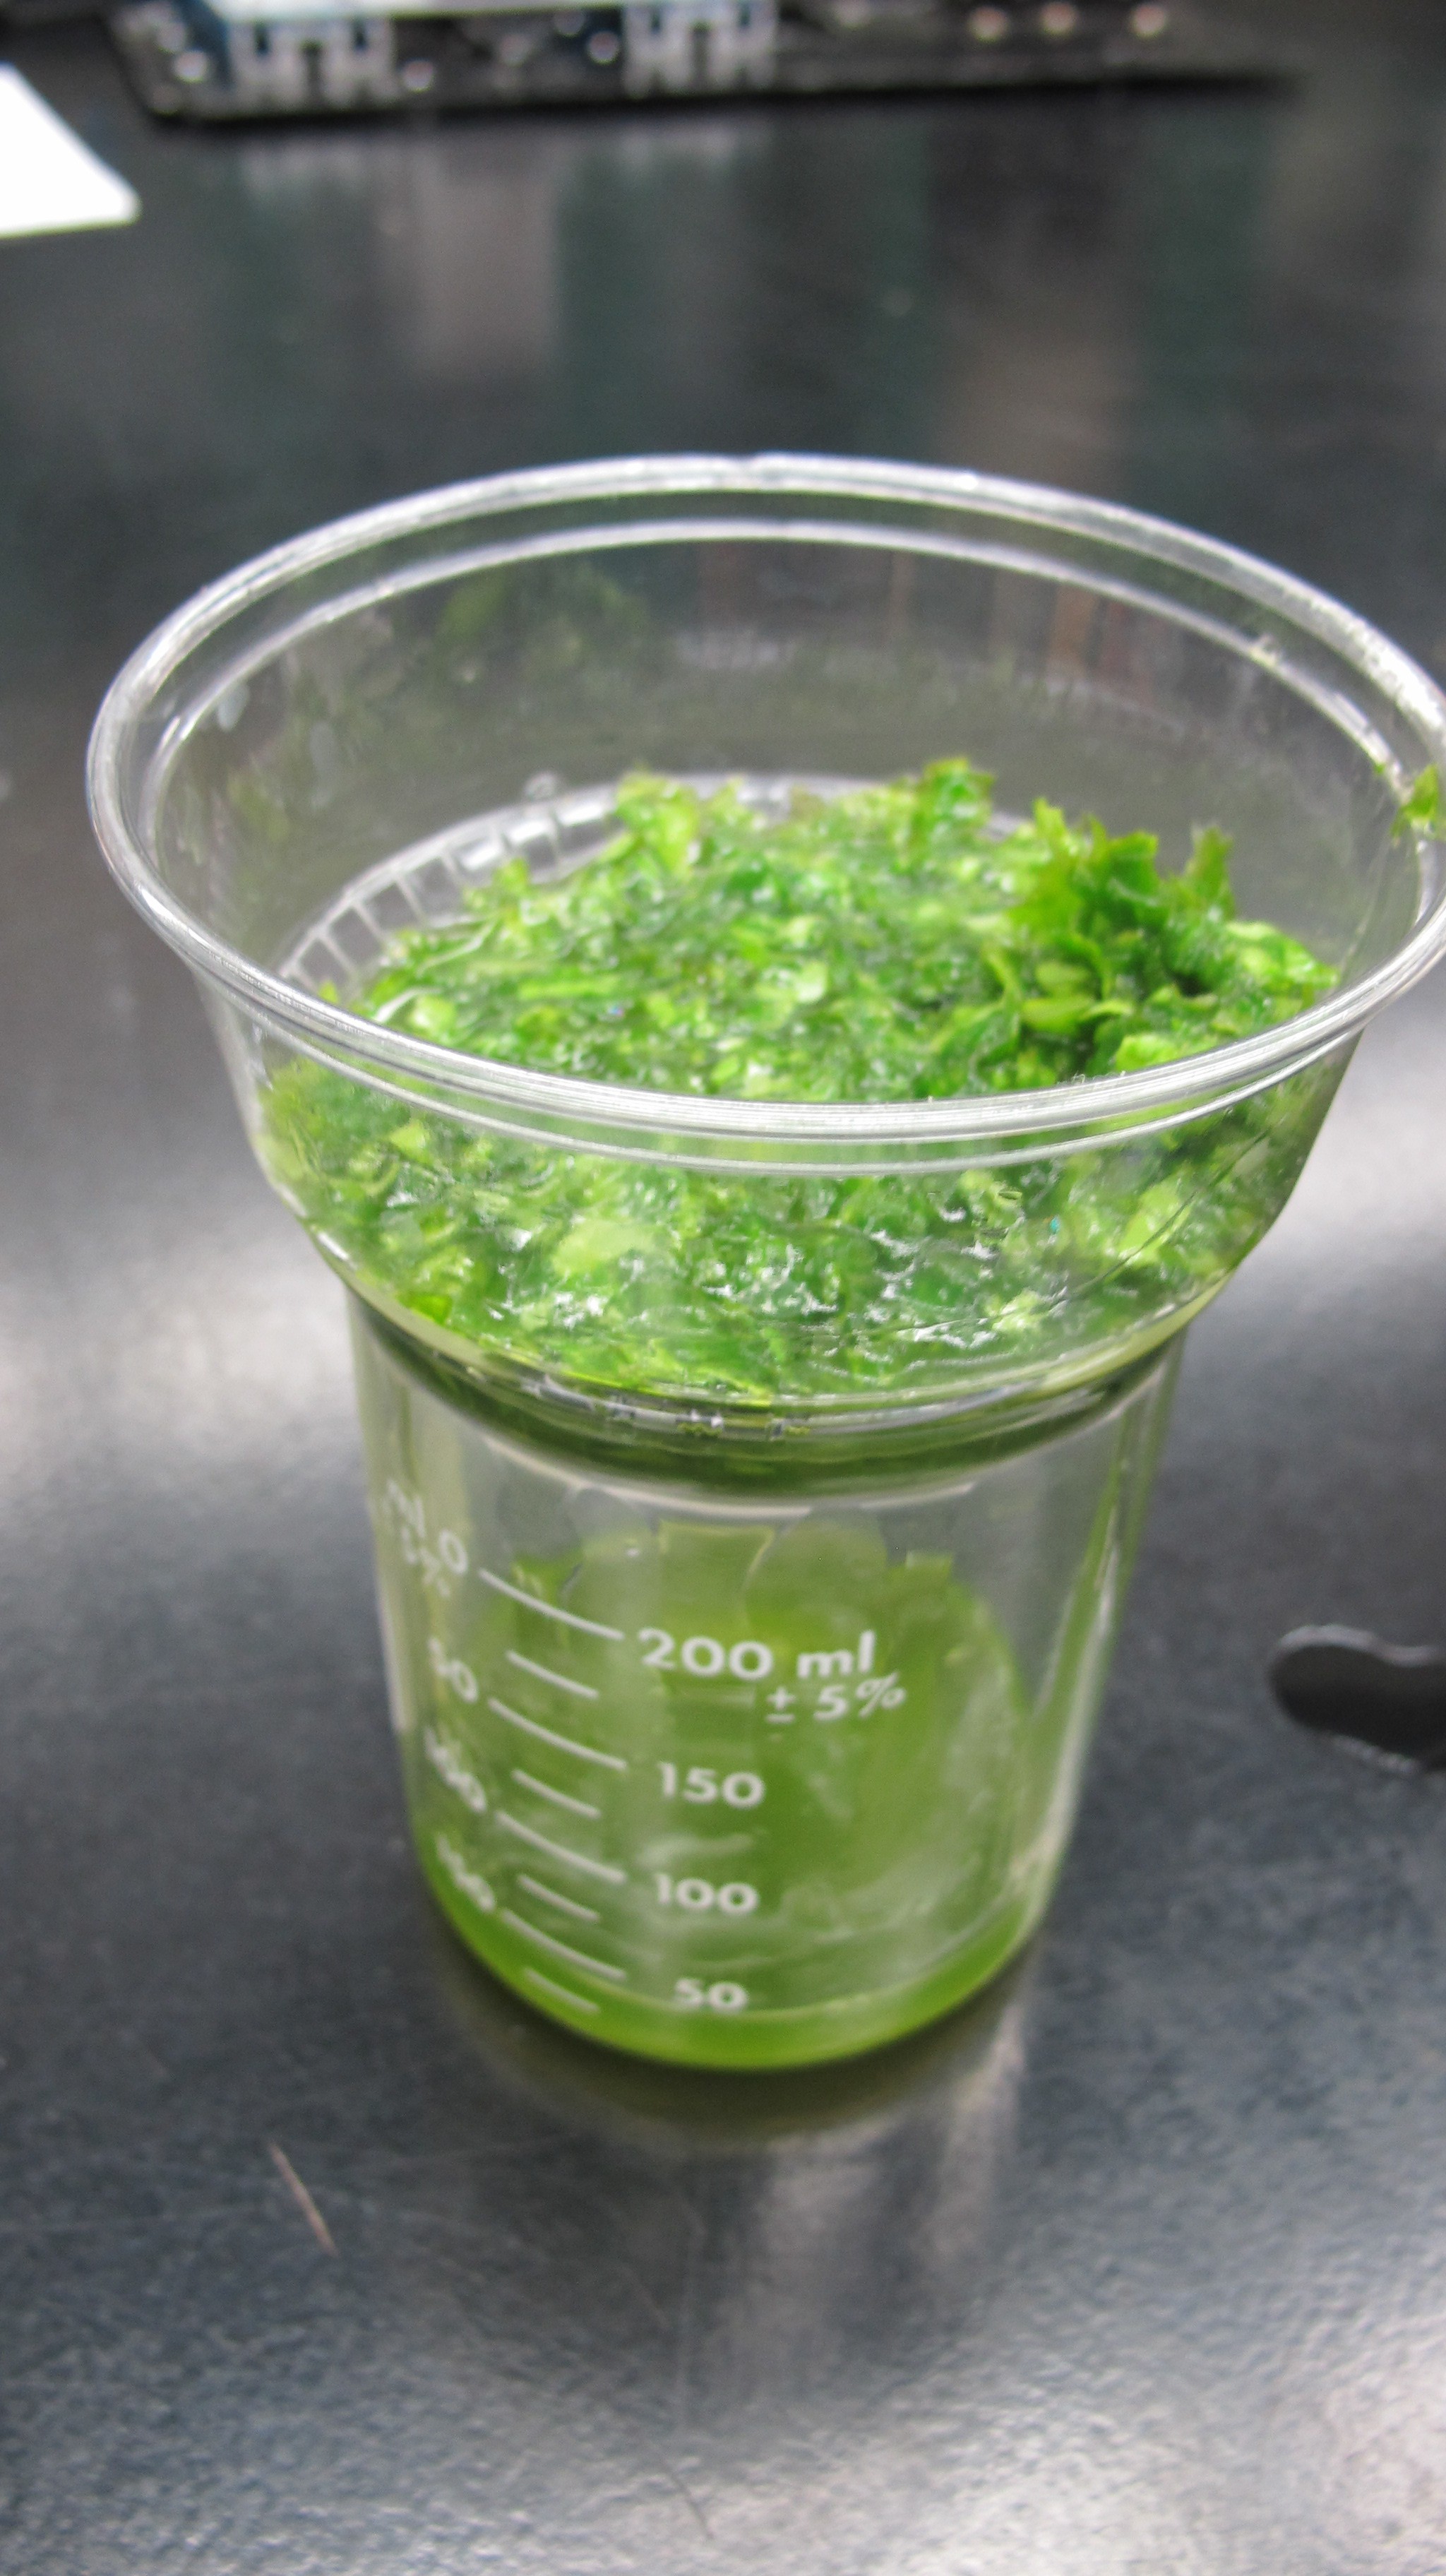
a minute, I then let the vial sit for about 10min in a fridge to let the rest of the tissue settle out.
Not only did I want to measure fluorescence but I also wanted to see how the fluorescence signal varied with different concentrations of chlorophyll. An important feature of the profiler is the ability to relate fluorescence magnitude to chlorophyll concentration. Because I did not know the true concentration of chlorophyll I made measurements on different relative concentrations by filling equally sized vials with between 1-5mL of chlorophyll extract and filling the rest of the vials with water.
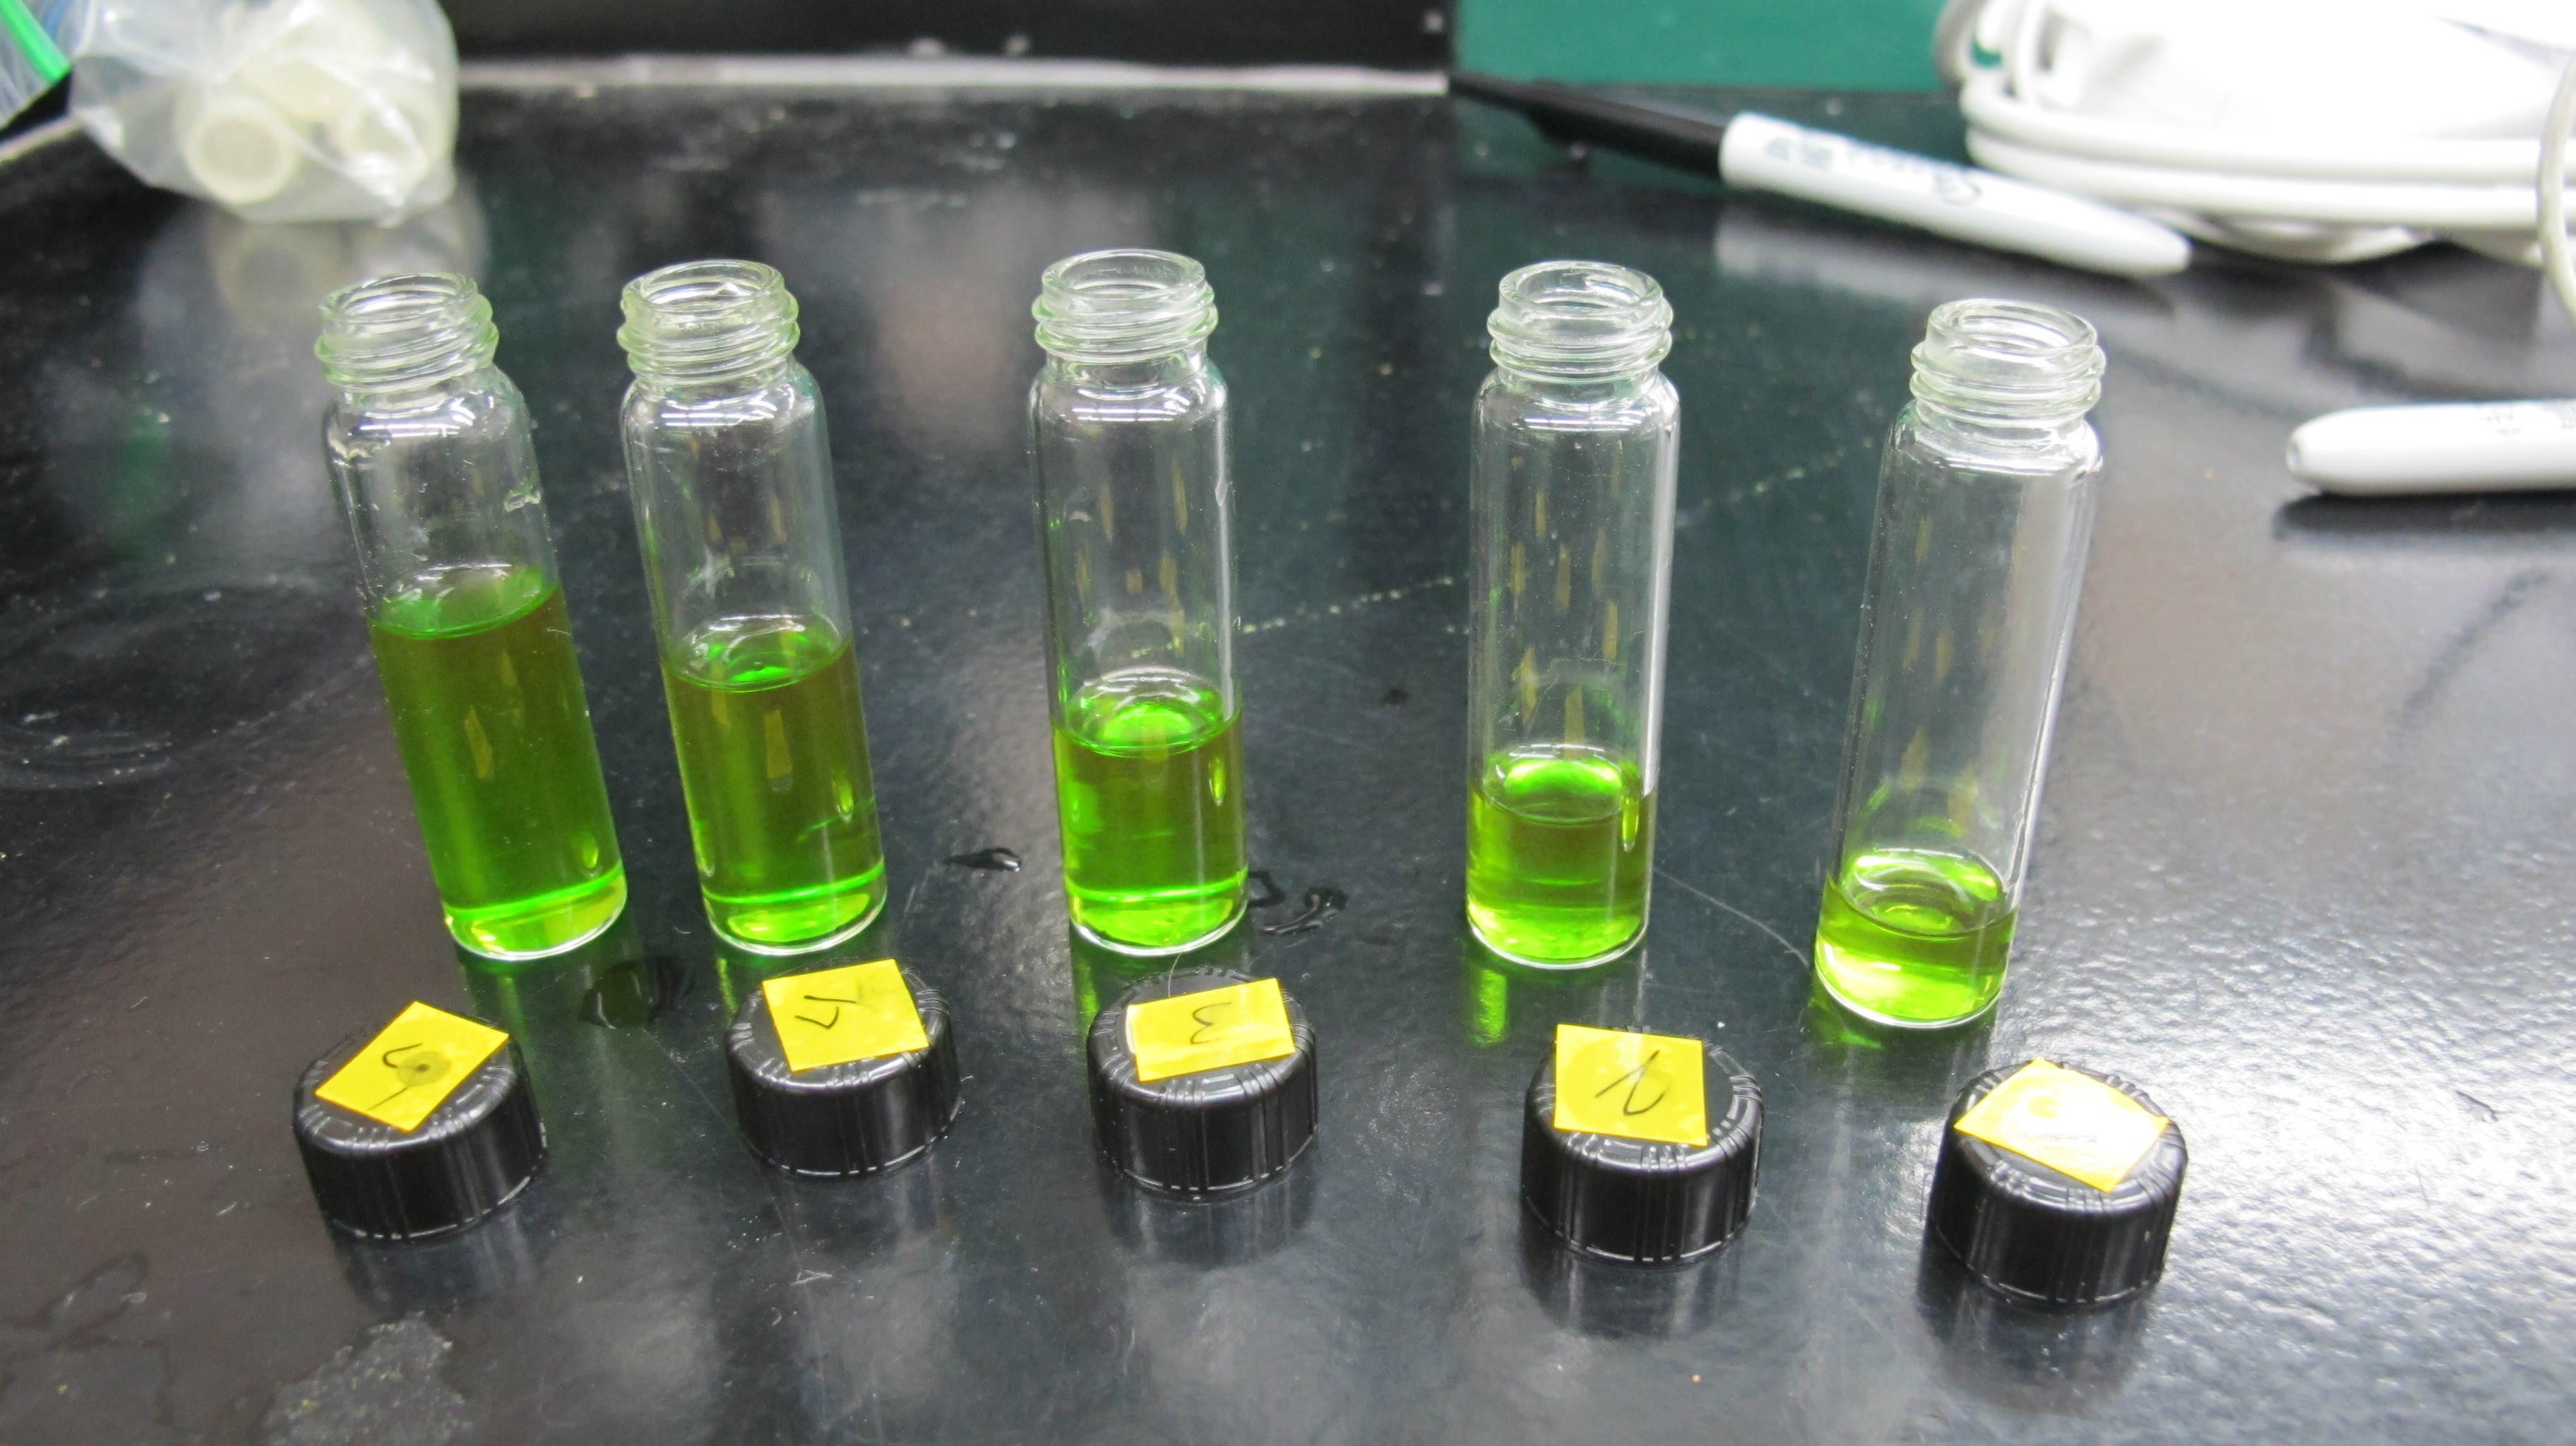 "Pure" chlorophyll extract

Diluted chlorophyll extract
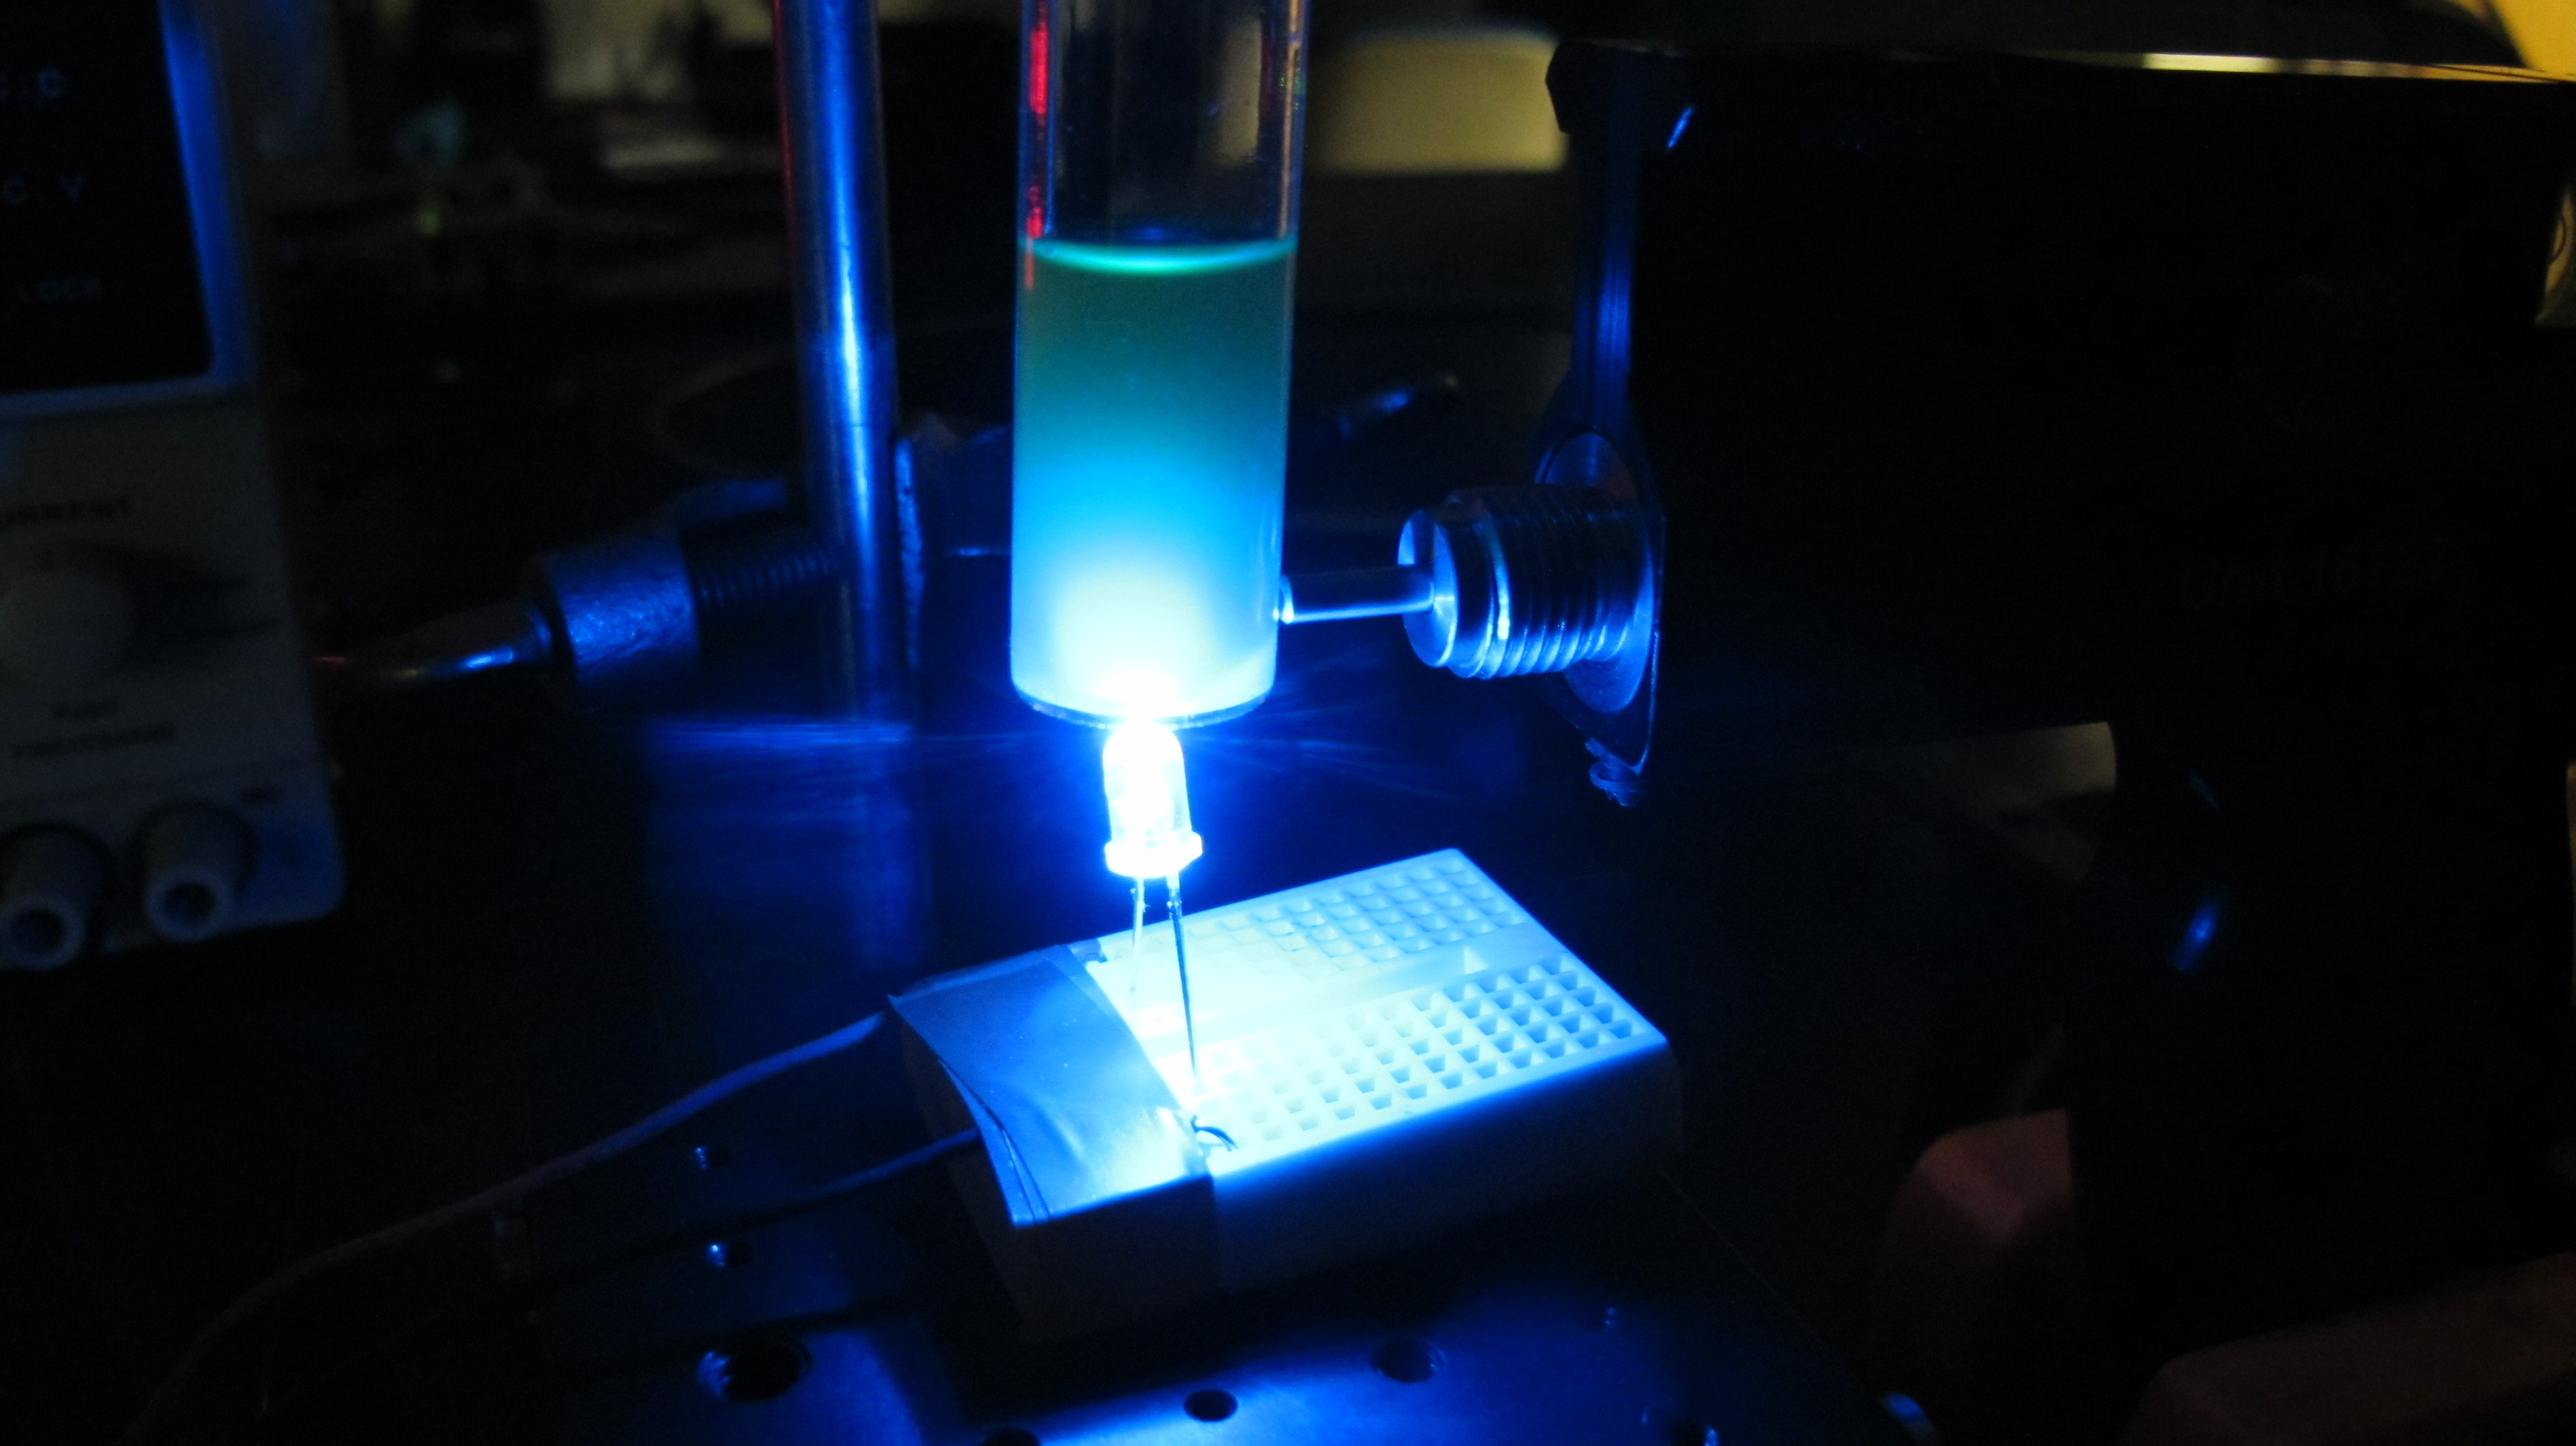
I used a similar set up as last week to illuminate the vials with 470nm LED and measure the water leaving signal using a spectrometer.
The figure below shows the results. As you can see with increased concentration of chlorophyll extract the fluorescence signal also increases.
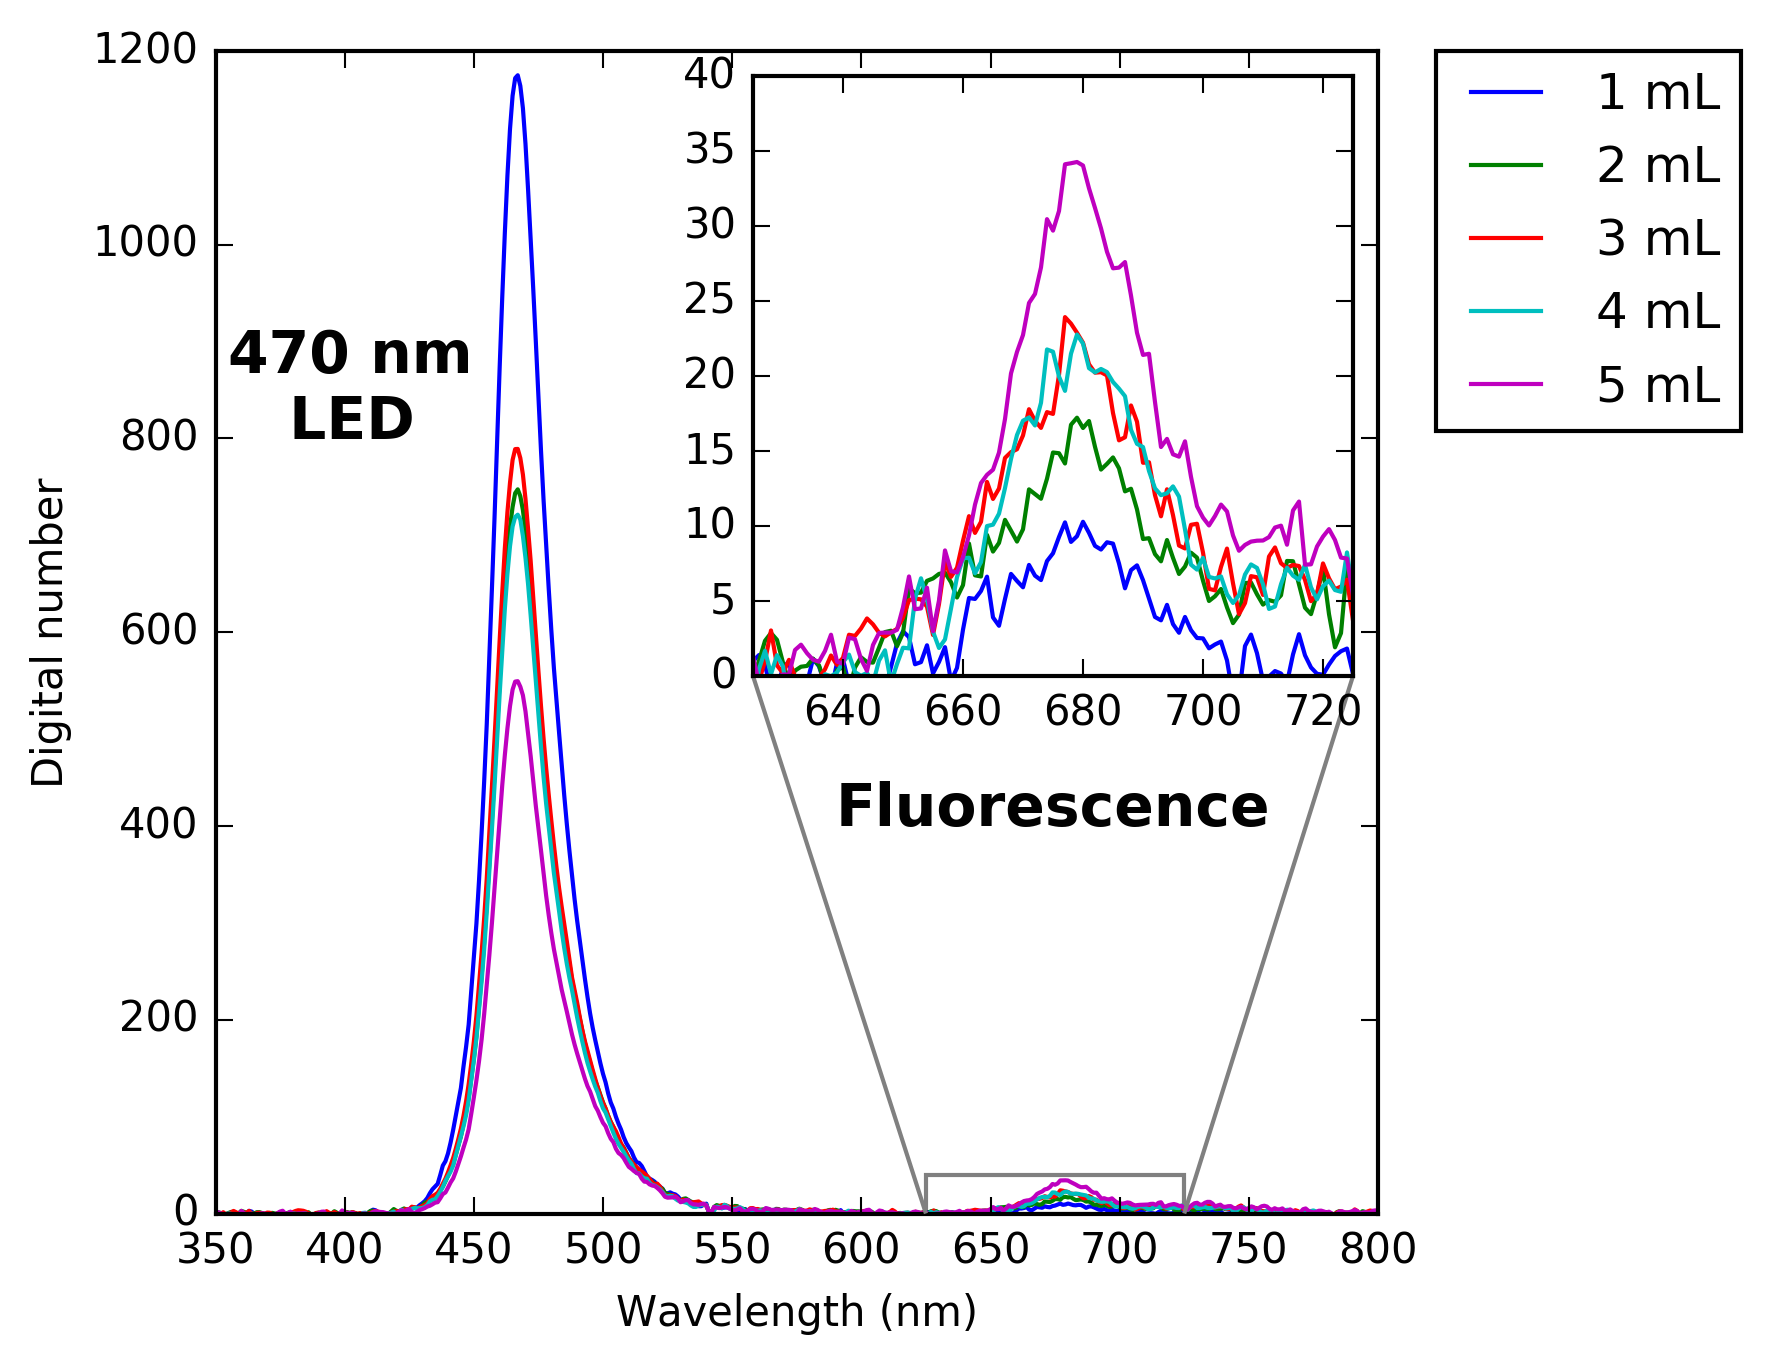
What this shows is that the LED is able to induce fluorescence and that the signal can be measured with a spectrometer, however the true test is whether the signal can be measured using a broadband photodiode.
In order to measure the fluorescence signal using a photodiode I needed to block out the light emitted by the LED. I used a cheap Roscolux filter to block out any light with wavelength a less than ~620nm as was done by Leeuw et al. 2016 in their fluorometer.
They used a # 19 filter in their design while I used the # 25 filter as it has a slightly high cutoff, which is important because the photodiode I am using has a higher emission peak than theirs (470 vs 420nm).
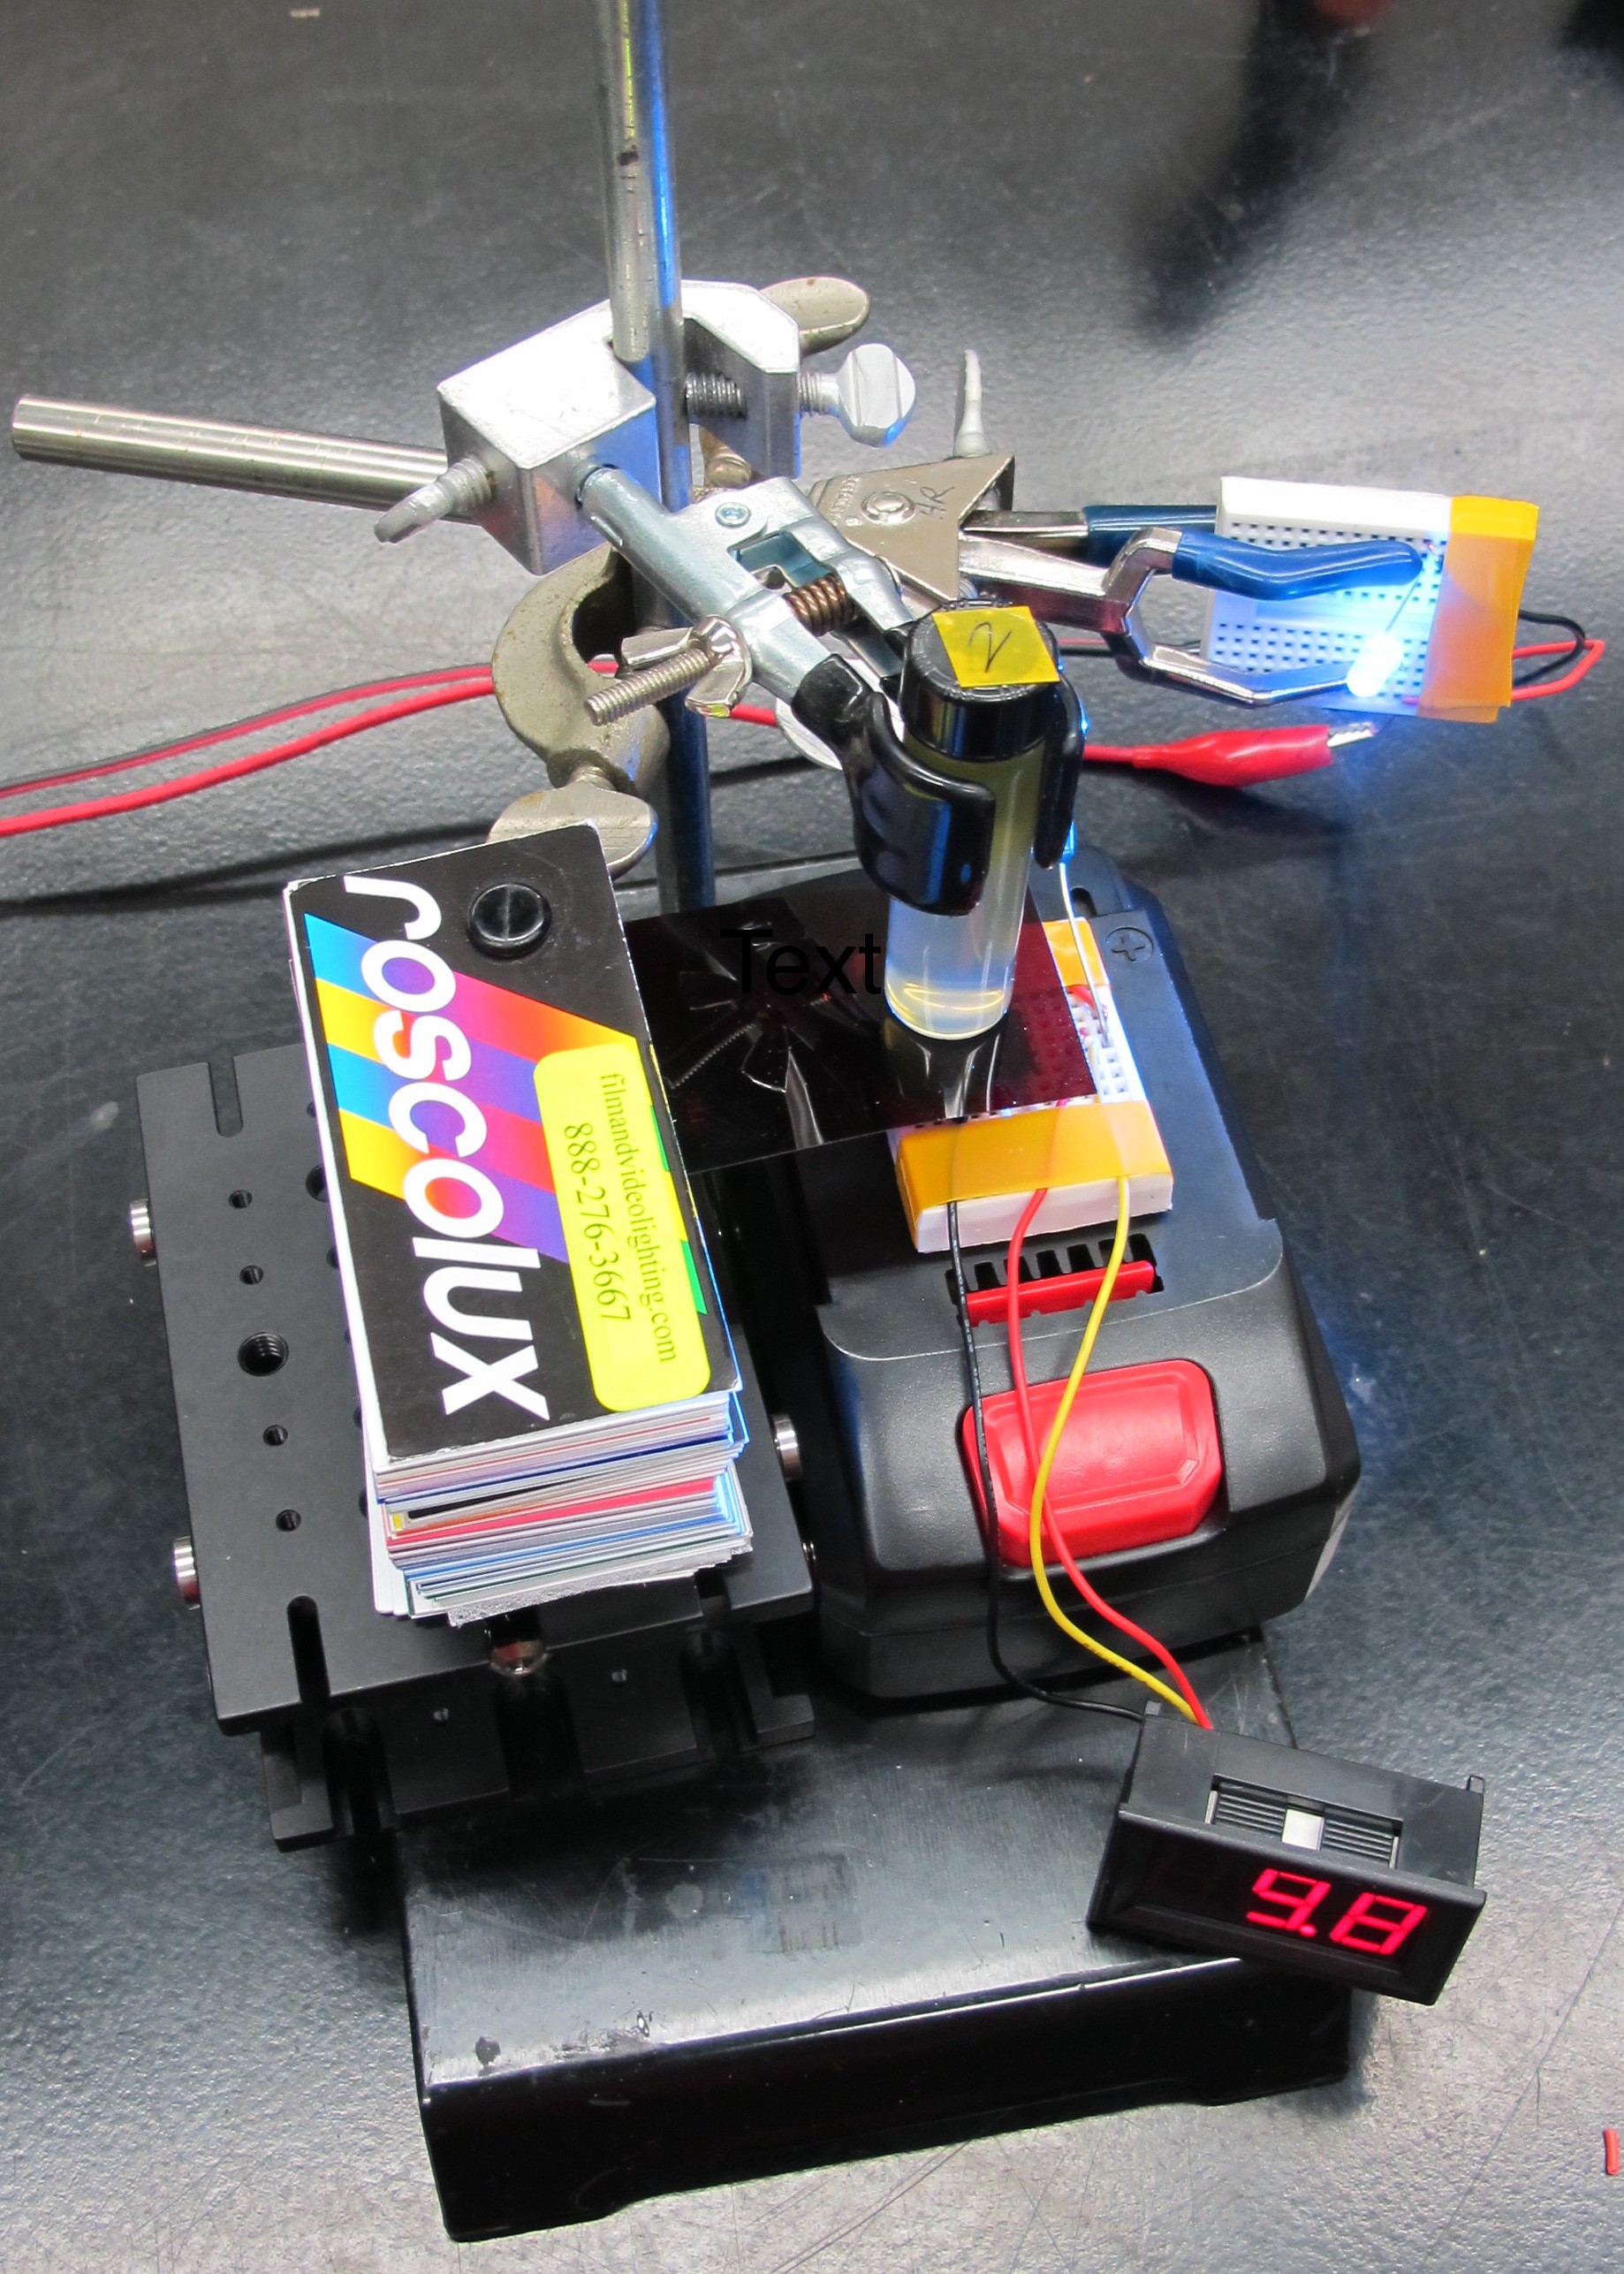
The graphs below show the results of the photodiode fluorescence measurements.
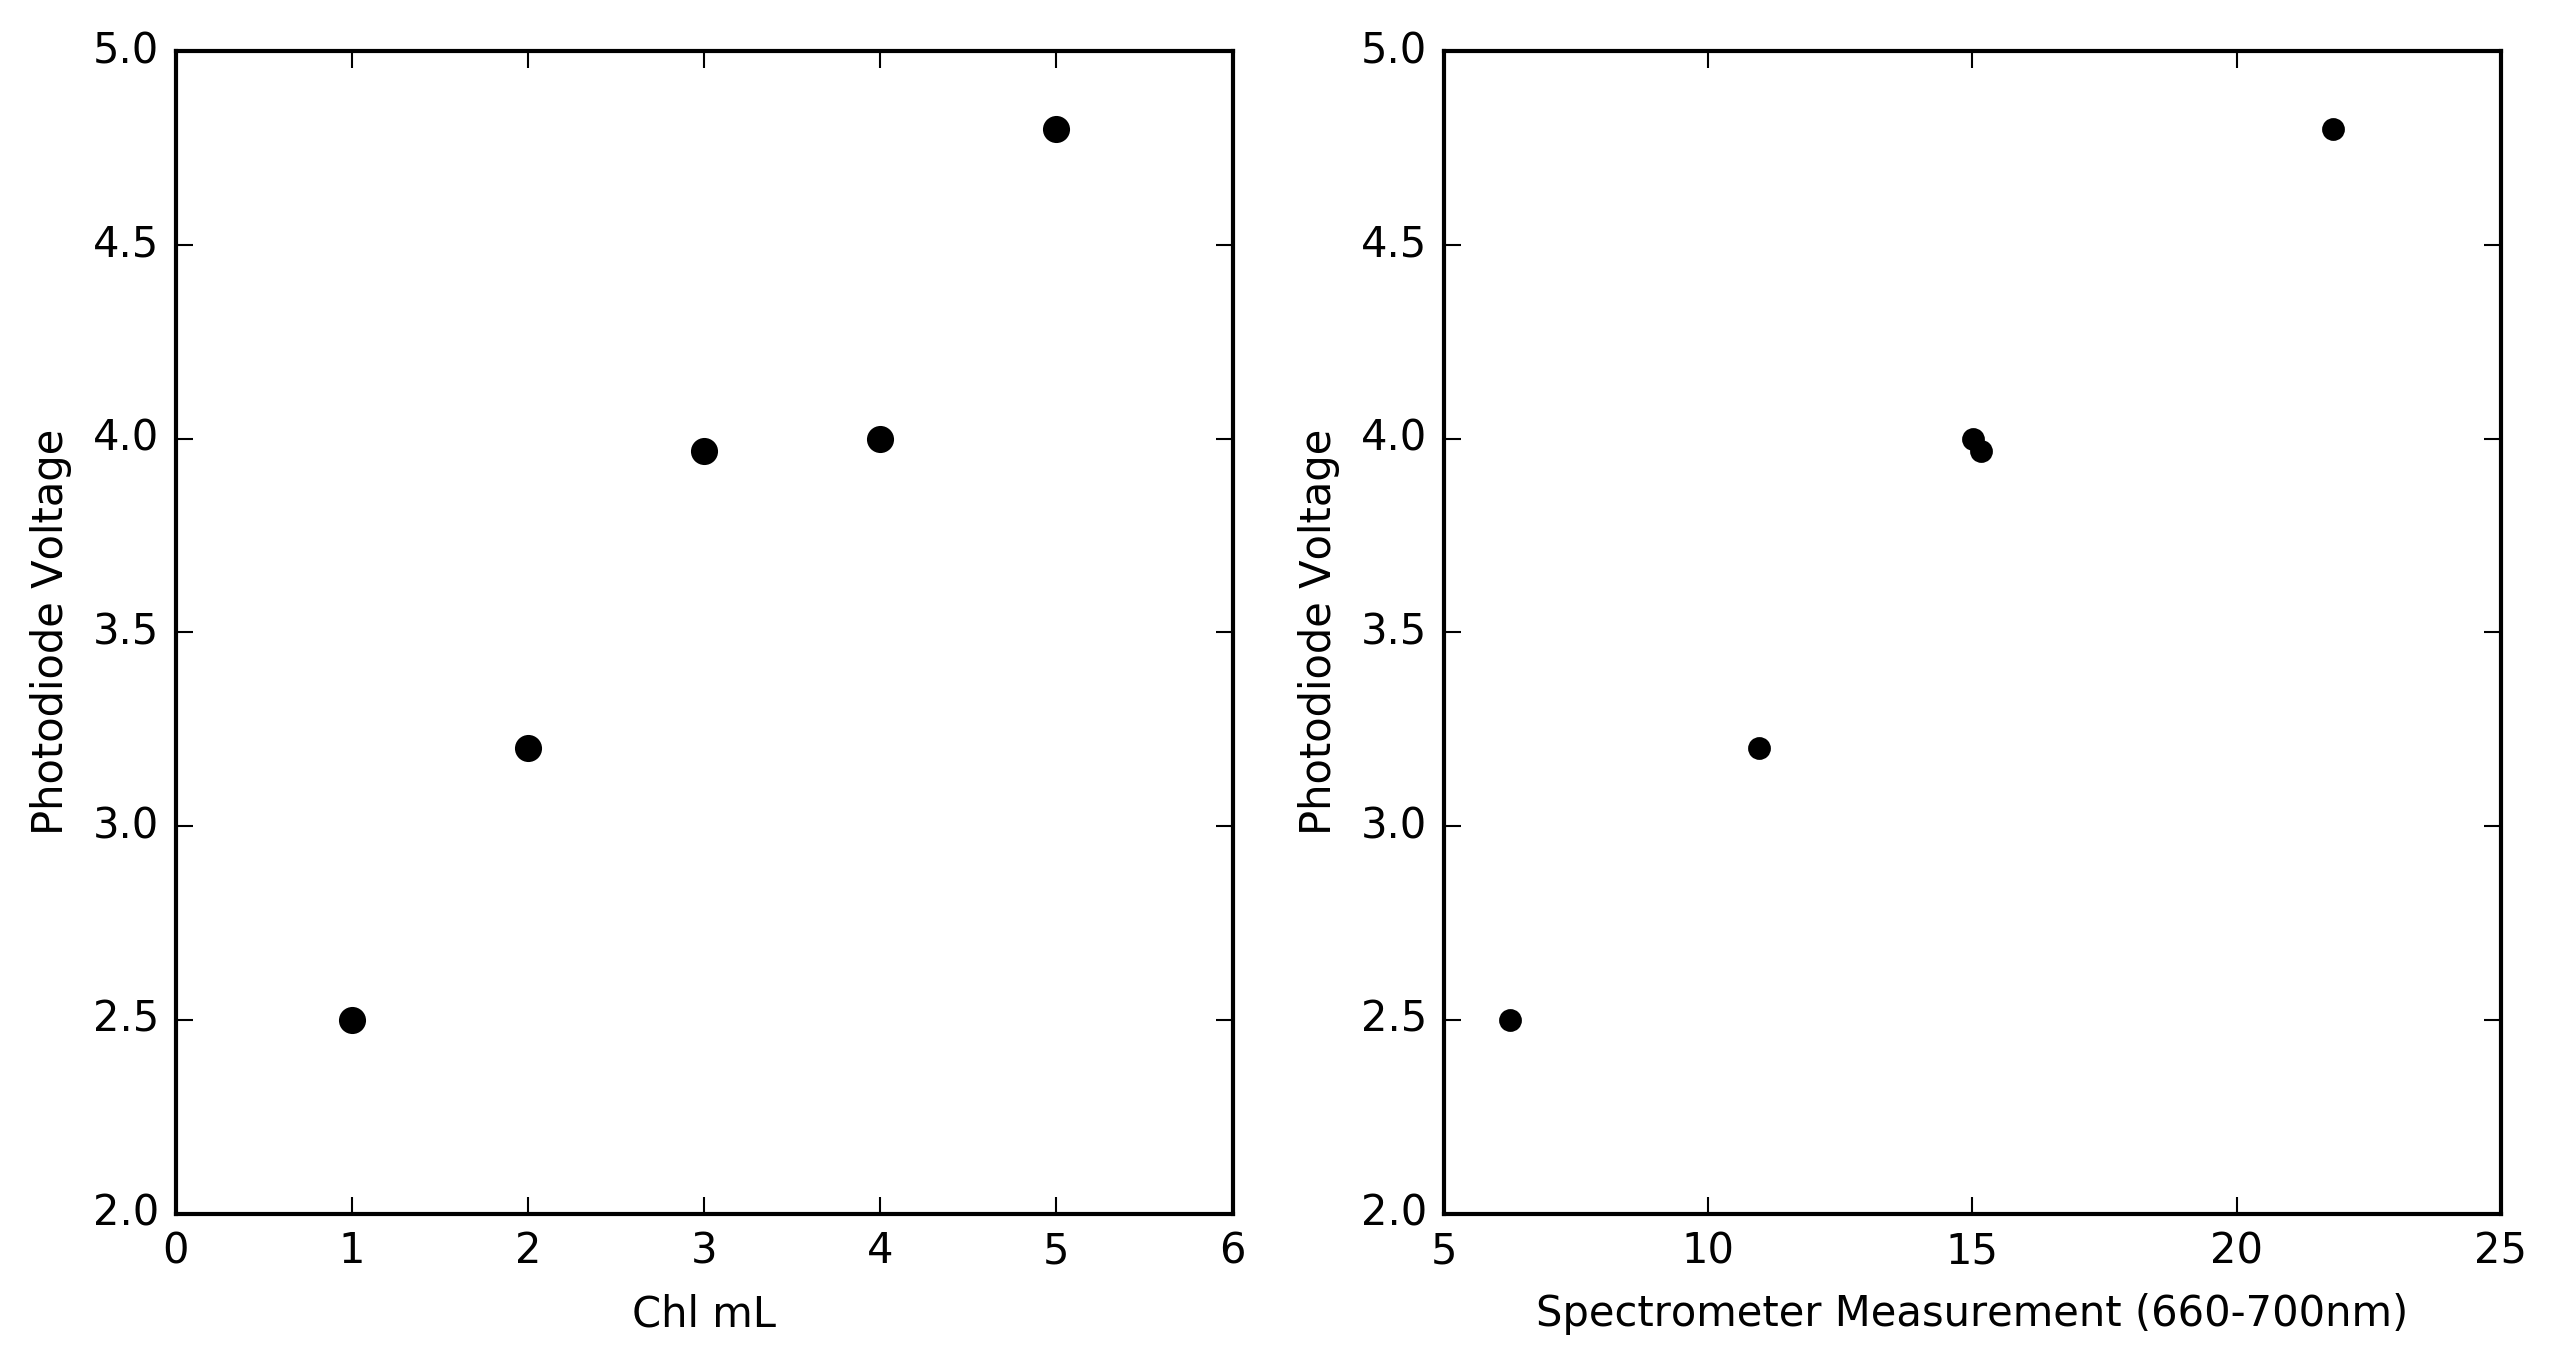
The graph on the left show the relationship between chlorophyll concentration and voltage from the op-amp circuit. With increasing concentration of extract the fluorescence signal measured by the photodiode increases. However there is an anomaly for the measurement of the 4mL vial where the measured value is not greater than the 3mL vial as would be expected. This was also seen in the measurements made by the spectrometer which leads me to believe that the measurements from both are correct and that when I prepared the vials I made an error. Regardless whats nice is that the measurements from the photodiode are highly correlated to the measurements of the fluorescence signal made by the spectrometer (right graph).
References
Leeuw, T.; Boss, E.S.; Wright, D.L. In situ Measurements of Phytoplankton Fluorescence Using Low Cost Electronics. Sensors 2013, 13, 7872-7883.
Discussions
Become a Hackaday.io Member
Create an account to leave a comment. Already have an account? Log In.