I though it would be worth making a short log on writing the code to visualise the data. Please note that I have not yet linked it with the sensors. The visualisation below was made in Processing using random perlin noise for the development.
The trick here is to interpolate the readings between each sensors. In order to rationalise the problem we must first decide to what level of accuracy we want to be making the calculations. In this example this was done on the scale of one pixel, meaning that for every pixel we calculate the its colour relative to the strongest force. To re-iterate, if the force from the closest sensor for any given pixel is lesser than the second closest sensor then we ignore the latter and register the former.
Now we've covered the basic logic we must create a function that will give us the gradient we're looking for. The following code will only work as expected if you've already carried out the calculations necessary for a linear force/resistance relationship.
// The distances for from every pixel to each sensor is calculated and stored in setup()
int [][][] distances = new int [sensor_Num] [mask.width] [mask.height]

// We need a temporary matrix to store the forces until we draw then
// Must be initialised
float [][] temp_matrix;

// A function which take the masks and returns the heatmap as a PImage
PImage dispHeat(PImage mask) {

  // Create and load the output image
  PImage pout = createImage(mask.width, mask.height, HSB);
  pout.loadPixels();

  // Save the max and min for final remap
  float max =-1 ;
  float min = 10^4; // Start with an arbitrary high value

  // Max force for any sensor in gr, obtained in calibration
  int max_force = 8354;

  for (int i = 0; i < sensor_csv.length; i++) { // For every sensor
    for (int  x = 0; x < pout.width; x ++ ) { // For every pixel in width
      for (int  y = 0; y < pout.height; y++ ) { // For every pixel in height


        if (mask.pixels[x+(mask.width*y)] == color(0, 0, 0)) { // If the pixel on the mask is back then proceed

          // Changing the exponent will change the sharpness of the gradient
          float pressure = map(pow(distances[i][x][y], 3), 0, pow(max_force, 3), 0.1, 0) * raw_sensor[i] ;


          if (pressure > temp_matrix[x][y]) { // If new pressure is greater than last then update
            temp_matrix[x][y] = pressure;
          }


          if (pressure > max) max = pressure; // Save max and min
          if (pressure < min) min = pressure;
        }
      }
    }
  }


  heatmap.loadPixels();


  for (int i = 0; i < pout.width*pout.height; i++) {


    int x = i%pout.width; // Find XY coordinate
    int y = i/pout.width;


    if (mask.pixels[x+(mask.width*y)] == color(0, 0, 0)) { // If the pixel on the mask is back
      float col = map(temp_matrix[x][y], min, max, 180, 0); // Then draw the result
      pout.pixels[i] = color(col, 255, 255);
    }
  }
  pout.updatePixels();

  return pout;
}
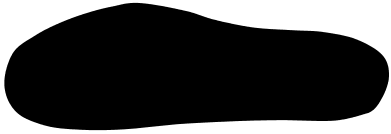
Mask used as the input to the function

On my macbook air 1.6 GHz Intel Core i5, 4 GB DDR3 the program runs at 20fps which isn't surprising considering it's iterating through 40,000 pixels every cycle. However as we won't be visualising the data at the same time as recording it, it won't be a problem for the final sample rate.
There's a lot more to say about the software but I'll keep that for a future log once I've stream lined the process.
 Charles Fried
Discussions
Become a Hackaday.io Member
Create an account to leave a comment. Already have an account? Log In.