 David H Haffner Sr
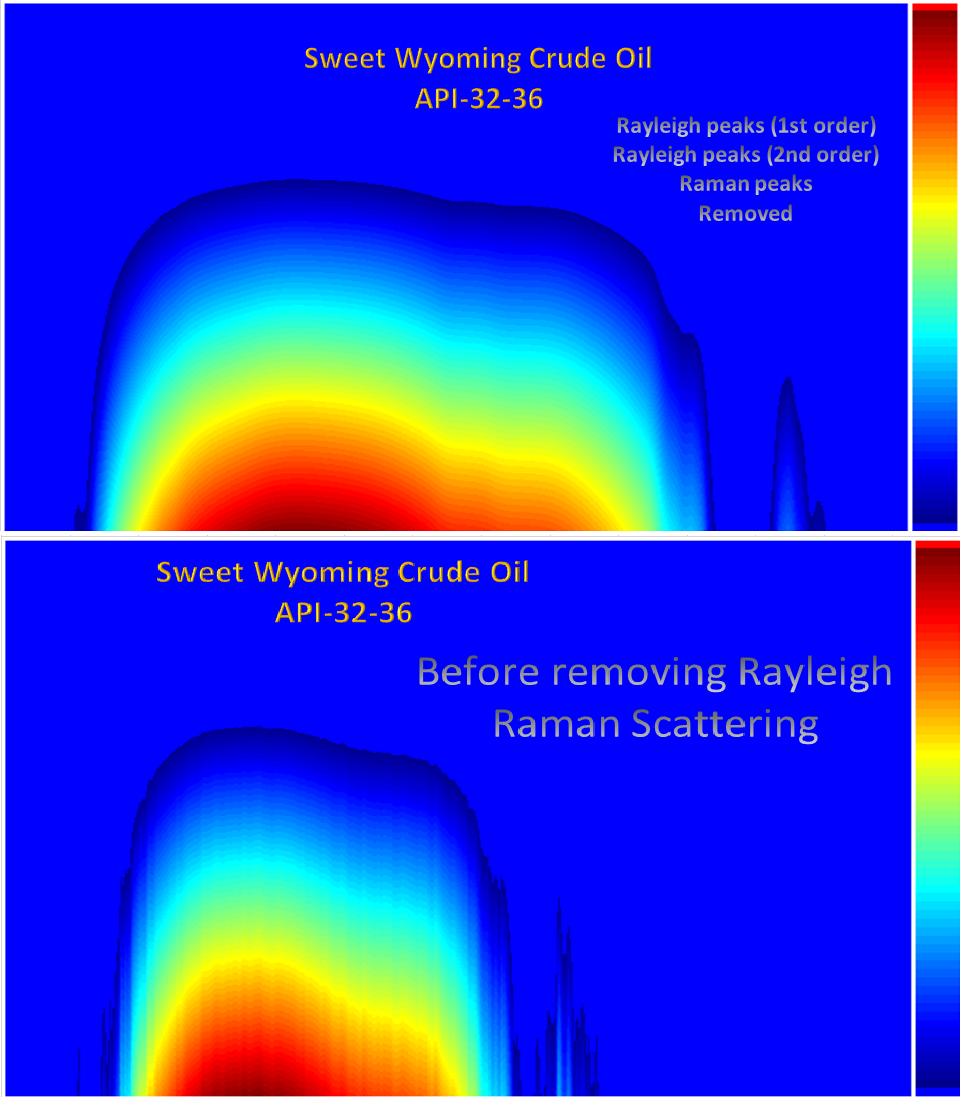
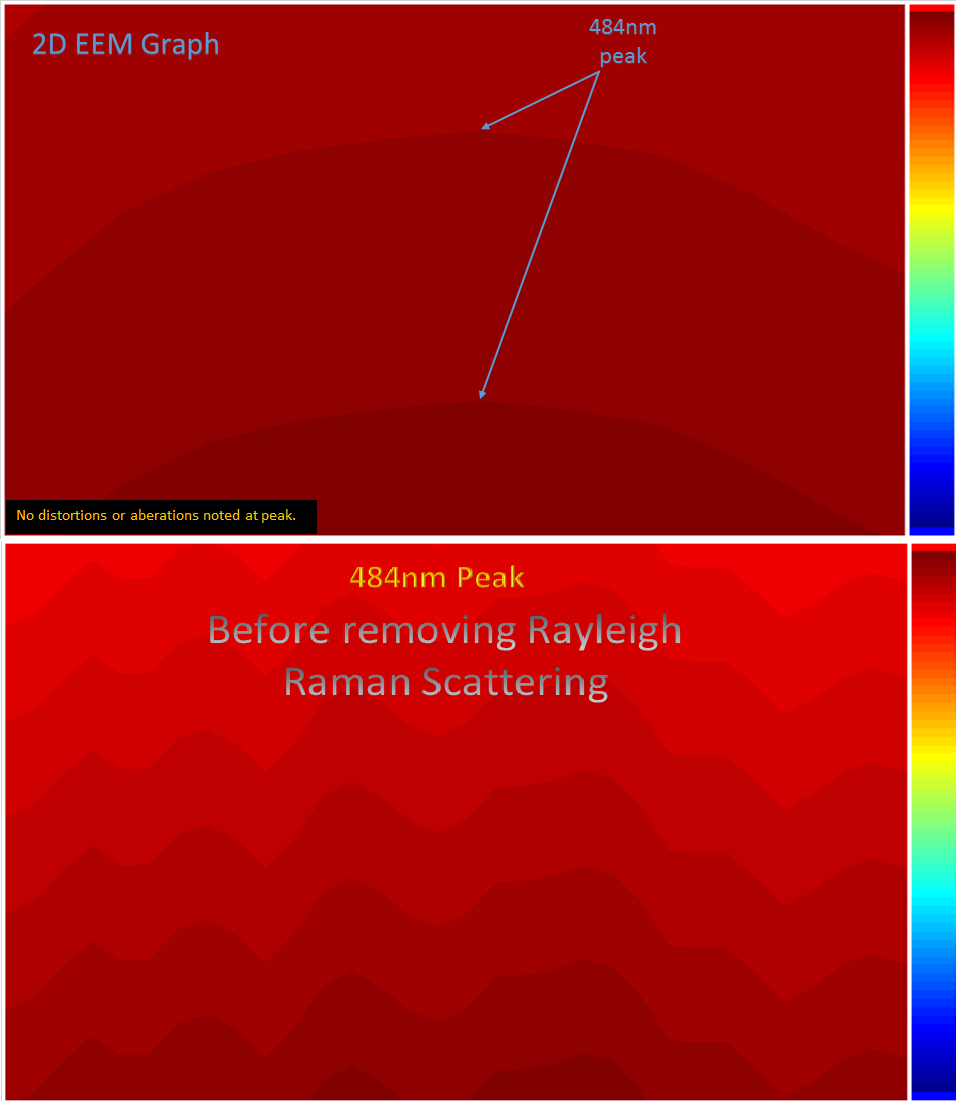
These are 4 EEM graphic plots showing the before and after effects of removal of Rayleigh/Raman Scattering of the spectral captured data.
Here is the first 2 plots illustrating the removal of the 1st and 2nd order Rayleigh peaks, and the removal of Raman scattering.http://publiclab.org/notes/dhaffnersr/08-22-2016/special-scan-sweet-wyoming-crude-oil-2d-eem-analysis-of-0-11mm-slit-width
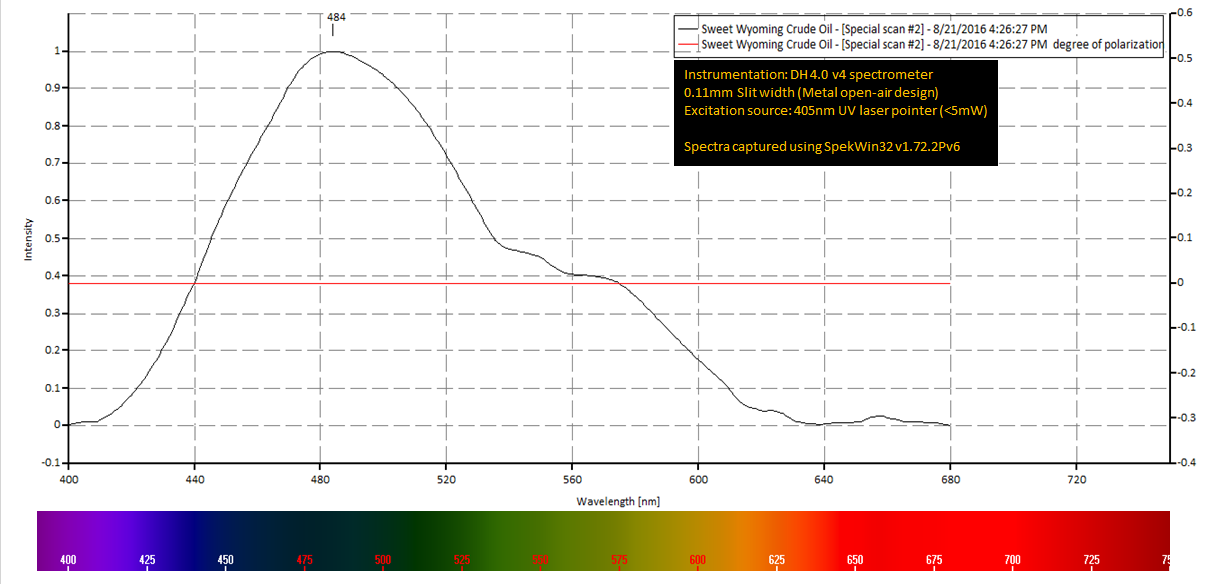 Some conclusions, I am satisfied with this body of evidence from this latest research and the past two research notes I have posted on the difference between using Plab's acetate film strips as slits and using a much more stable and reliable open-air design such as the Gillette Metal razor blade 0.11mm slit I constructed.
Discussions
Become a Hackaday.io Member
Create an account to leave a comment. Already have an account? Log In.