 David H Haffner Sr
Absorption and Emission plot for Rhodamine B in Ethanol Figure.1, using my DH4 v4a spectrometer and a Solux 4700K 12vdc 50W/36deg Lamp, for the absorption spectra:
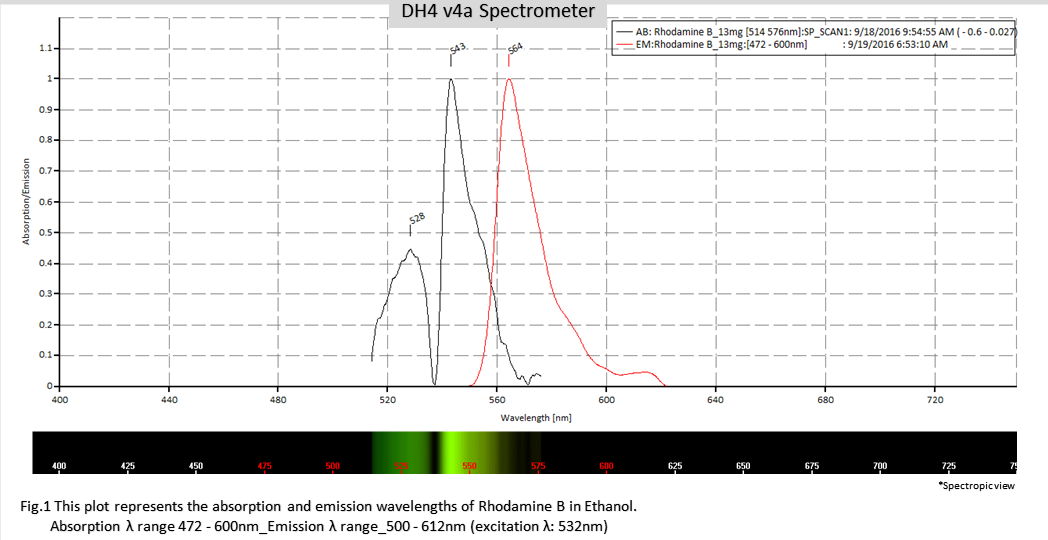
Fig.1a, shows the inverted absorption maxima along with the absorption spectra for Rhodamine B, usually you never see the inverted plot, but I found it to be educational for myself, because it is the onset of the actual absorption of the molecule itself.
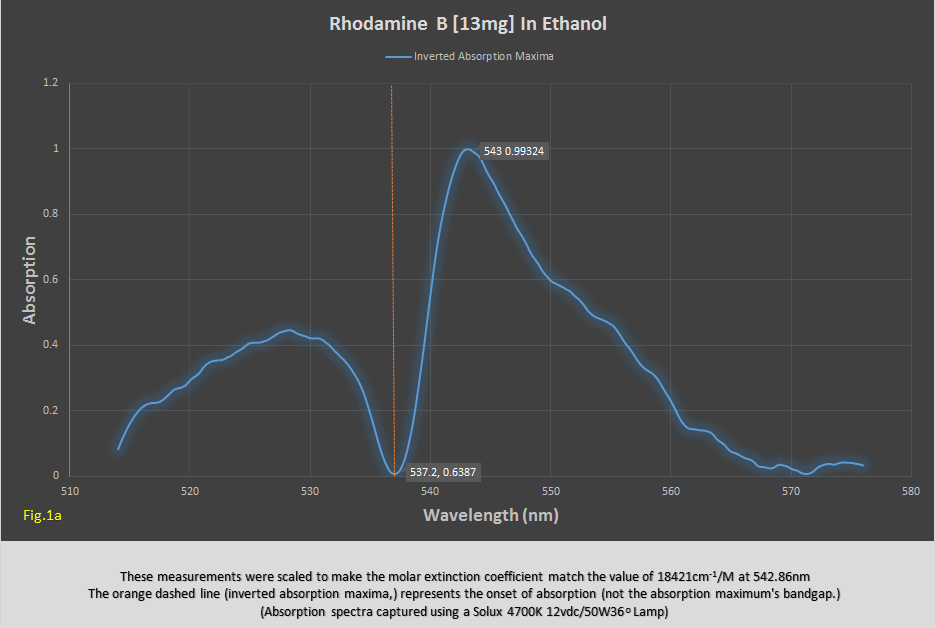
Fig.2 shows the absorption spectrum from 472nm - 600nm using the Solux 4700K 50W lamp. You an clearly see the inverted absorption band (537.2nm) and absorption maximum at 542.86nm.
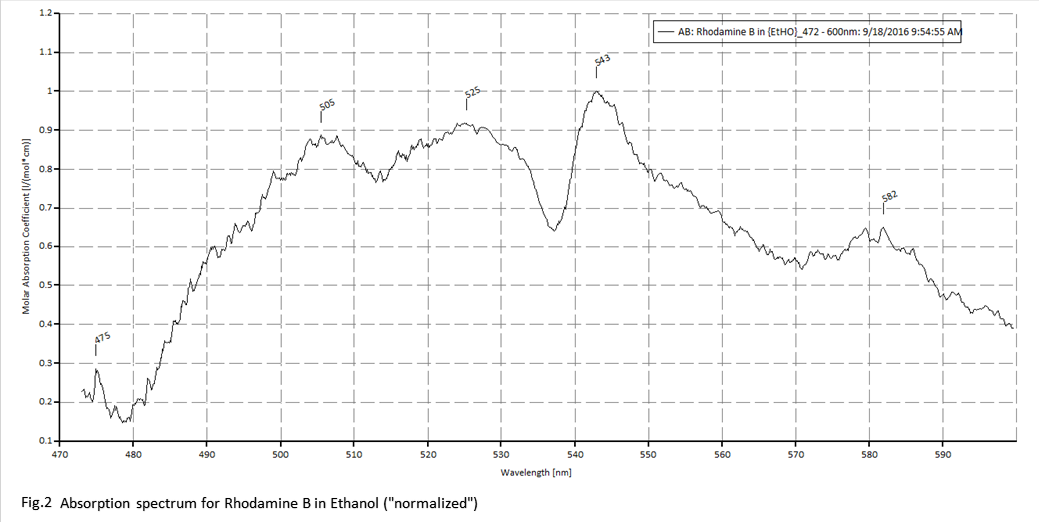
Fig.2a is the data table for the absorption spectrum, with the inverted maxima highlighted in yellow:
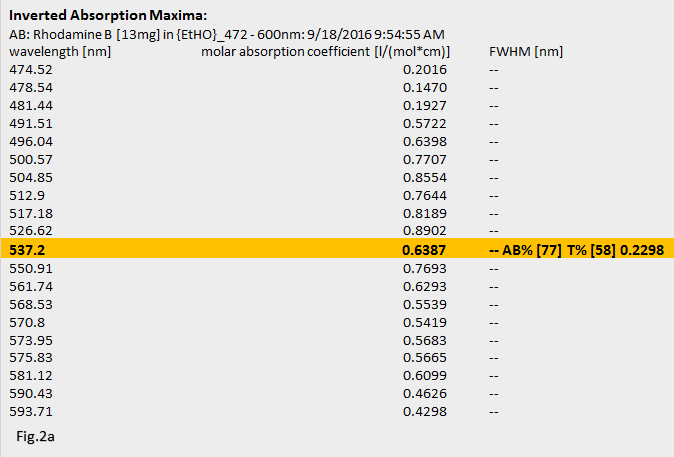
Also in Fig.2a, I included the absorption percent and transmission percent values on the right in yellow.
Emission scan was done using my Aries 150mW DPSS green laser, excitation @ 551nm.
Discussions
Become a Hackaday.io Member
Create an account to leave a comment. Already have an account? Log In.