 David H Haffner Sr
Final resolution tests for this series of alignment testing.
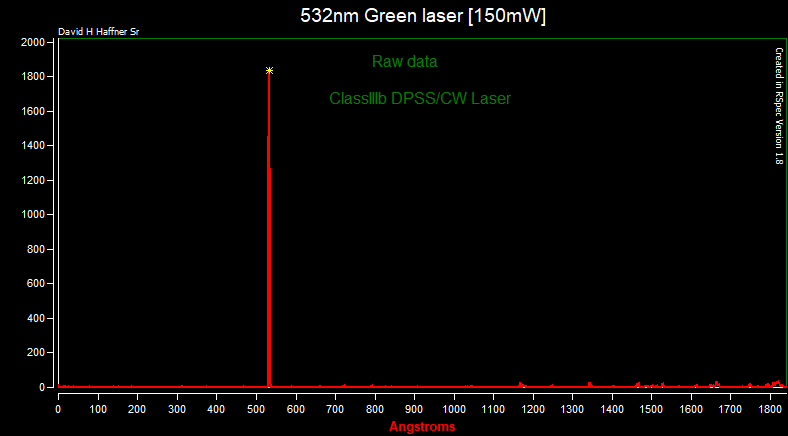
1st plot is the raw data file from RSpec scan 1a;
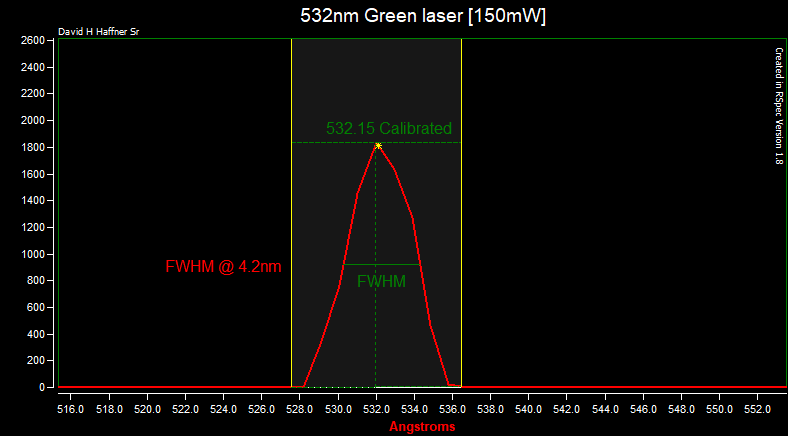
2nd plot is the Guassian intensity distribution in order to show our FWHM data;
Next plot is the final product cleaned up in my processing software Spectragryph 1.2.7;
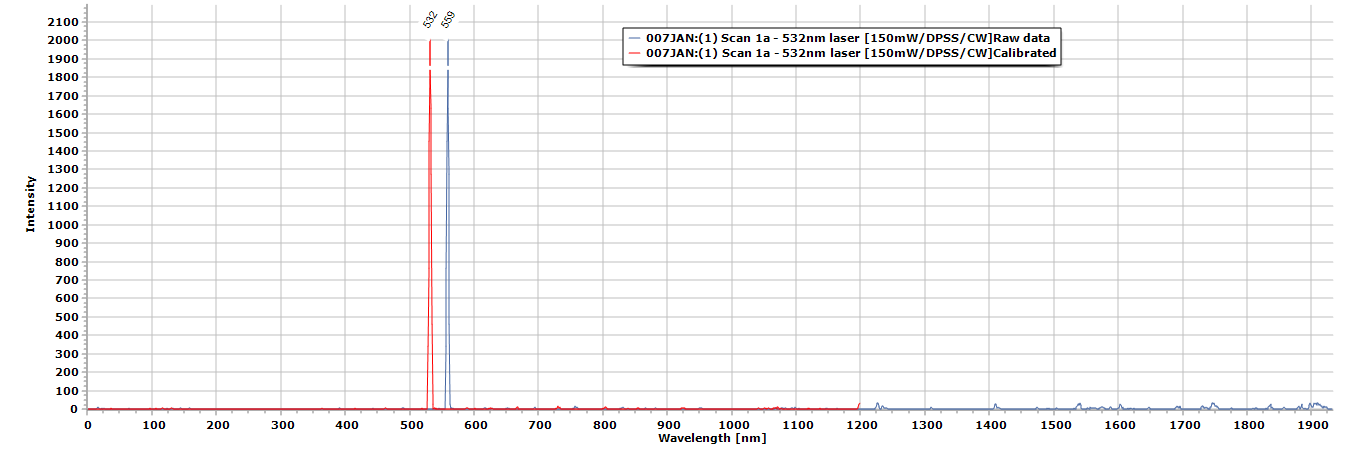
As you might notice in the plot above, I included the un-calibrated spectrum so you can have a visual representation of "bandwidth," my spectrometer at the moment, has a spectral bandwidth of 27.2nm, typical bandwidths for lab grade equipment usually ranges from <20nm, with a resolution factor of not >1nm.
So, lets check out some math here and see if perhaps if its possible to achieve this with a cmos camera?
*note, I know I can do this with the 8-bit CCD using the TCD1304 chip, but right now it is in major re-design ( internal optical setup) yes, I am acquiescing to an Ocean Optics design for dispersion instead, only because "Flat-cat's" setup seemed to work better.
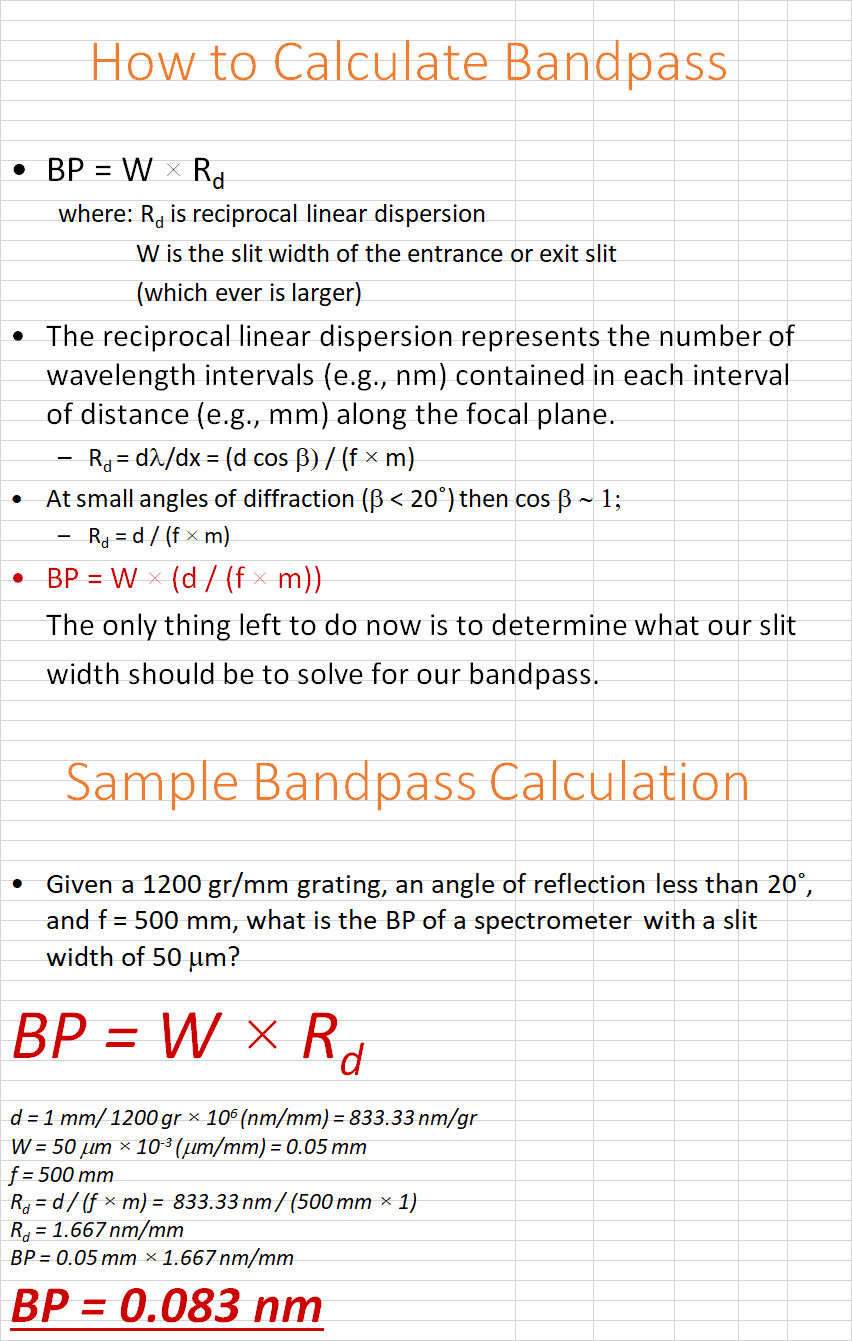
As you can see in the equations above, these are "theoretical" #'s, I already know my angle of incidence for my diffraction grating which is close to 27 deg and a focal distance of 100mm. Lets plug these #'s in and see what we get using my set up;
d = 1mm/1540gr X 10(6) = 649.35nm/gr
W = 100micrometers X 10(-3) = 0.10mm
F = 100mm
Rd = 649.35/100mm
Rd = 6.493
BP = 0.10 X 6.493
BP = 0.649 nm
Not the best in the world but certainly not the worst either, armed with this knowledge you can effectively choose the exact slit width to suit your needs.
The full presentation can be found here:
Discussions
Become a Hackaday.io Member
Create an account to leave a comment. Already have an account? Log In.