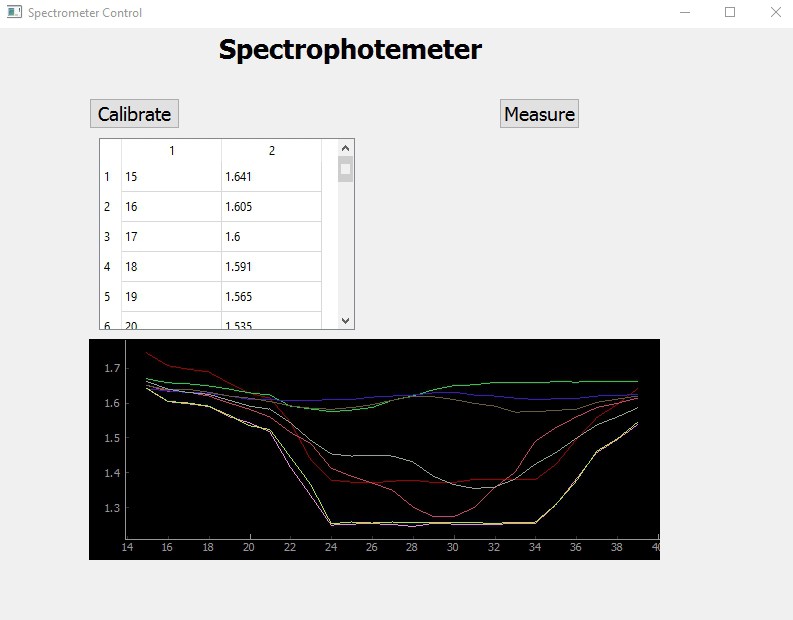
Here's the results from a bit of work with pyqt and pyqtgraph. The X axis is the angle of the diffraction grating as it sweeps the spectrum from red to blue. The Y axis is the response of the photodiode with higher values being less response.
The bottom pair of lines in the plot are the calibration runs with plain water. The red line is a run using plain water, but through the translucent sides of the cuvette and shows a reduction in transmittance, but the same shape as the calibration runs. ("Calibration" here just means "reference" since I have no method of actually calibrating the device.) The other lines are the responses to various food colorings that I happened to have, and varying concentrations.
I find these results very encouraging! Since I now believe this thing will actually work and may be very useful, I now plan to concentrate on getting the documentation into place so that others may duplicate the unit. Perhaps others may give me guidance on writing usable software for various applications.
 doctek
Discussions
Become a Hackaday.io Member
Create an account to leave a comment. Already have an account? Log In.