 Jithin
Linear optical arrays (a camera with only one row of pixels), commonly used in barcode scanners, can be put to other uses as well.
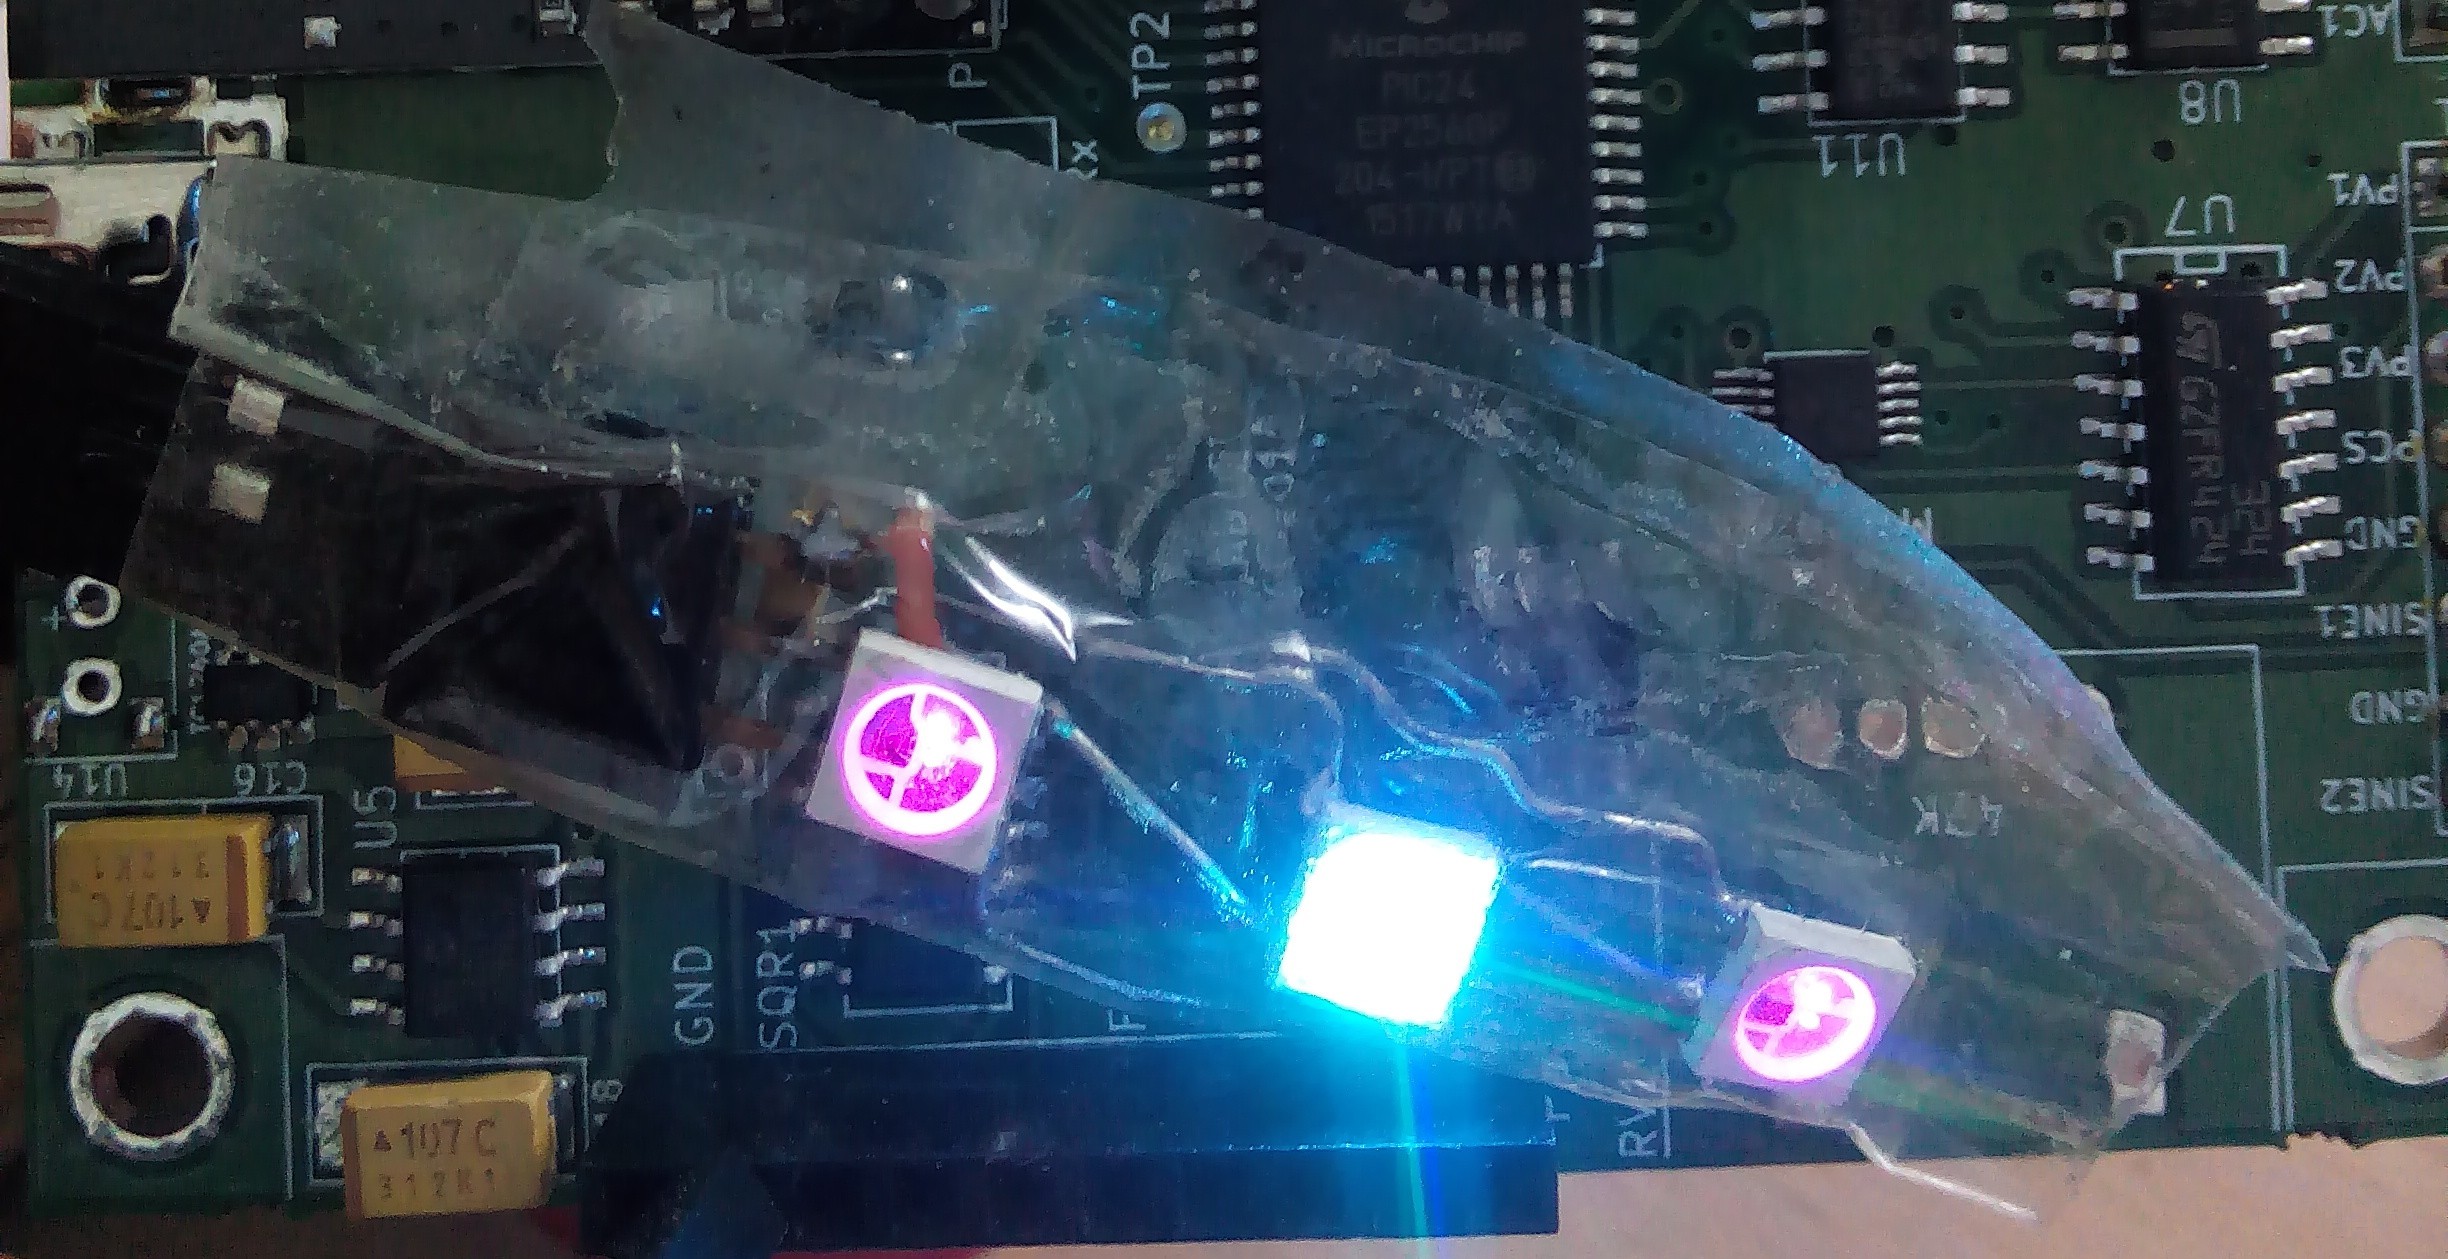
The SEELablet includes the ability to acquire data from one such array, and a simple diffraction grating was used to study the diffraction spectra of a few coloured light sources such as the WS2812B (RGB LED), a torch, and a laser diode.
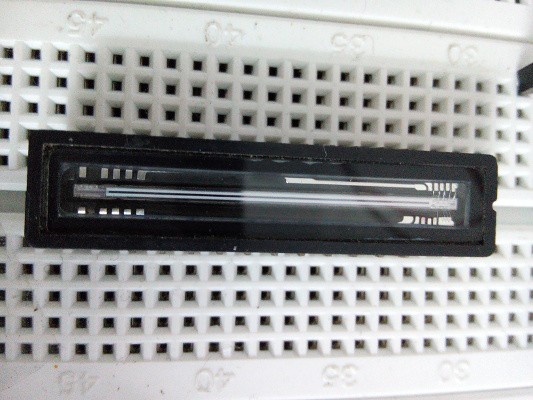
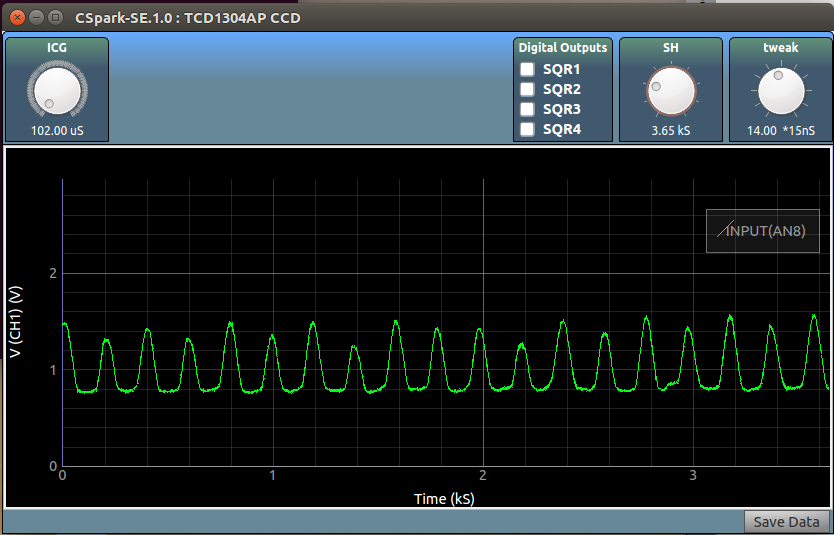
A ruler was placed on the sensor. Its opaque marking cause the spikes in the plot
Figure : Sensor element, and RGB LED

from SEEL import interface
I=interface.connect()
I.WS2812B('SQR1',[[25,0,0]]) #Set a faint shade of red on an RGB LED

SH = 2 # time period of shift gate in uS
ICG = 12e3 # 12mS integration time
I.opticalArray(SH,ICG,'AN8',resolution=12) #acquire one set of readings
I.__fetch_channel__(1)
Y=I.achans[0].get_yaxis()[32:-14] #Crop out the dummy outputs from the sensor
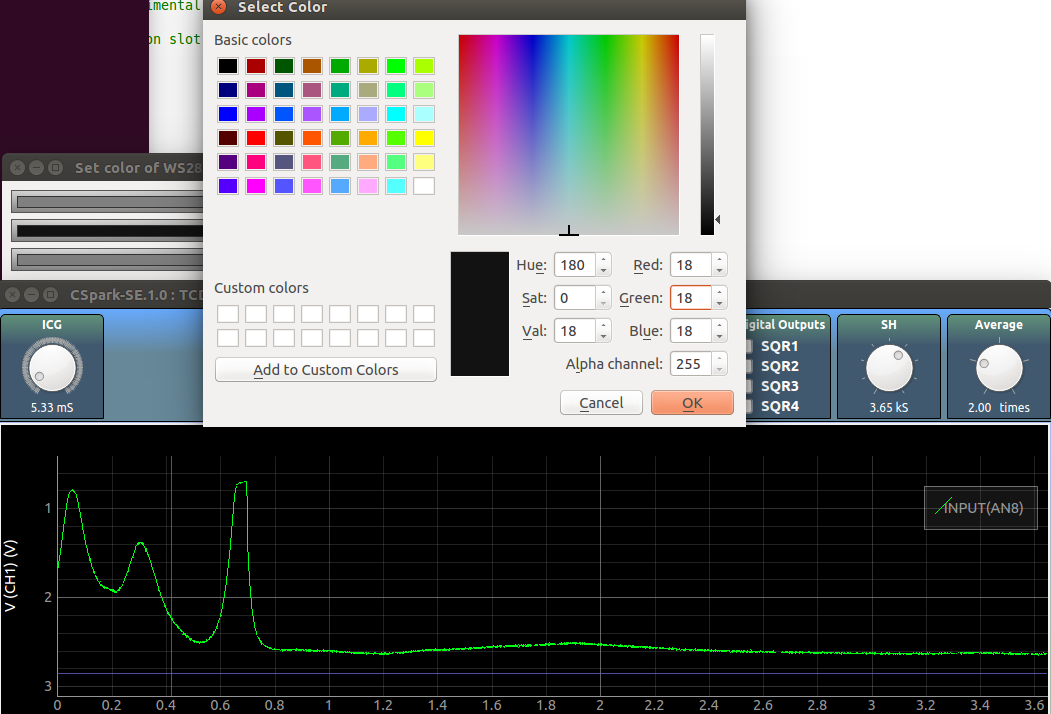
Figure : Shortest wavelengths to the left, infrared to the right. The peak for RED shows slight saturation here because I set ICG (integration time) too high. The color of the RGB LED is set using the color picker widget
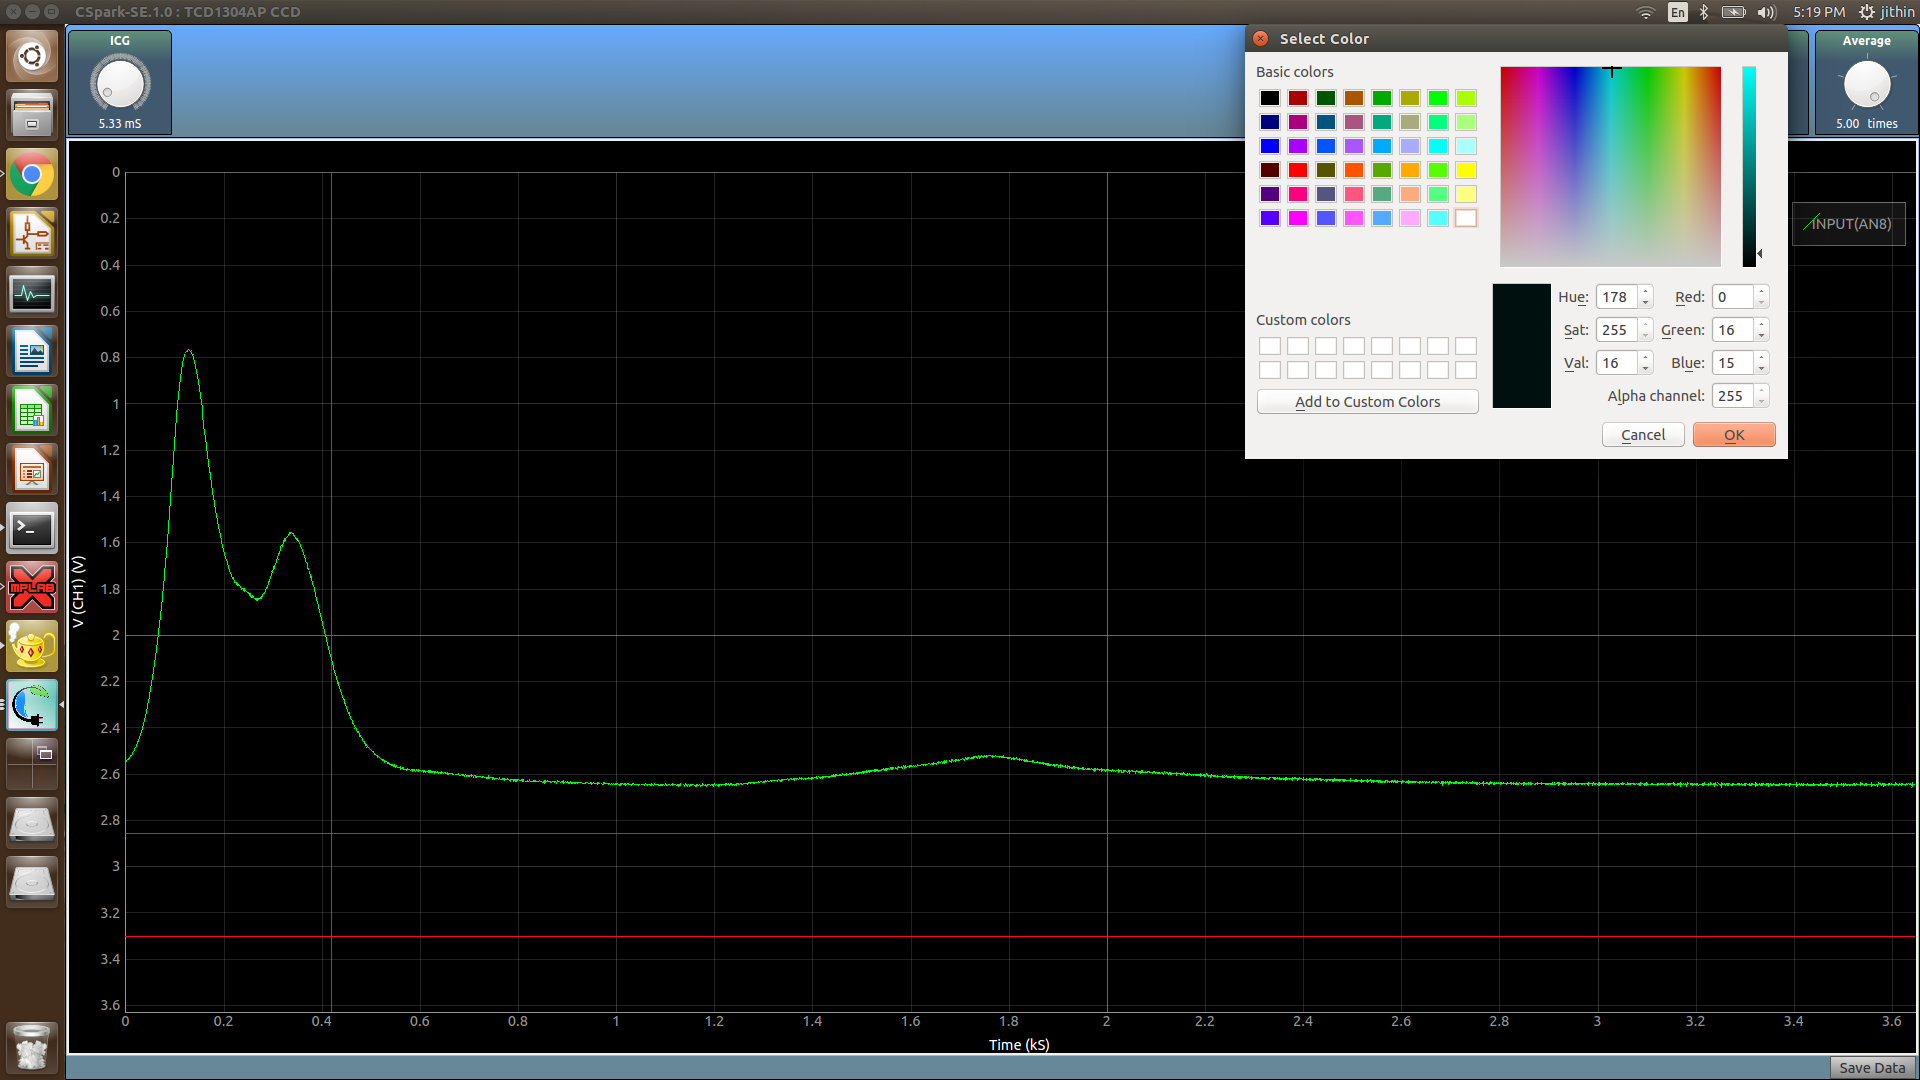
Figure : Green and blue peaks are visible if the colour is set to Cyan. The second order of the spectra is also visible
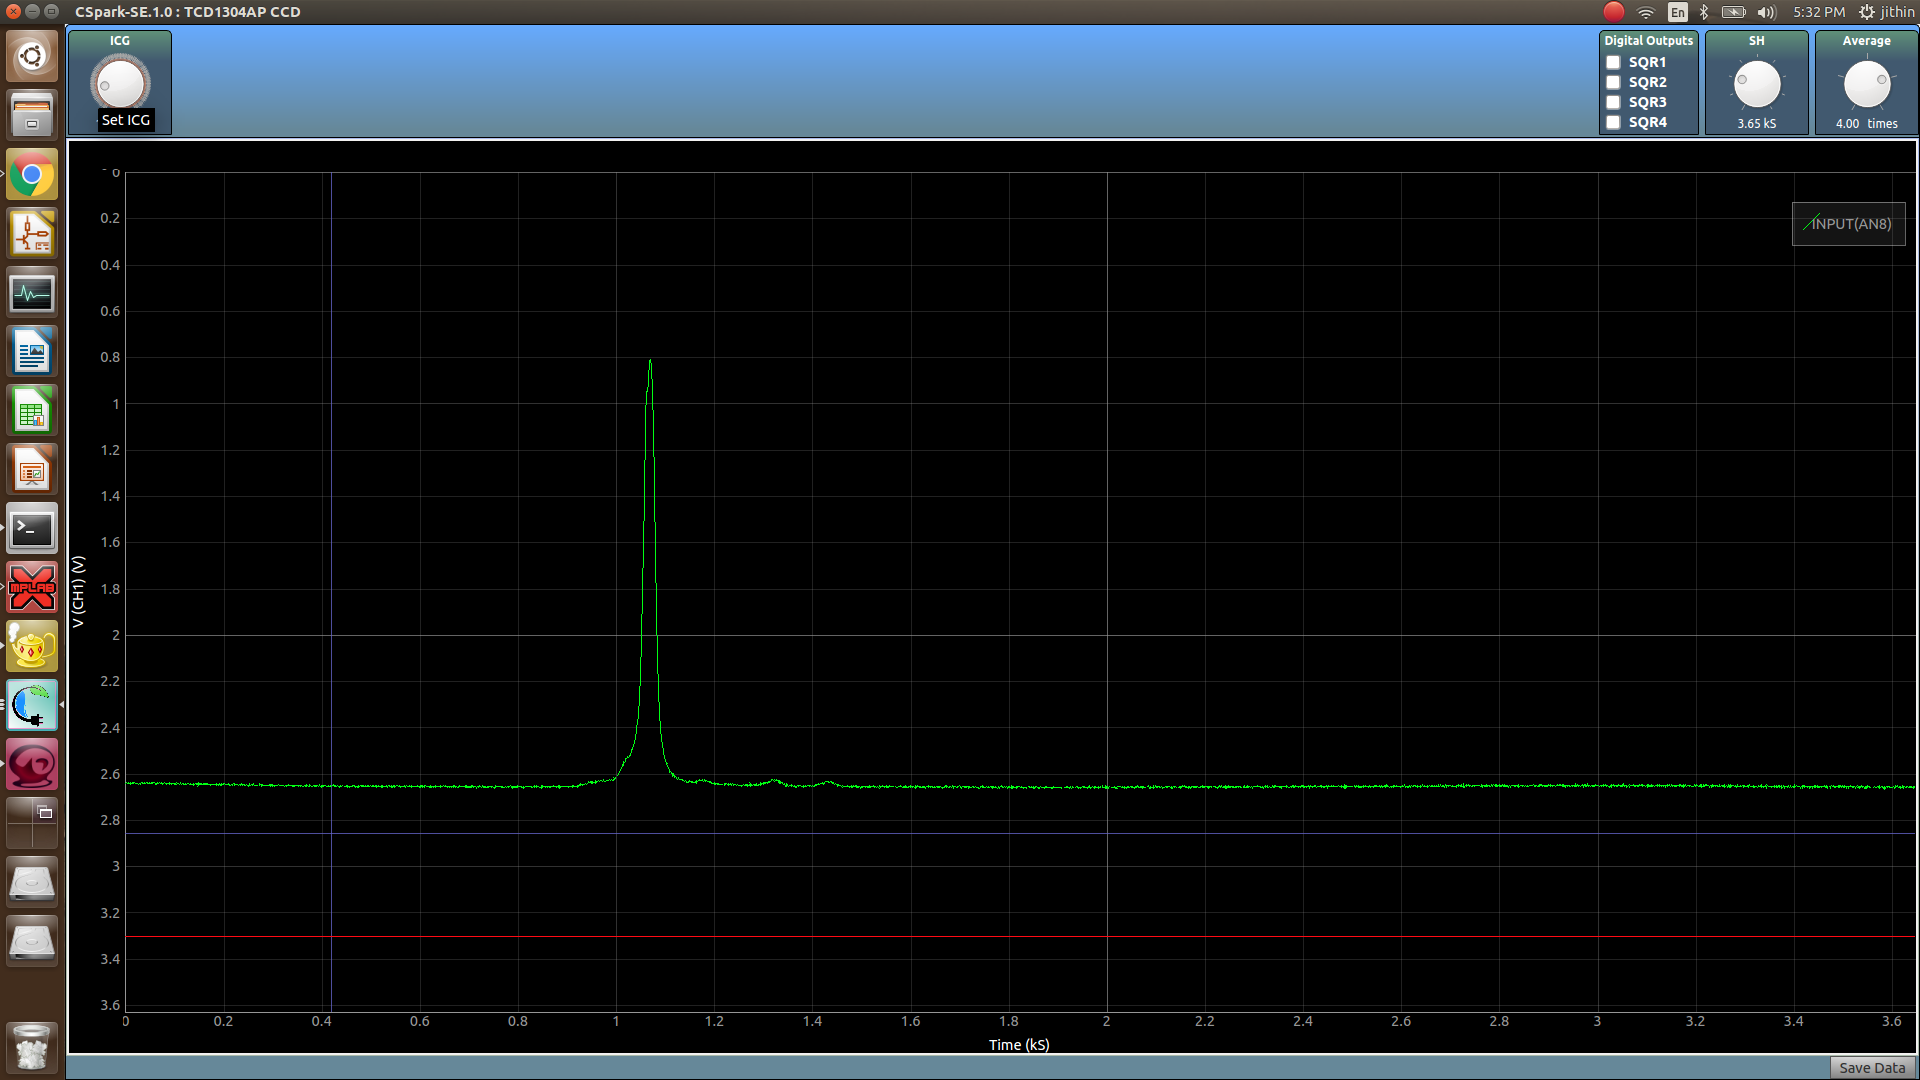
Figure : A laser has sharper spectra. Shown here is the spectra from a commonly available red diode laser.
Discussions
Become a Hackaday.io Member
Create an account to leave a comment. Already have an account? Log In.