 DotPiDot
A first version of the web dashboard is ready and under test:
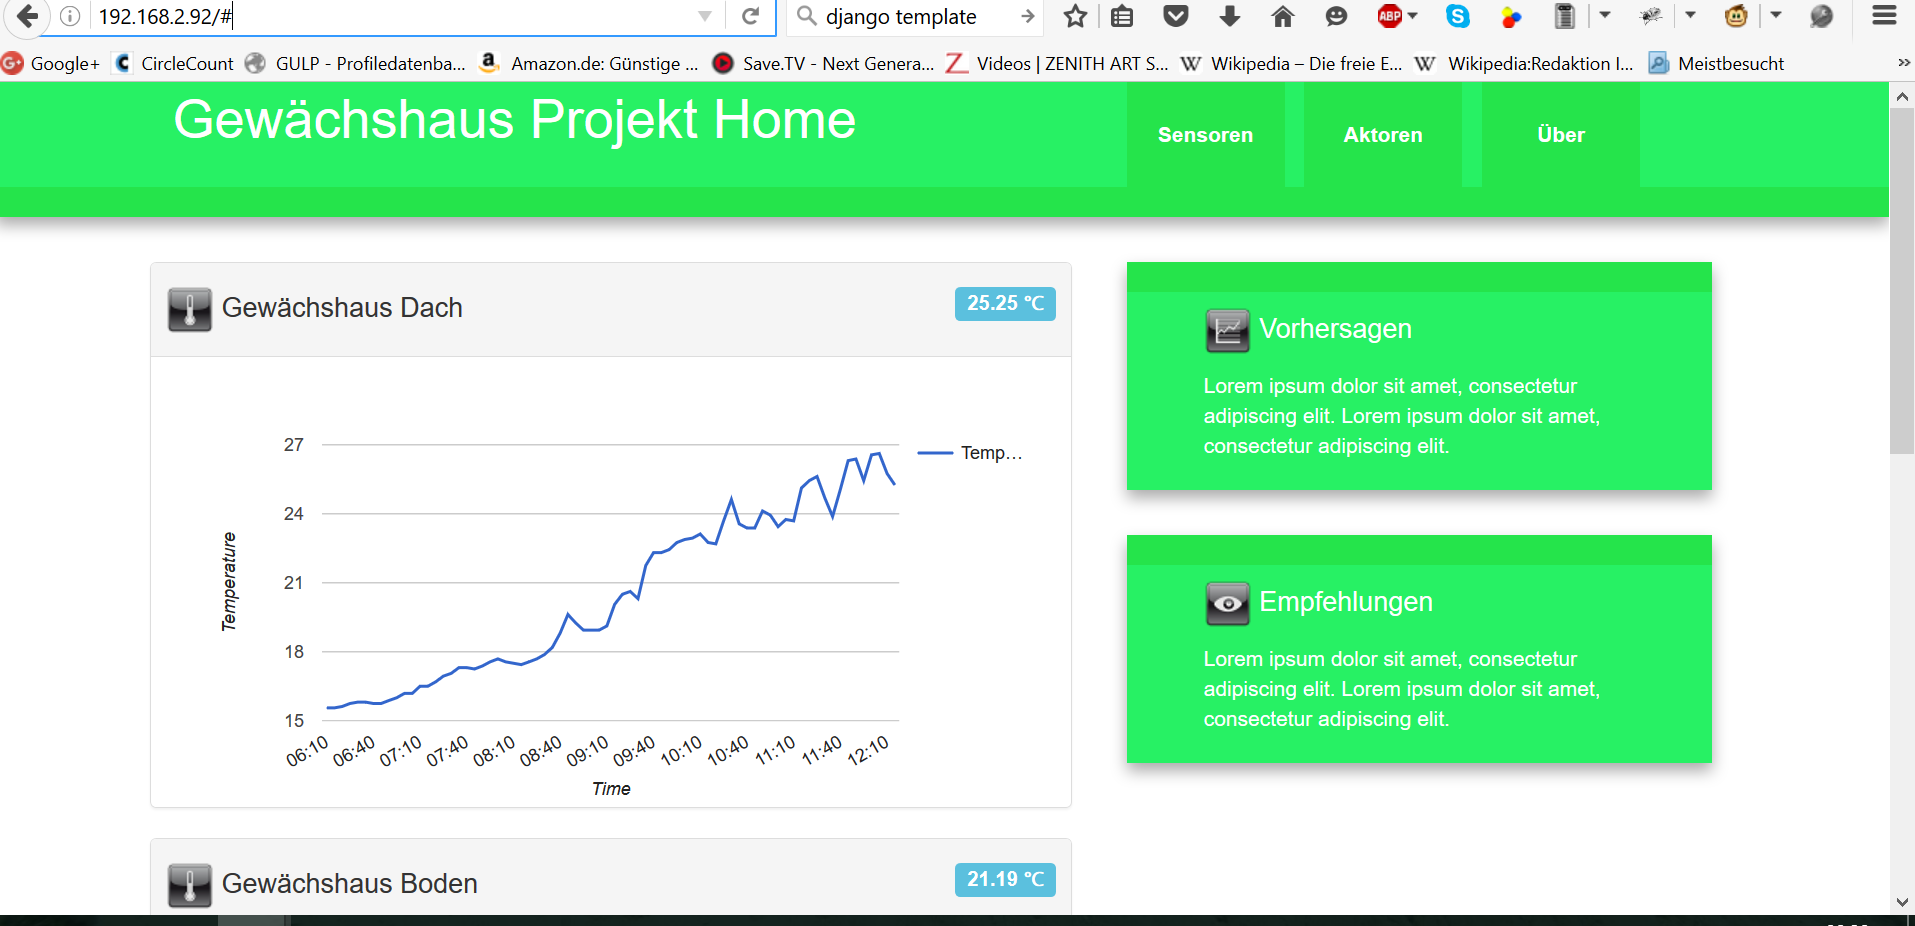
It is based on Bootstrap - the charts are Google Chart components - the rest is pure javascript. What you can see on the screenshot is a real measurement cycle for one temperature sensor (two DS18B20's and one BMP085 are connected).
I'm still thinking of using some kind of web framework like Django, Angular, Express, Koa, Horizon or something for the dashboard app. There is dozens of those each one with advantes and disadvantages...
Also i'm not happy with the Google charts component: Firstly it needs internet connectitivty to work (no local libary available) and secondly it is not fully responsive (means it does not scale to smallest sized, e.g. for mobile devices correctly)
The backend is also built in a first version based on Python (for the adapters to the sensors), RethinkDB and Tornado for Websockets. I'll add details regarding this and source code as well in a later post. The data pipeline from the hardware sensors to the frontend works although it is not yet perfect of course...
Discussions
Become a Hackaday.io Member
Create an account to leave a comment. Already have an account? Log In.