 Ted Yapo
 It turns out the analyzer, along with a pair of battery models I derived from datasheet graphs, can be used to predict the run-times of ultra-low-power devices. Here's the expected brightness of the latest design TritiLED glow marker run from a pair of lithium AA batteries over the first 20 years of battery life:
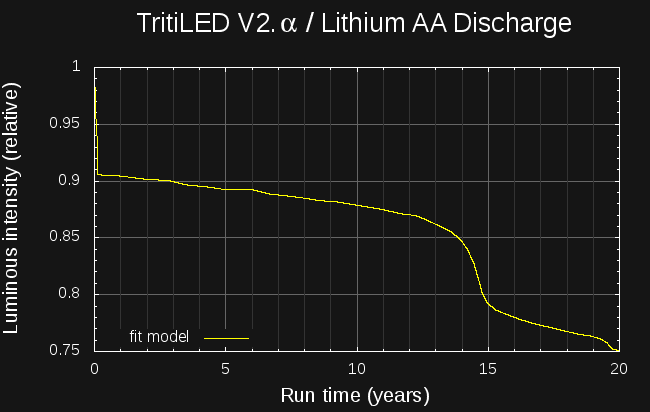
In the last log, I used the first analyzer prototype to find the electrical-to-optical efficiency curve for the Luxeon Z LED used in the #TritiLED project. Based on this data, I was able to design a new LED glow marker circuit that uses less than half the current of the first version, while maintaining the same brightness (actually, it's a little brighter). The circuit runs for two years on a CR2032 lithium coin cell, and as shown above, for 20 years on a pair of AA lithium batteries (LiFeS2 AA cells are rated for a shelf life of 20 years, which is where I stopped the model; otherwise, the lifetime would easily exceed this period). The two-stage discharge of the LiFeS2 chemistry (evident as the step between 14 and 15 years) is explained in Energizer's Application Manual and accurately captured by the model.
Predicting Battery Lifetime
Predicting runtime for nano-power devices is a complex subject. Since battery voltage changes as capacity is consumed, and device current drain is a function of battery voltage, simple back-of-the envelope calculations can only be so accurate; after that, a better model for the components involved is required. One half of the equation is the battery performance. In a recent log on the #TritiLED project, I presented a model for lithium primary batteries (LiMnO2 / LiFeS2) suitable for use in low-drain simulations. The model estimates the battery voltage as a function of used capacity. The other half of the simulation is a model for the circuit current drain vs supply voltage. Given these two models, a numerical integration can estimate battery life.
The following snippet of python code illustrates the idea. The battery model predicts the supply voltage at each timestep, then the device model estimates the current draw at this supply voltage. Finally, the battery model is updated with the capacity (amp-seconds) used during the interval. The simulation continues until the battery is dead (capacity is reduced to zero, or maximum lifetime exceeded):
# integration time step in seconds
timestep = 3600 * 24
t = 0
while not battery.dead():
  voltage = battery.voltage()
  current = device.current(voltage)
  print t/3600, voltage
  battery.use_amp_seconds(current, timestep)
  t += timestep
There are a number of limitations to the battery model, which is only valid for small current drains, and neglects the effects of extreme ambient temperature, but within these constraints it seems to yield reasonable results.
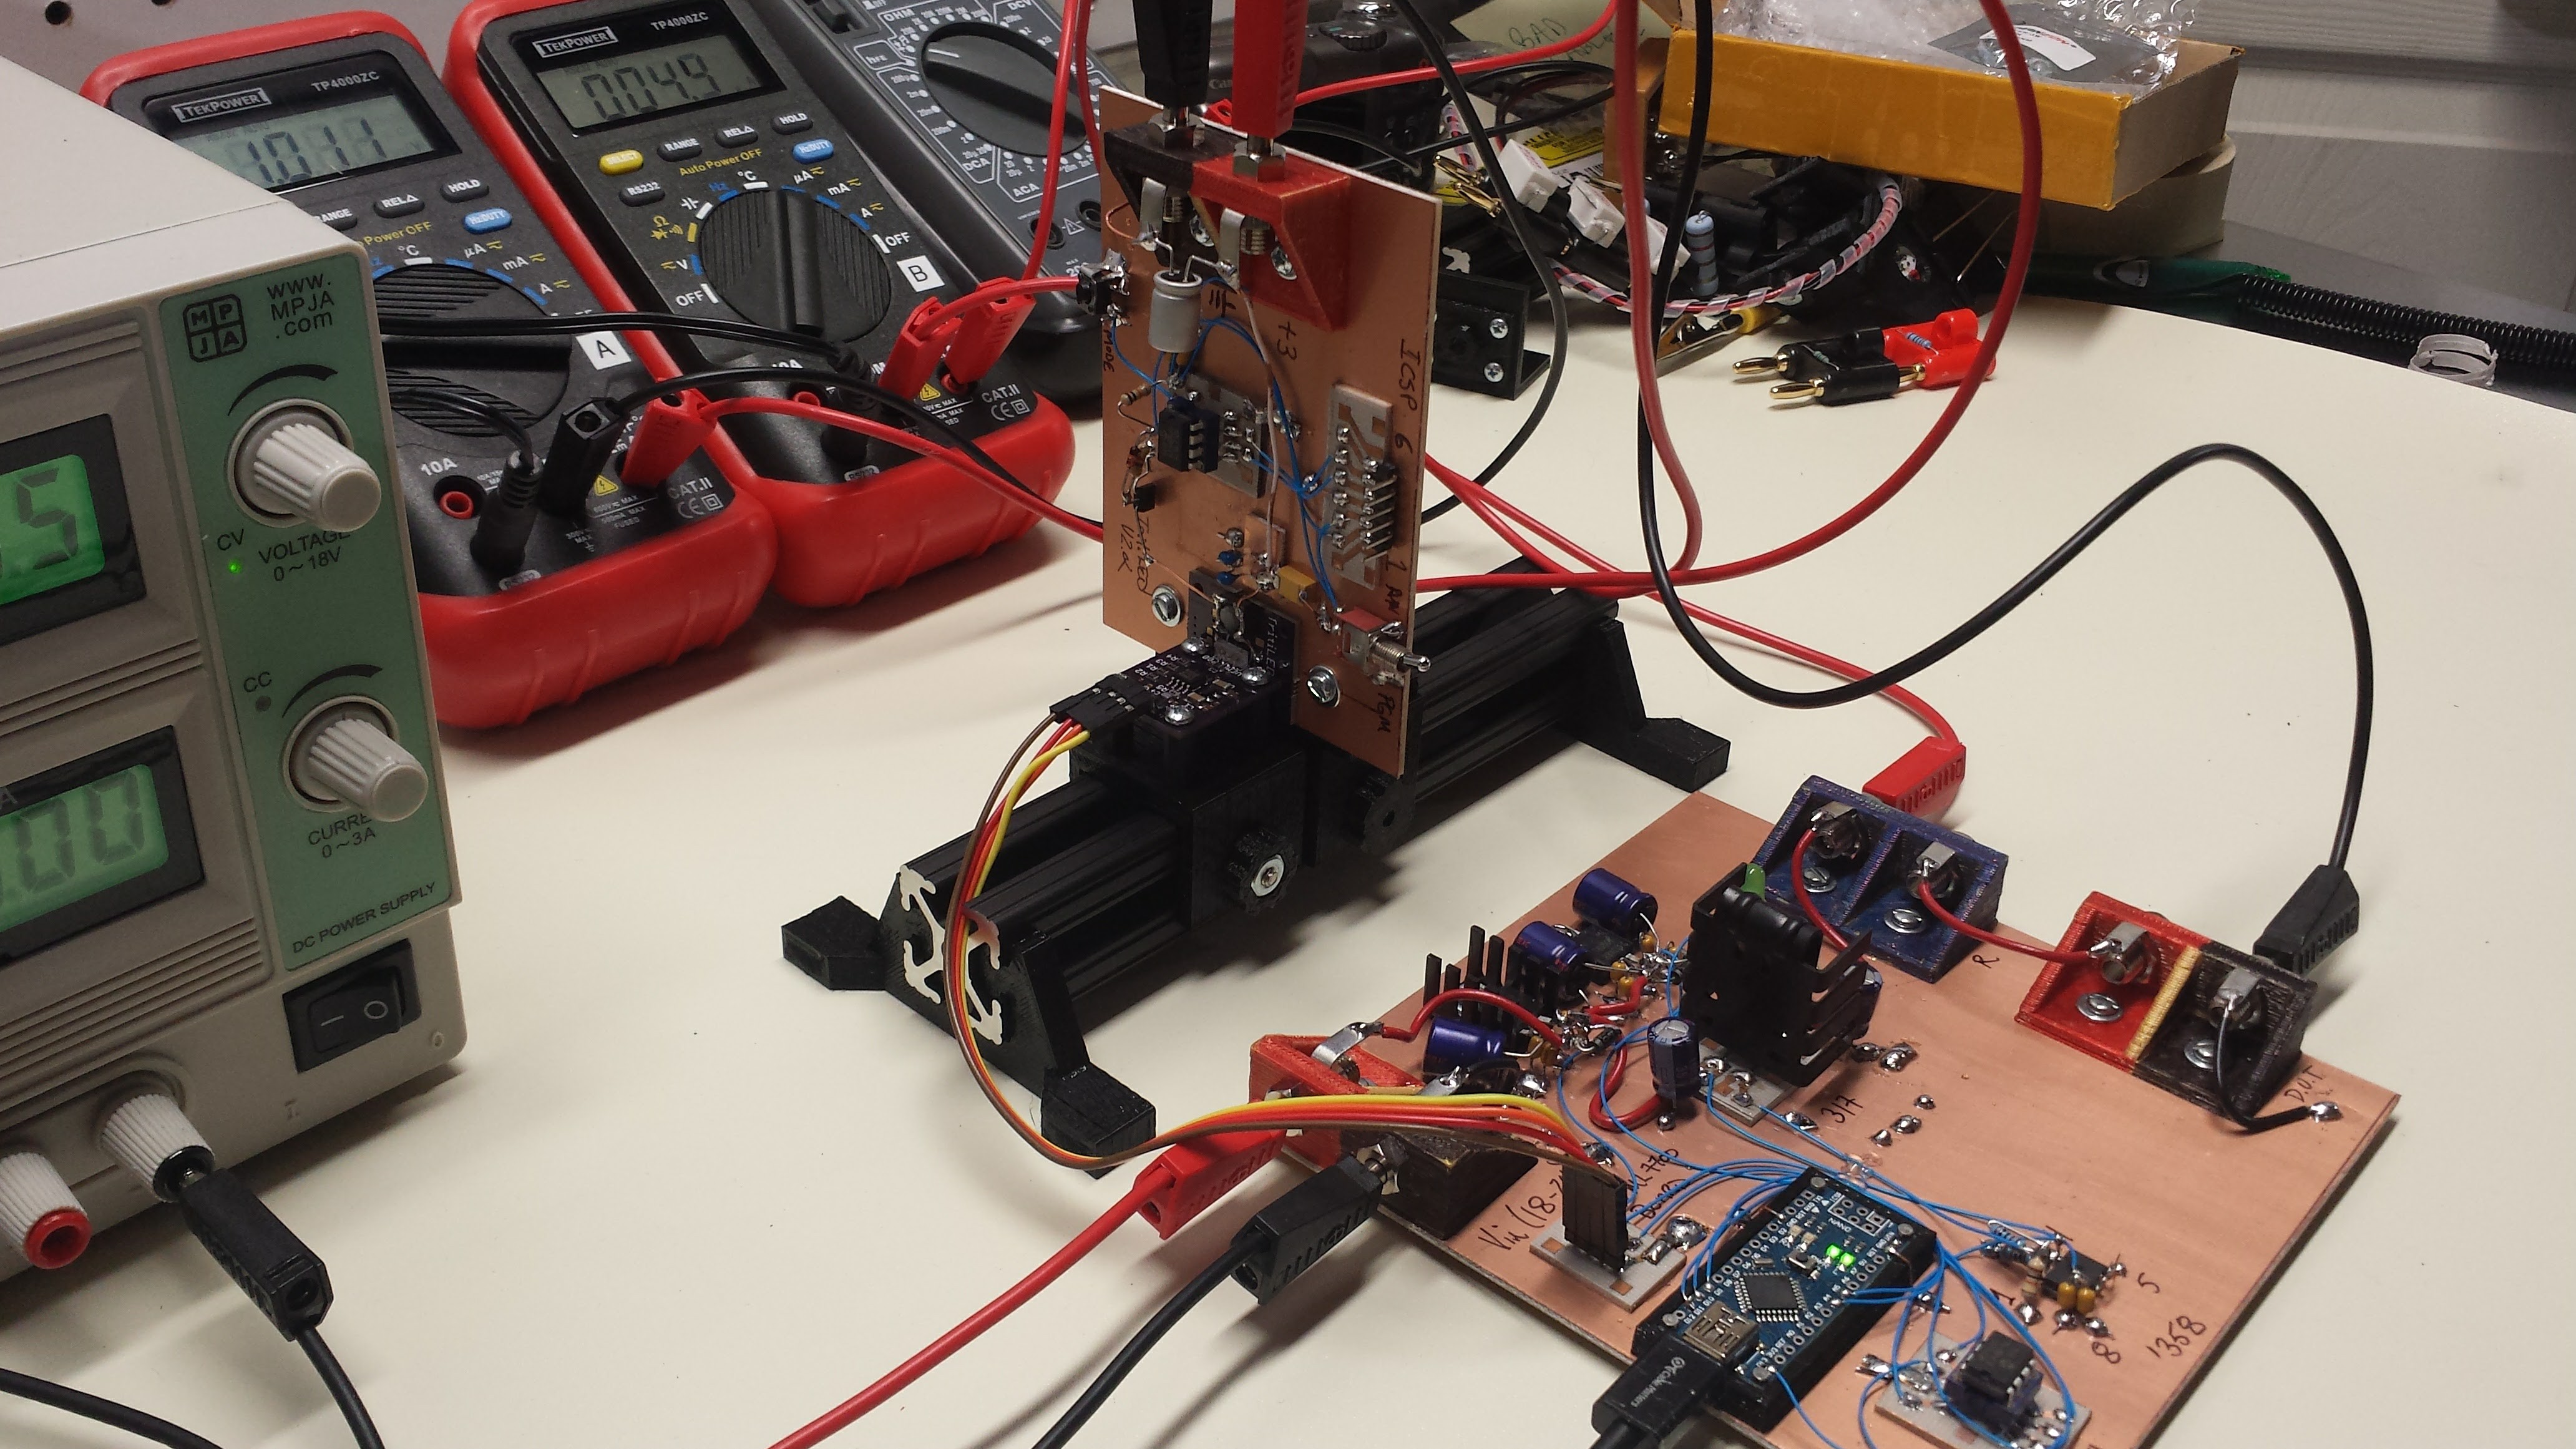
So, given a low-current device, how can we model current drain vs voltage? As it turns out, the analyzer can produce a model of the current drain vs supply voltage for an arbitrary circuit. As a test, I connected a #TritiLED prototype (right) to the analyzer (left) with no resistor at R1:

With this setup, I collected the following data for current draw vs supply (battery) voltage:

The "model" curve is a polynomial fit I used to filter noise and interpolate the data points. For modeling the effects of battery internal resistance, an appropriate resistor could be re-inserted at R1. Combined with a battery model, this type of curve allows the runtime of general low power multi-year battery-powered devices to be predicted. With a better battery model suitable for high-drain devices, this method could be extended to any battery-powered circuits.
Predicting Brightness
While the above analysis is applicable to any battery-powered device, the analyzer is also capable of measuring relative luminous intensity (i.e. brightness) - so any light output from the device can also be measured and subsequently modeled. To predict the brightness of the latest TritiLED glow marker over the battery life, I optically coupled the LED to the analyzer photodetector:
With this arrangement, I was able to capture the following data for the glow marker's brightness as a function of supply voltage:
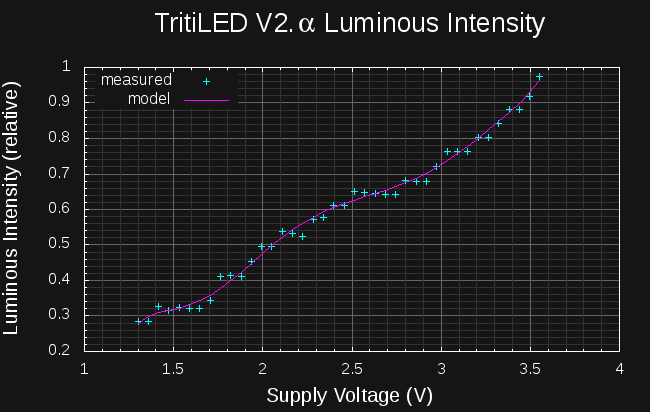
With this data, the LED brightness at each simulation time-step can be estimated from the battery voltage, yielding a curve of the brightness over time as the battery discharges. This method was used to produce the 20-year plot at the beginning of this log.
Lessons Learned
Minimum voltage: I spent half a log a while back convincing myself that I could live with the minimum output voltage of around 1.25V imposed by the LM317 regulator. Unfortunately, this would preclude using the analyzer to measure the current drain of single-cell powered devices, which often must work at the 0.9V end-of-life voltage of alkaline cells. In light of this, I think I'm going to return to the LT3080 regulator, which can work down to zero volts.
VEML7700 Auto-ranging: to collect the brightness curve above, I had to disable the auto-ranging code for the VEML7700 light sensor. The TritiLED circuit produces light pulses at around 63 Hz, which easily confuses the auto-ranging code that tests sensor integration times of as little as 25ms. The analyzer controls should have a manual-range setting for this kind of measurement.
VEML7700 Pulse response: the luminous intensity reported by the sensor for the TritiLED circuit is lower than I would expect. This manifests in the stair-step appearance of the intensity curve. My suspicion is that the integrator circuit inside the VEML7700 does not handle the short (8us) light pulses produced by the circuit correctly. The VEML7700 datasheet mentions internal filtering to remove the effects of 50 and 60Hz lighting, so it's entirely possible that the sensor doesn't accurately integrate these brief pulses. I will have to compare the sensor output for a blinking and constant LED at the same average intensity, which can be verified with a long camera exposure.
Next Up
I have been collecting a bunch of literature on auto-zero op-amps, precision instrumentation amps, 20+ bit delta-sigma ADC's, and precision references. I am going to take a few days to read this material (and re-reading a few Jim Williams app-notes and selected chapters from the Art of Electronics) and try to distill it all into a design for a second prototype. In the mean time, I'm ordering a bunch of SOIC-8 ugly-prototyping adapters for building the thing.
Discussions
Become a Hackaday.io Member
Create an account to leave a comment. Already have an account? Log In.