 Ted Yapo
I have been evaluating some new ebay/amazon/aliexpress LEDs; it's a good excuse to put some mileage on the existing analyzer prototype while I wait for parts. These LEDs look like the old Luxeon Emitters:

but, of course, come with no datasheets. They're supposedly 490nm (peak or dominant is unknown), rated for 1W or 3W, and that's about all the data I have. But, they're cheap - $0.33 (qty. 100) - and have a large die area and wide viewing angle. I picked up some blank aluminum "star" boards, soldered a few LEDs on, and ran some tests. Here's what I found for the efficiency curve:
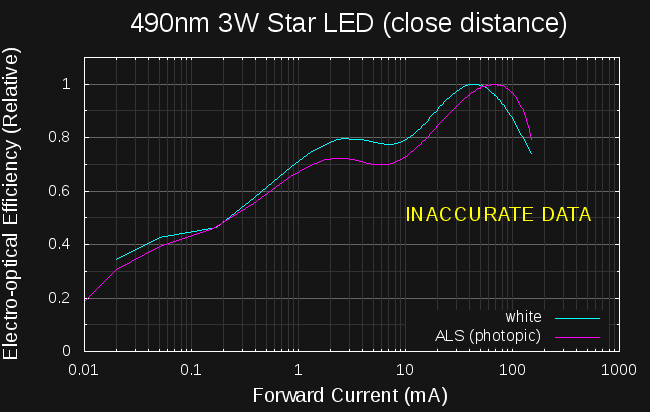
The two curves are made with the VEML7700's "ALS" and "white" sensors. The ALS sensor has a spectral response very closely matched to the human eye's photopic response, while the white sensor has a relatively flat response across the visual spectrum. I'd expect there to be a difference between the two curves here since InGaN LEDs (especially the green ones) show a wavelength shift with current (shorter wavelengths at higher current - "blue shift," they call it). This "490nm" LED is right on the maximum slope of the ALS response curve; any wavelength shift with temperature would show up as an erroneous brightness difference - the ALS response should disproportionately more dim at higher currents, pushing the efficiency peak to the left. But, the curves above are exactly opposite. I recognized this as a problem right away.
The second issue, although more obvious, didn't bother me much at first. There are two efficiency peaks, one at maybe 2-3 mA, and another at 40-70 mA. I was a little surprised that the major peak was at such a high current, but not being a semiconductor physicist, I figured at first this was just the nature of these LEDs. I looked around the openly available LED research literature for an explanation, but couldn't find any. Eventually I started to suspect the VEML7700 sensor. It turns out that there is only one peak after all, but it look a while to figure it all out.
VEML7700 Linearity
The VEML7700 datasheet and applications literature state that the raw values are linear up to 10,000 lx, and can be well-corrected using a supplied polynomial up to 120,000 lx. I checked the lx values for the curves above and found I was measuring over 500,000 lx at the high end. Oops. But, this got me thinking - I never did test the linearity of the sensor. How do I know it really is linear even up to 120 klx as the literature states?
How to measure the linearity of the sensor? The light from LEDs is not linear with current (that's the whole point of this project). I briefly considered using measured distance to attenuate a fixed light, but thought it would be too error-prone. I finally remembered that I had some theatrical gel filters around.
I happened to have a few sheets of Roscolux #97 and #98 filters, neutral density filter sheets with 50% and 25% nominal transmission. These filters are made for theatrical and photographic lighting, so are cheap and readily available - they also sell a small swatchbook with samples of dozens of different colors that makes for some nice opto-hacking. I decided to use these filters with a fixed light source to test the linearity of the VEML7700 sensor.
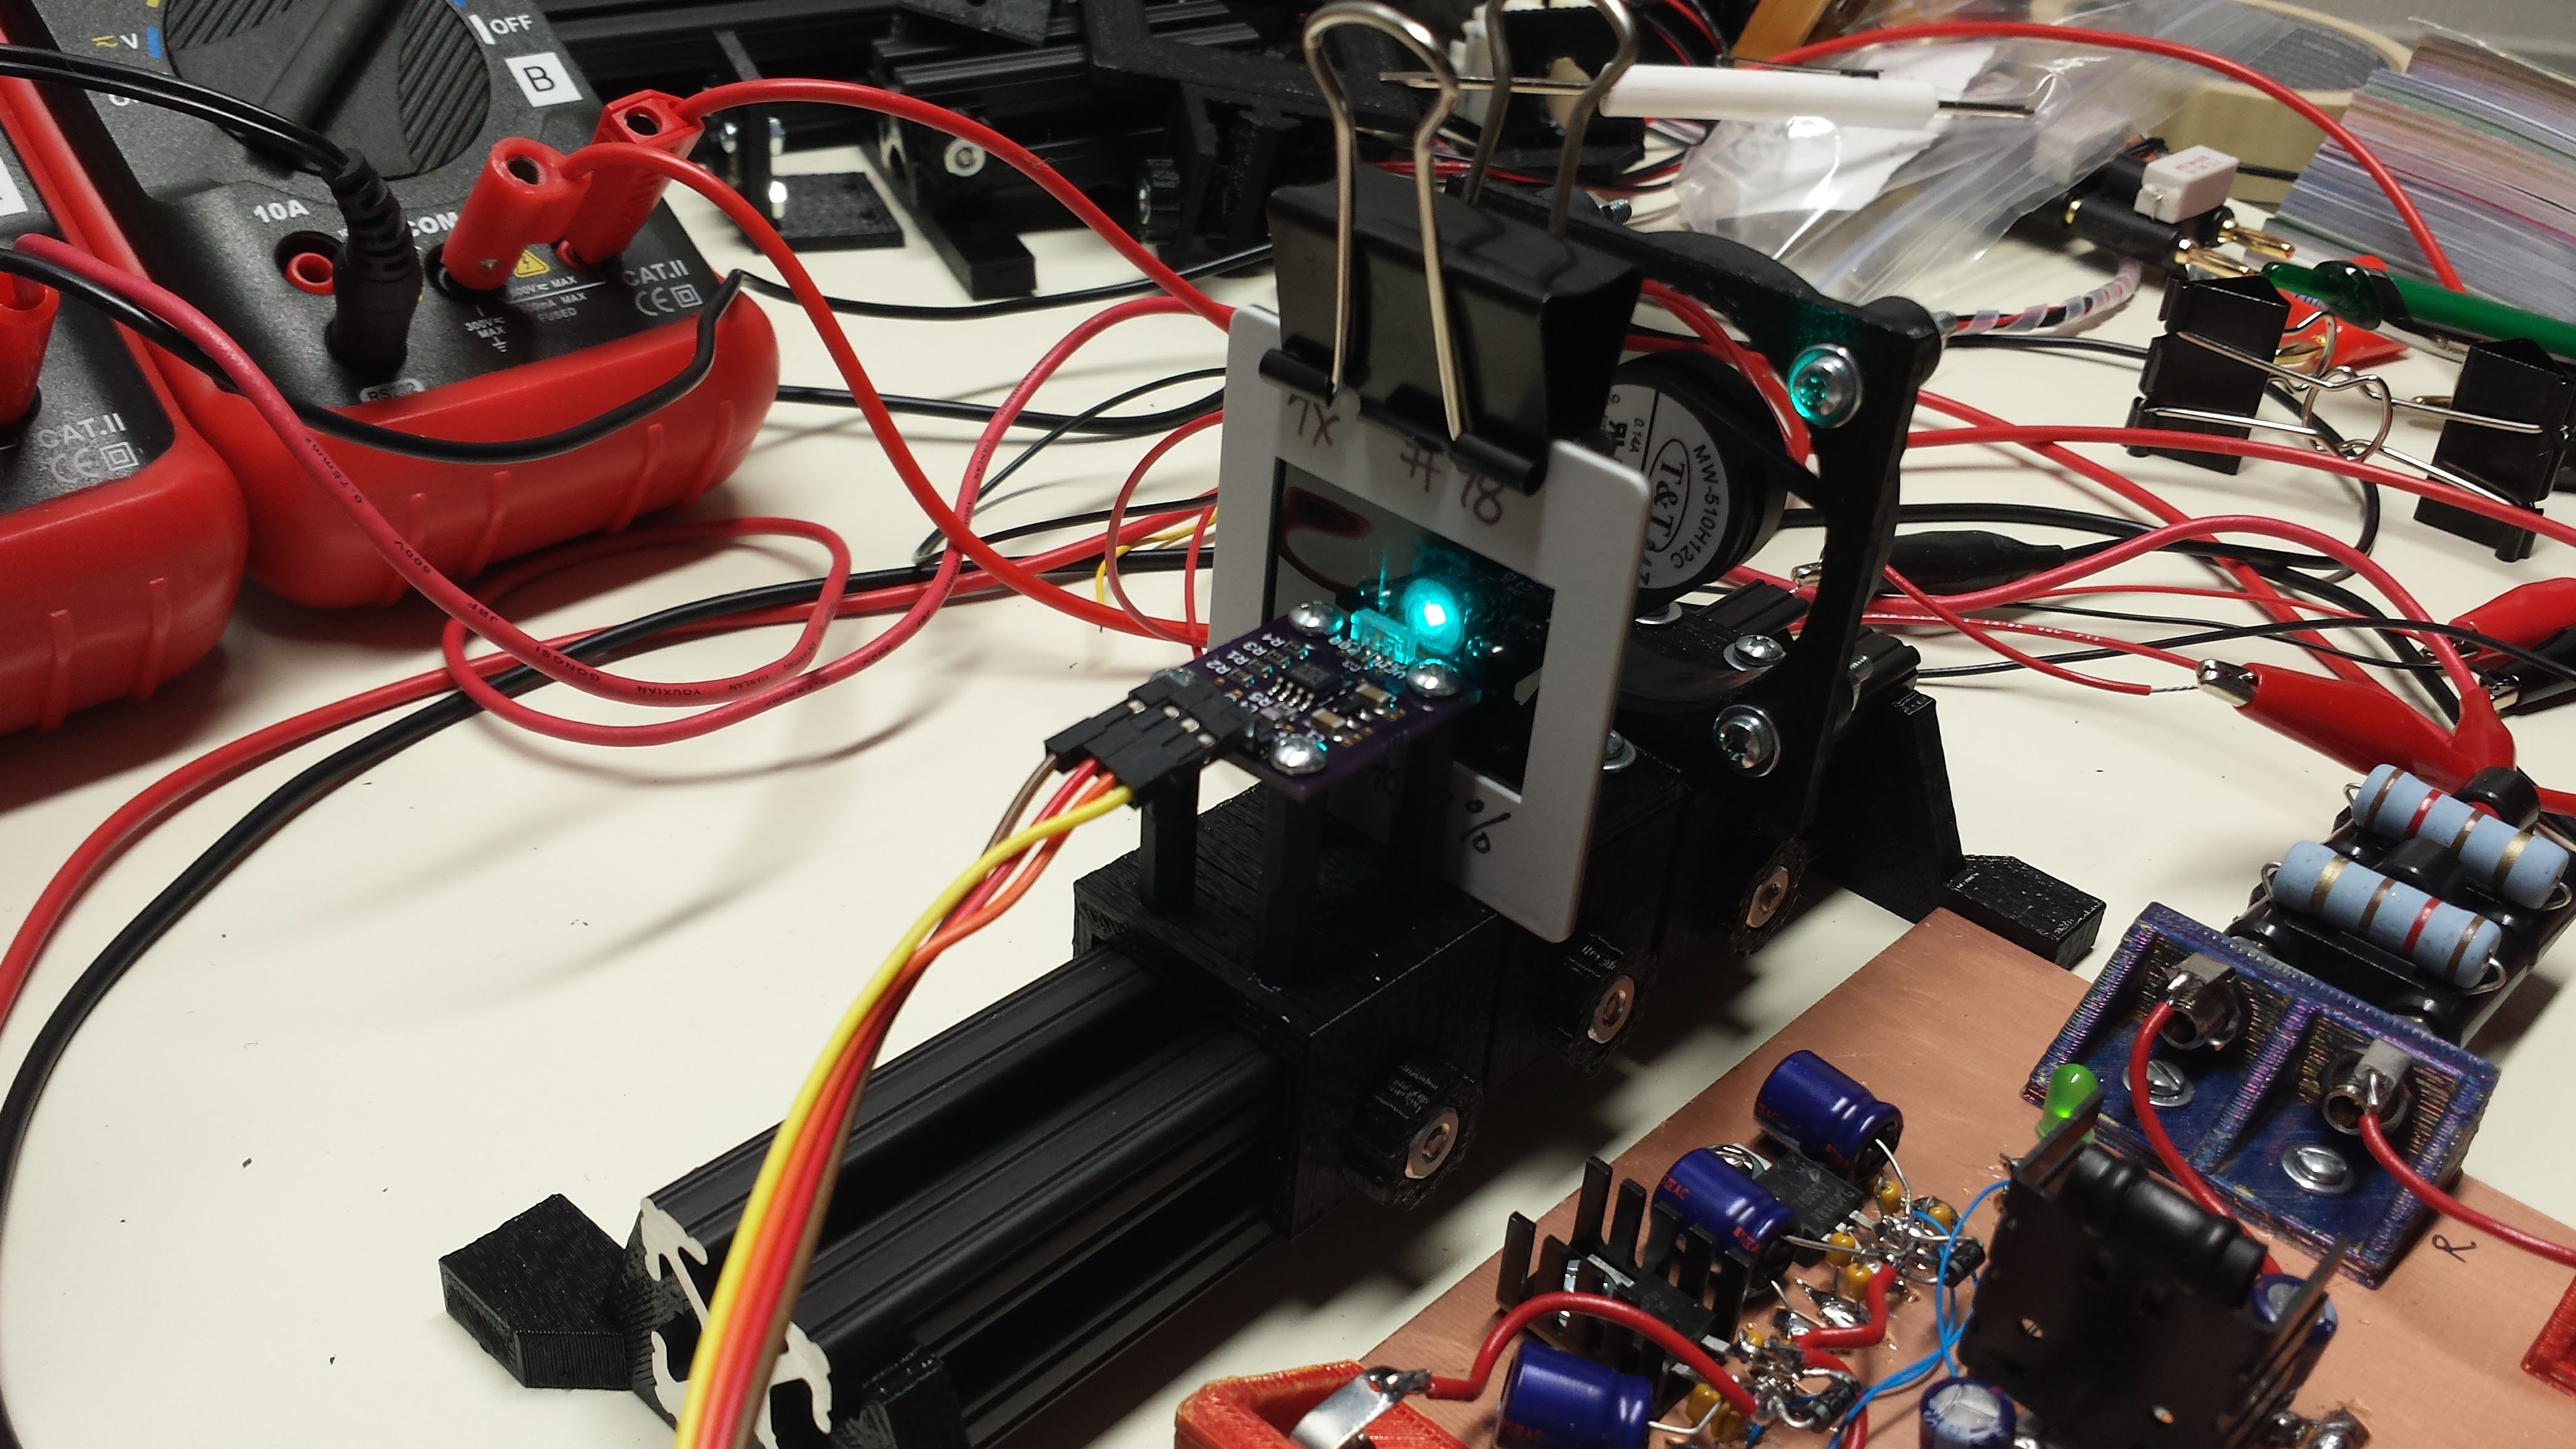
Of course, since the filters are made for photographic lighting, they have a fairly wide tolerance - it's actually unspecified. I figured I couldn't count on knowing the absolute transmittance of the filters, but probably could rely on a consistent transmittance of sections of filter cut from the same area of the same roll. I made up some filters by stacking a variable number of sheets of either 97 or 98 filter material in 35mm slide mounts (what else can I do with my old slide mounts in 2016?!):

I marked the mounts with the expected nominal transmittance, but don't rely on this estimate in the calculations, as explained below. There are additional losses due to reflections at the filter surfaces, but I figured that would also scale with the number of filters, since there remains an air gap between the sheets. To test the sensor, I mounted a bright LED as close as I could and still slip a filter in between (the LED is dimmed significantly for this photograph):
Given a stack of k filters, each with transmission T, in front of a light source of intensity I, we expect to measure an intensity, y:
taking the log of both sides, we get:
so, if we plot the detected intensity on a log scale against the number of filters, we should get a straight line whose slope is the log of the individual filter transmittance - we've measured the filter and tested the linearity of the sensor all at once. Here's the plot for #97 filters:
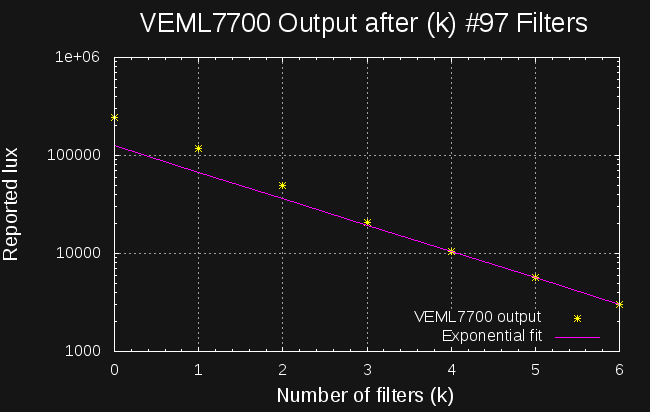
The magenta line is a best exponential fit (using the octave function expfit()) just using the final three data points (k=4,5,6). This is the region where the uncorrected VEML7700 is supposed to be linear, and although you can't tell too much from a fit of three points, it's not obviously wrong. The slope of the fit line reveals an estimated transmittance of 53.8% for each filter, which seems reasonable for these sheets specified at a nominal 50% with no given tolerance. Assuming the sensor is accurate at low lux values, this plot shows the problem - even with the polynomial correction factor suggested in the application notes, the sensor is inaccurate at high light levels. With the darker (25% nominal) filters, I produced a similar plot again showing deviation from linearity above 10,000 lx. At first glance, the non-linearity might not look too bad, but don't be fooled by the logarithmic y-axis; at the peak of 241 klx, there is an estimated 45% error in the reported value - and the LED curves above involved lux levels more than twice that. Obviously, I'm way off the datasheet here, so I really shouldn't complain, but I will anyway.
Actually, without the correction, the sensor underestimates the incident flux, and the specified correction boosts the reported value for high light levels. The suggested polynomial is:
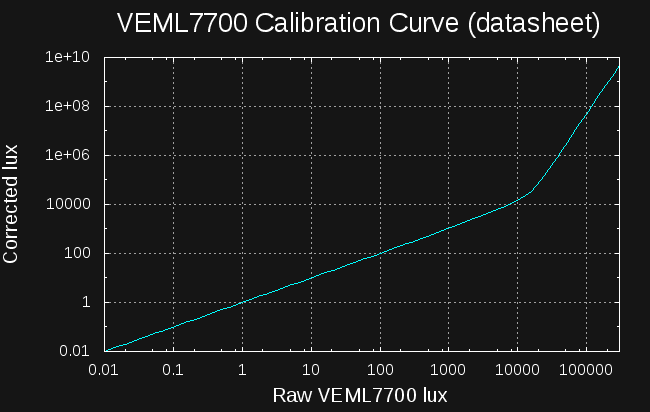
The curve really takes off at around 10,000 lx, right where the non-linearity shows up in my tests. Polynomials, being what they are, often blow up just outside the "valid" range over which they were fit. It appears that's what is happening here.
The Real Curves
I moved the sensor farther from the LED to reduce the light intensity and re-ran the data (I actually re-ran the original data also to ensure everything else was identical). Here's the plot at a "medium" sensor distance:
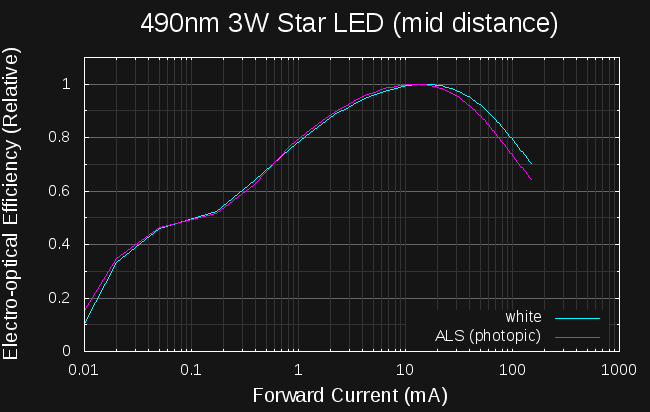
in this data, the maximum lux detected by the sensor was around 13,000 as opposed to the over 500,000 in the "close" distance data. Moving the sensor a little farther away keeps the data under 5,000 lx:
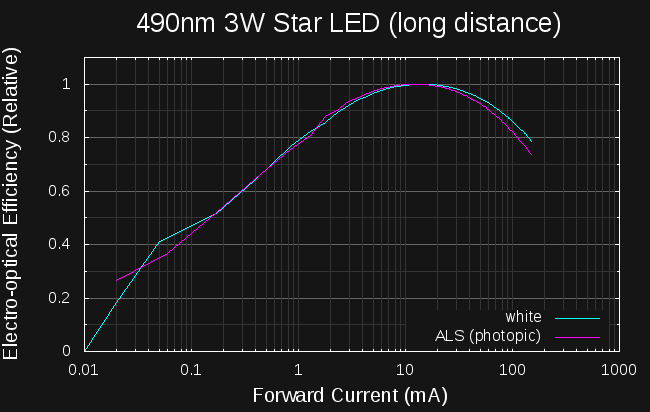
the curves near the peak are nearly identical, and the peak is in approximately the correct place based on comparable LEDs, but the curves have different slopes at high current. This is troubling because the difference in slope is opposite to what I would expect - if higher lux values are over-estimated, the closer sensor should show greater efficiency at higher currents, not lower. It may be that mid-level lux values are under-reported by the sensor.
One good sign from these new plots is that the curves from the "white" and "ALS" (photopic) sensors are now very close - there's a slight shift in the peak efficiency, which we'd expect to be from the LED blue-shift at high currents moving the LED spectrum away from the peak photopic sensitivity.
Lessons Learned
I think I was over-confident in the VEML7700 sensor. It's really not designed for this type of application, but the price and ease-of-use hooked me. Clearly, there are issues somewhere. I need to double-check my driver code to make sure I am applying the correction factor properly. Assuming I find no obvious mistakes, there seem to be a few options for moving forward.
I could try to calibrate the VEML700 myself, although doing this properly will take some thought. While using theatrical lighting gels as a quick sanity check is OK, I'd hardly trust them for calibration.
Keeping the sensor far away from the LED seems to cure the problem, and the software could simply raise a warning if the detected lux exceeds some threshold. Unfortunately, this eliminates a large part of the dynamic range of the sensor, negating one of the main benefits of this part.
I could build my own sensor with a photodiode and op-amp - I've done similar things before, but while a basic sensor isn't difficult to get working, one with such a wide dynamic range would take some careful design to get right.
Discussions
Become a Hackaday.io Member
Create an account to leave a comment. Already have an account? Log In.
over 500,000 !!!!!!!
(sorry, I had to do it)
Are you sure? yes | no
Yep, five suns worth. Don't stare into the LEDs...
Are you sure? yes | no
(it was a DragonBallZ reference, sorry /o\ )
Are you sure? yes | no
I'm sure those in-the-know enjoyed it...I'll have to look it up; this particular piece of culture somehow escaped me :-)
Are you sure? yes | no
you don't know what you don't miss :-P
Are you sure? yes | no