Ted Yapo
-
Sensor Board, Software, LEDs and Lasers
08/10/2016 at 04:48 • 0 commentsVEML7700 Sensor Board
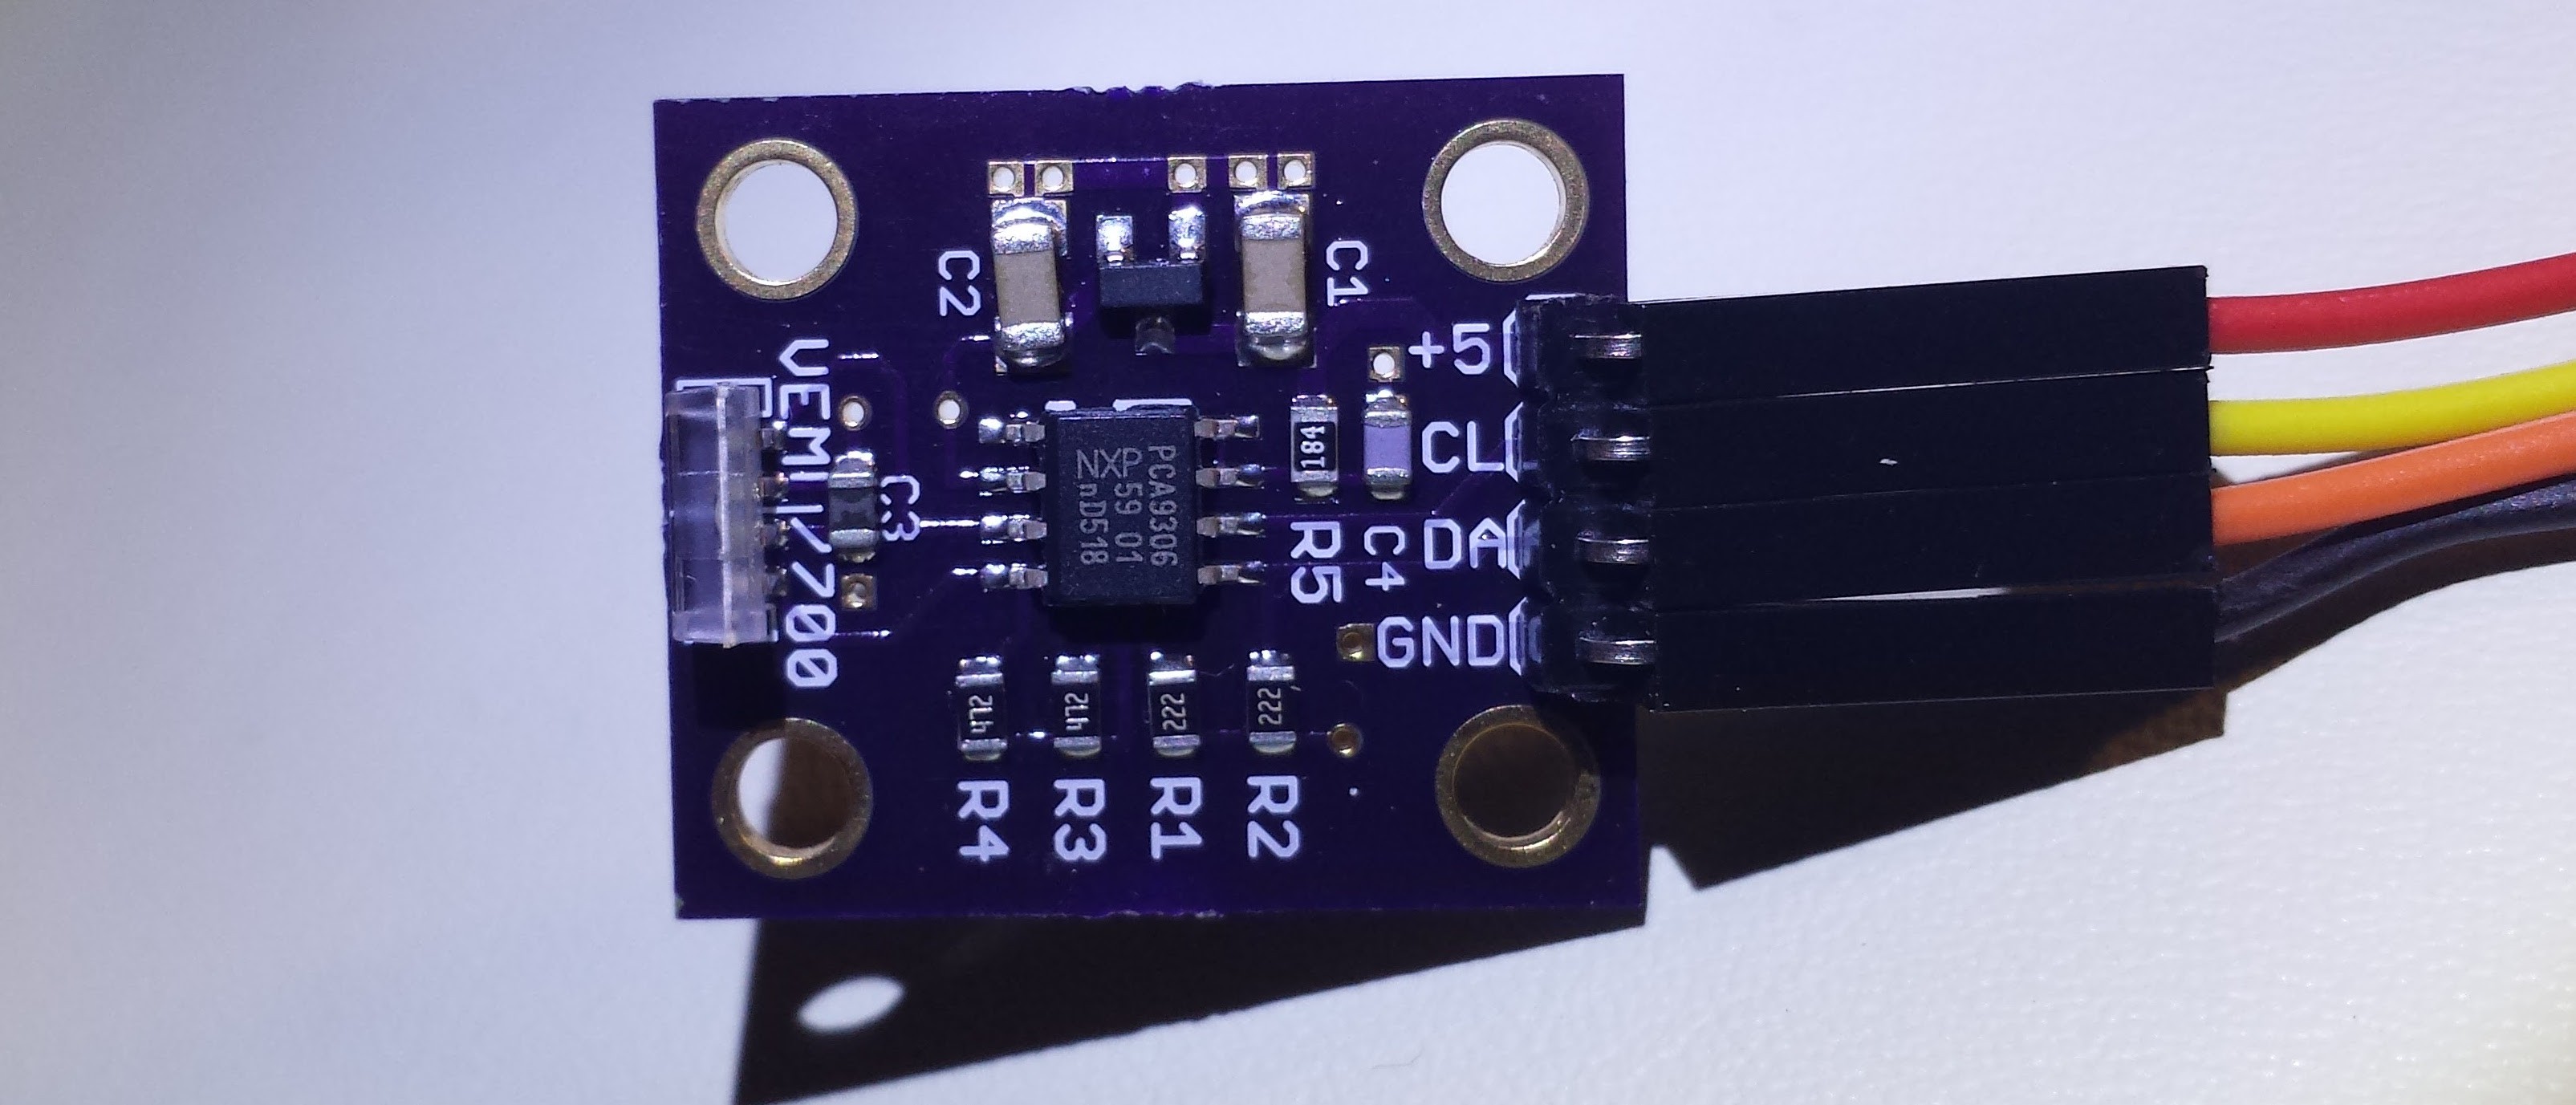
I received the light sensor PCBs from OSH Park and populated one to test it out. The sensor itself is in the clear package on the left side of the board.
![]()
Here's the schematic (click the image for an easier to read pdf version):
![]()
The design is basically my take on a breakout board you'll eventually be able to buy from your favorite two breakout-vendors before they're undercut by ebay. It's just the sensor, a 3.3V regulator, and a PCA9306 I2C level translator so that the interface is all 5V. There's not much to it; it's just meant to hold the sensor inside the test assembly. You can get the Eagle design files from the GitHub repo, or order boards from OSH Park.
To test the sensor and board out, I wrote an arduino-compatible library for the VEML700. It lives in its own GitHub repo, and supports all the features of the part, including polynomial non-linearity correction and an auto-ranging algorithm described in a Vishay application note
Testing LEDs
I started this project because I needed to measure some LEDs and laser diodes, so I had a number of tests in mind once the sensor was up and running. First up, I tested an LED for the #TritiLED project. I made a simple manual I/V curve tracer (which I'll discuss in the next log) and used it to drive the led-under-test coupled to the sensor with a 3D-printed mount. Here are the results of today's measurements.
![]()
![]()
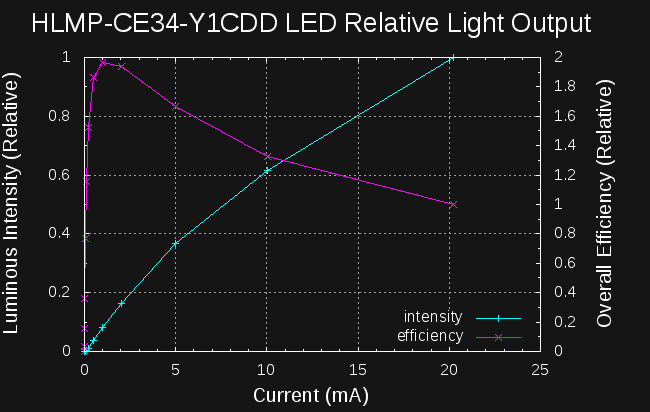
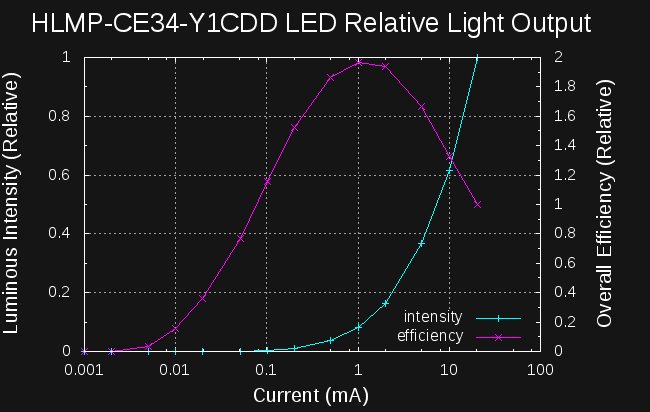
I showed similar plots in a #TritiLED log, but these have been re-tested using using an improved auto-ranging algorithm. The data in these two plots is the same except for logarithmic current scale on the right. The cyan curve in the left image clearly shows the intensity "droop" with increasing current. The magenta curve represents the overall relative efficiency of the LED at converting electrical power into light. This particular LED, specified for use at 20mA, is actually 2x as efficient at 1mA. More interestingly for glow marker use, the efficiency at 1mA is more than 10x the value at 10uA. To sell smaller dies (and save money), vendors spec their LEDs at currents much higher than the maximum efficiency point, so you'll rarely see curves like this in the datasheet, and you can't rely on the nominal current ratings to know how to drive the LED most efficiently. If you want optimum efficiency, you have to measure the LEDs yourself. But, collecting this data manually is a pain in the ass! Automating the process will simplify my life considerably: I have about a dozen different LEDs at this point that I need to assess for use in glow markers.
Testing Lasers
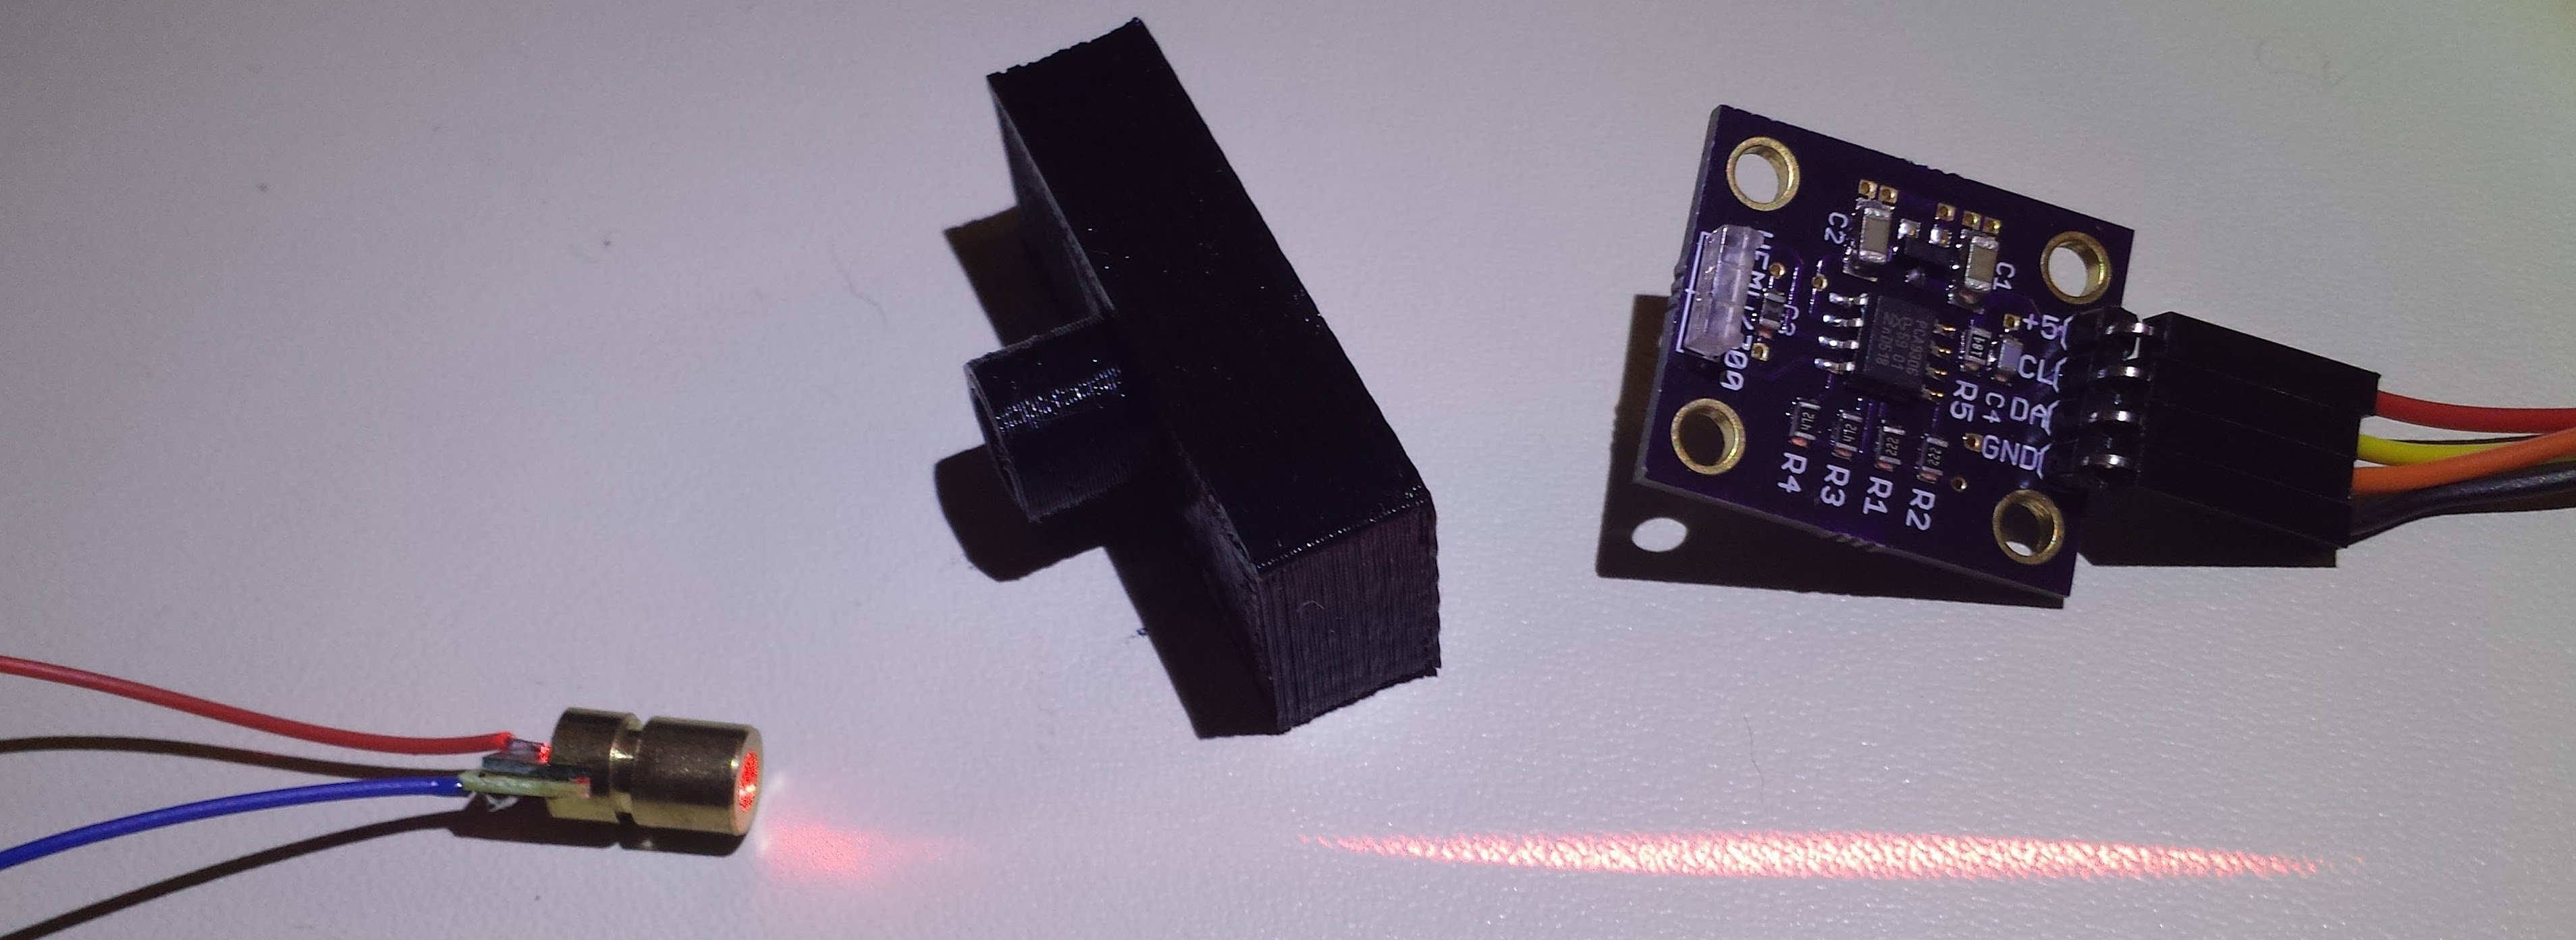
I found some cheap laser diodes on ebay, and described them in a build log for my mid-air laser image display project. In the first phase of that project I need to quickly switch the lasers with a PWM signal, and will eventually need to drive them linearly. As you might expect, there was little data supplied with the LEDs from the ebay transaction. All I knew was that they were supposed to be driven from 3V, and output 5mW. Driving laser diodes can be a tricky business because they are easily damaged by over-current: the beam intensity inside the die is many times that escaping from the front facet, and can damage the diode at higher currents. In order to design a driver for these diodes, which don't contain feedback photodiodes, I needed to know more about them: where was the lasing threshold, how linear was the optical output with current in the lasing region, and how far could I push them before damaging the die. To find out, I tested one with increasingly higher current until it was damaged. Here's the laser, 3D-printed mount and sensor:
![]()
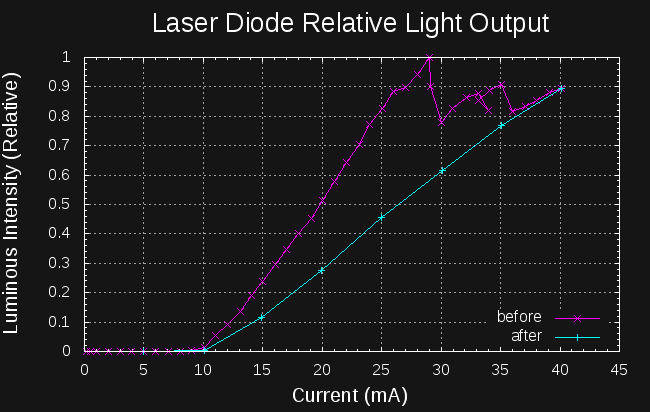
And the data I collected:
![]()
At the rated 3V, the diode draws 15.93mA. There is a 33-ohm resistor built into the diode package; I bypassed it for these measurements. The diode emits some very weak beam below 10mA (the lasing threshold) - this beam shows very little speckle, probably because it's mostly from spontaneous emission. Above the lasing threshold, the diode gets dramatically brighter and the emissions show clear speckle patterns. From 10mA to about 25mA, the beam grows fairly linearly with current. Above 25mA, funny things start to happen, as shown in the graph. As I increased current, the output would begin to drop. I let the output stabilize, then increased the current some more, raising the output until it dropped again. I repeated this until 40mA, then took a number of data points with decreasing current (cyan line). It's pretty clear that the drops in output were showing progressive damage to the laser die; after this over-stress, the diode emits about half the light it did before. I ran this experiment with two samples of the diodes, and saw the same pattern in both cases. These measurements can now inform a driver design (I'll probably stay between 10 and 20-25mA).
Next Up
I made a simple manual tester to drive the I/V curves for these measurements. In doing so, I learned some more about what I really want in the automatic version; time to reflect on the original design ideas.
-
High-level Design
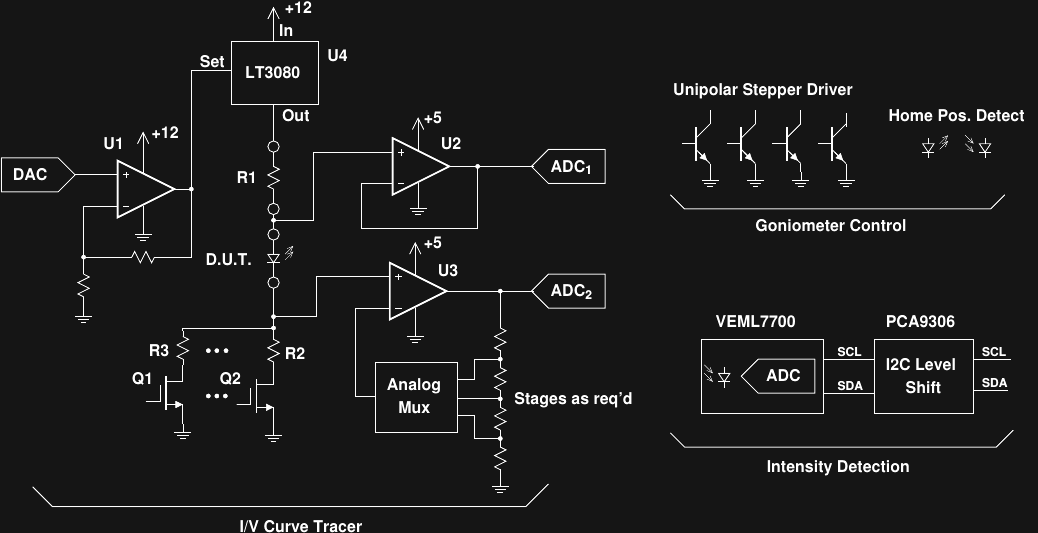
08/03/2016 at 03:18 • 3 commentsHere's a digram of the more detailed system-level design. This isn't intended to be a complete schematic; small details have been omitted.
![]()
Electrical Subsystem
I've chosen to use a PIC16F1778 microcontroller for this project (not shown). The '1778 has 10-bit ADC and DAC capabilities and on-chip voltage references. Communication with a controlling PC will be over a serial connection using a USB/UART bridge. Data analysis and plotting functions will be programmed in python on the PC side.
The electrical measurement system is driven with a pseudo current source consisting of U4 and R1. U4, an LT3080 variable regulator, serves as a current-limited and thermally-protected variable voltage source driven by the PICs DAC. U1 provides some gain to boost the range of the DAC output. R1 is selected by the user in accordance with the expected current range: since no measurements include R1, no special tolerance parts are required.
A set of switchable current-sense resistors (R2, R3, and possibly others) are selected with ultra-low-Rds MOSFETS driven from PIC output pins. The wide current range (100uA to 1A full scale) necessitates using a selectable set of sense resistors to maintain accuracy. The voltage drop across the resistor(s) is detected with U3, an inexpensive auto-zero op-amp. The gain of U3 is selected using an analog multiplexer and a resistive divider chain. A 10-bit ADC on the PIC captures the current measurement.
The voltage drop across the DUT is buffered by U2 and read by a second PIC ADC channel.
Optical Subsystem
In the past, I've designed optical sensors like the one required here with photodiodes and transimpedance amplifiers made with precision op-amps (including one design just a few months ago). This time, I'm going to try something different. Perusing the DigiKey catalog, I found the VEML7700 Ambient Light Sensor made by Vishay. This is a new part (2016) which doesn't seem to have gained much traction in the hacker/maker community yet, but I'm guessing it won't be too long before it does. The device is aimed at ambient light sensing for automatic brightness controls on televisions and similar appliances, but the specs are excellent for my application as well. The sensor measures light levels from 0 lx to 167 klx with 0.0036 lx resolution. For reference, Wikipedia lists the illuminance from the full moon as 0.27-1.0 lx and direct sunlight from 32-100 klx. The part contains an integrated 16-bit ADC, and reads data out over I2C. All this for $1.94 (single-quantity pricing). It actually contains two sensors - one closely matched to the human eye response (photopic vision), and one with a broader (white) spectral response. Ratios of the two responses may provide some small measure of emitted spectra.
Angular Subsystem
To measure the angular output distribution from the DUT, I intend to rotate it through a series of angles using an inexpensive 28BYJ-48 geared stepper motor. At each angular position the intensity will be recorded by the fixed position sensor. Since the gear train on these steppers is plagued with backlash, the motor will be driven in one direction only, and "home" position will be detected by a simple optical sensor. I envision a simple screw-terminal mount for through-hole LEDs and laser diodes, and a set of carrier boards for common SMD LED packages to attach the DUT to the motor shaft. Being a unipolar stepper motor, the 28BYJ-48 can be driven with four NPN transistors controlled by PIC output pins.
Next Up
I've ugly-prototyped a light sensor with the VEML7700, designed a PCB (now in fab), and written an arduino-compatible library for testing it.
Automated LED/Laser Diode Analysis and Modeling
Analyze LEDs and LDs to create electrical (SPICE) and optical models.