 helge
helgeI must confess I haven't spent much time looking at NTC curves before. My prior knowledge was that they are somewhat ill-defined and can only deliver reliable measurements when calibrated individually.
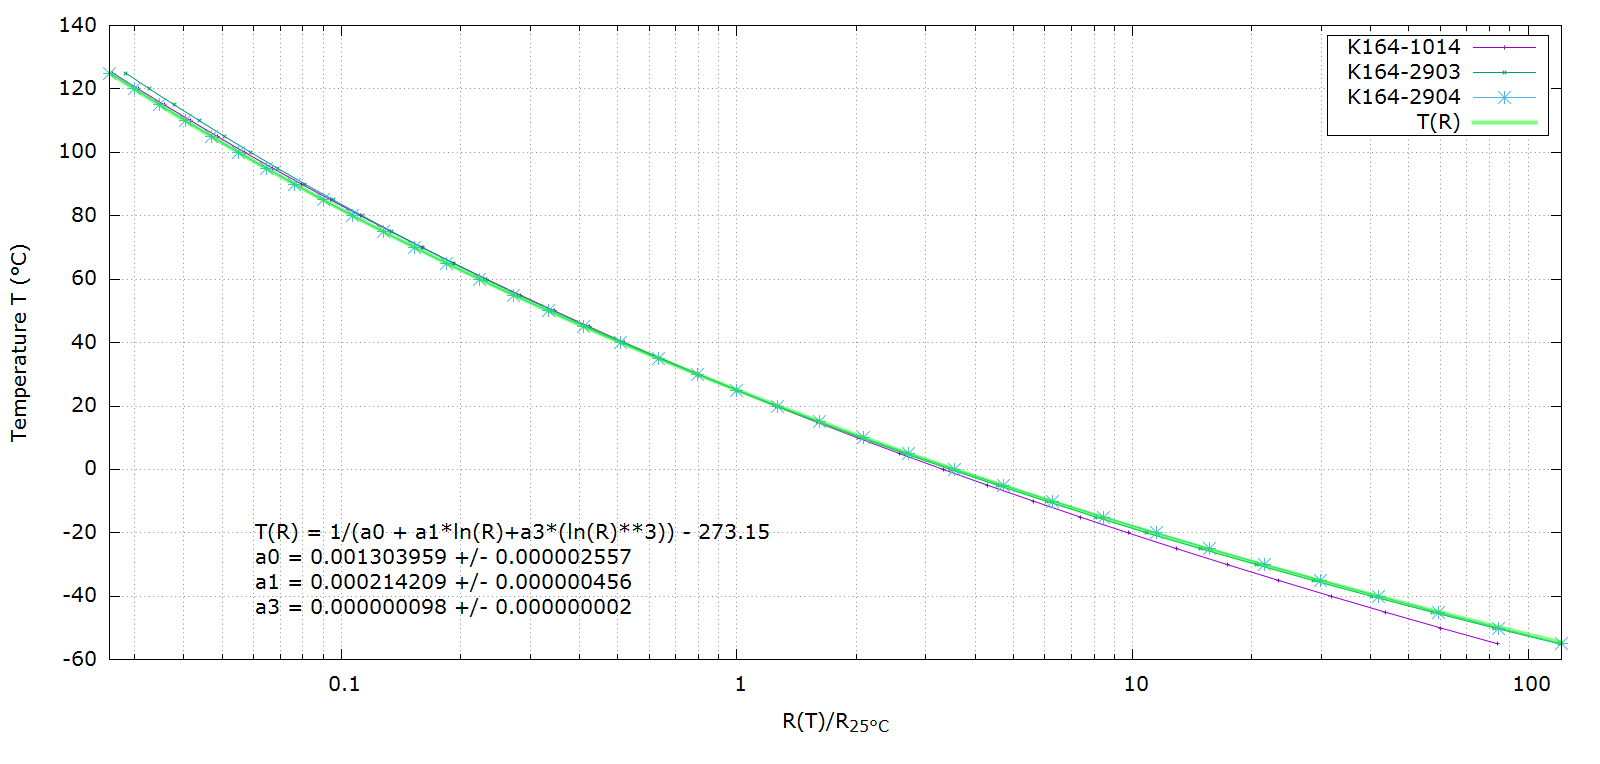
The temperature characteristics of NTCs can be fitted using the Steinhart-Hart (S-H) equation to a practical degree of precision:
https://en.wikipedia.org/wiki/Steinhart%E2%80%93Hart_equation
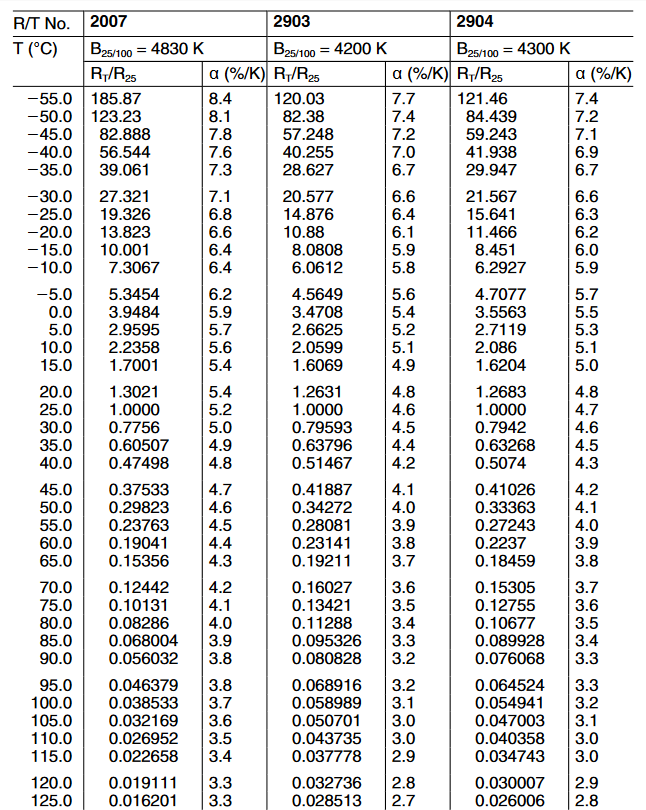
As it turns out, I seem to have bought 10k NTCs of the K164 type and I don't know their R/T number. Apparently they're made by EPCOS / TDK and offered in a whole array of curve shapes / coefficients.
https://en.tdk.eu/inf/50/db/ntc_13/NTC_Leaded_disks_K164.pdf
https://en.tdk.eu/download/531152/71487ad65dd78f1844cf52efcee5836d/pdf-rt.pdf
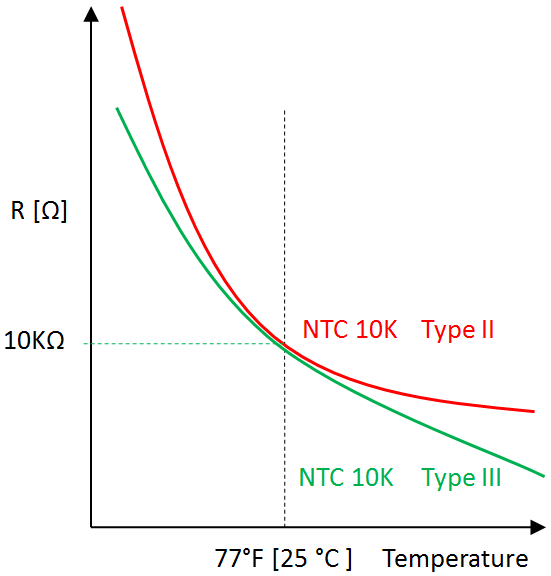
At first glance, 1014, 2903 and 2904 characteristics seem to match the quick&dirty calibration values:
- 33.6 k (sensor in plastic foil, dipped into ice slush, ~1..2°C)
- 10.0 k (nominal at 25°C)
- 0.62 k (sensor in plastic foil, dipped into boiling water ~98°C)
Mouser only seems to stock B57164K0103K052 which is listed as having the 2904 characteristics (from EPCOS/TDK datasheet above), and the datasheet only states 2904 for the 10k type.
The Steinhart-Hart-coefficients can be fitted after some OCR gore as follows:
Final set of parameters            Asymptotic Standard Error
=======================            ==========================
a0              = 0.00130396       +/- 2.557e-006   (0.1961%)
a1              = 0.000214209      +/- 4.56e-007    (0.2129%)
a3              = 9.80175e-008     +/- 1.801e-009   (1.837%)

correlation matrix of the fit parameters:
                a0     a1     a3
a0              1.000
a1             -0.991  1.000
a3              0.935 -0.968  1.000
note that the S-H equation needs absolute resistance in Ohm.
There was also an error in prior graph formulas... but now the temperature calculation looks much better:
I could in principle take one of the NTCs to work and properly characterize it over its temperature range against a known PT100 element but for the sake of brevity I'm inclined to trust the datasheet values to within 2 Kelvin.
Discussions
Become a Hackaday.io Member
Create an account to leave a comment. Already have an account? Log In.