 Kris Winer
21 June 2018
I completed the Arduino sketch faster than I expected. I have everything working except I can't seem to get the interrupt to work. I will eventually.
Edit: It helps when you don't forget to declare the interrupt pinMode! Interrupt working now...
For the moment I am polling the data ready bit in the configuration register. I am updating the Arduino sketches I am using on github. I am reading the 18 data channels, both raw and calibrated, using simple C++ API functions like:
  AS7265X.readCalData(calData);
  for(int i = 0; i < 18; i++)
  {
   Serial.print(freq[i]); Serial.print(","); Serial.println(calData[i]);
  }
This makes it easy to average data, plot individual channels or all the channels at once. I might connect a Sharp TFT display and see if I can literally generate spectra but for now I am content to plot the data using a spreadsheet.
I set the broadband light source to 12.5 mA output (lowest setting), the sensor gain to 16x (default) and the integration time to 100 milliseconds and started taking spectra of the metal objects pictured below:
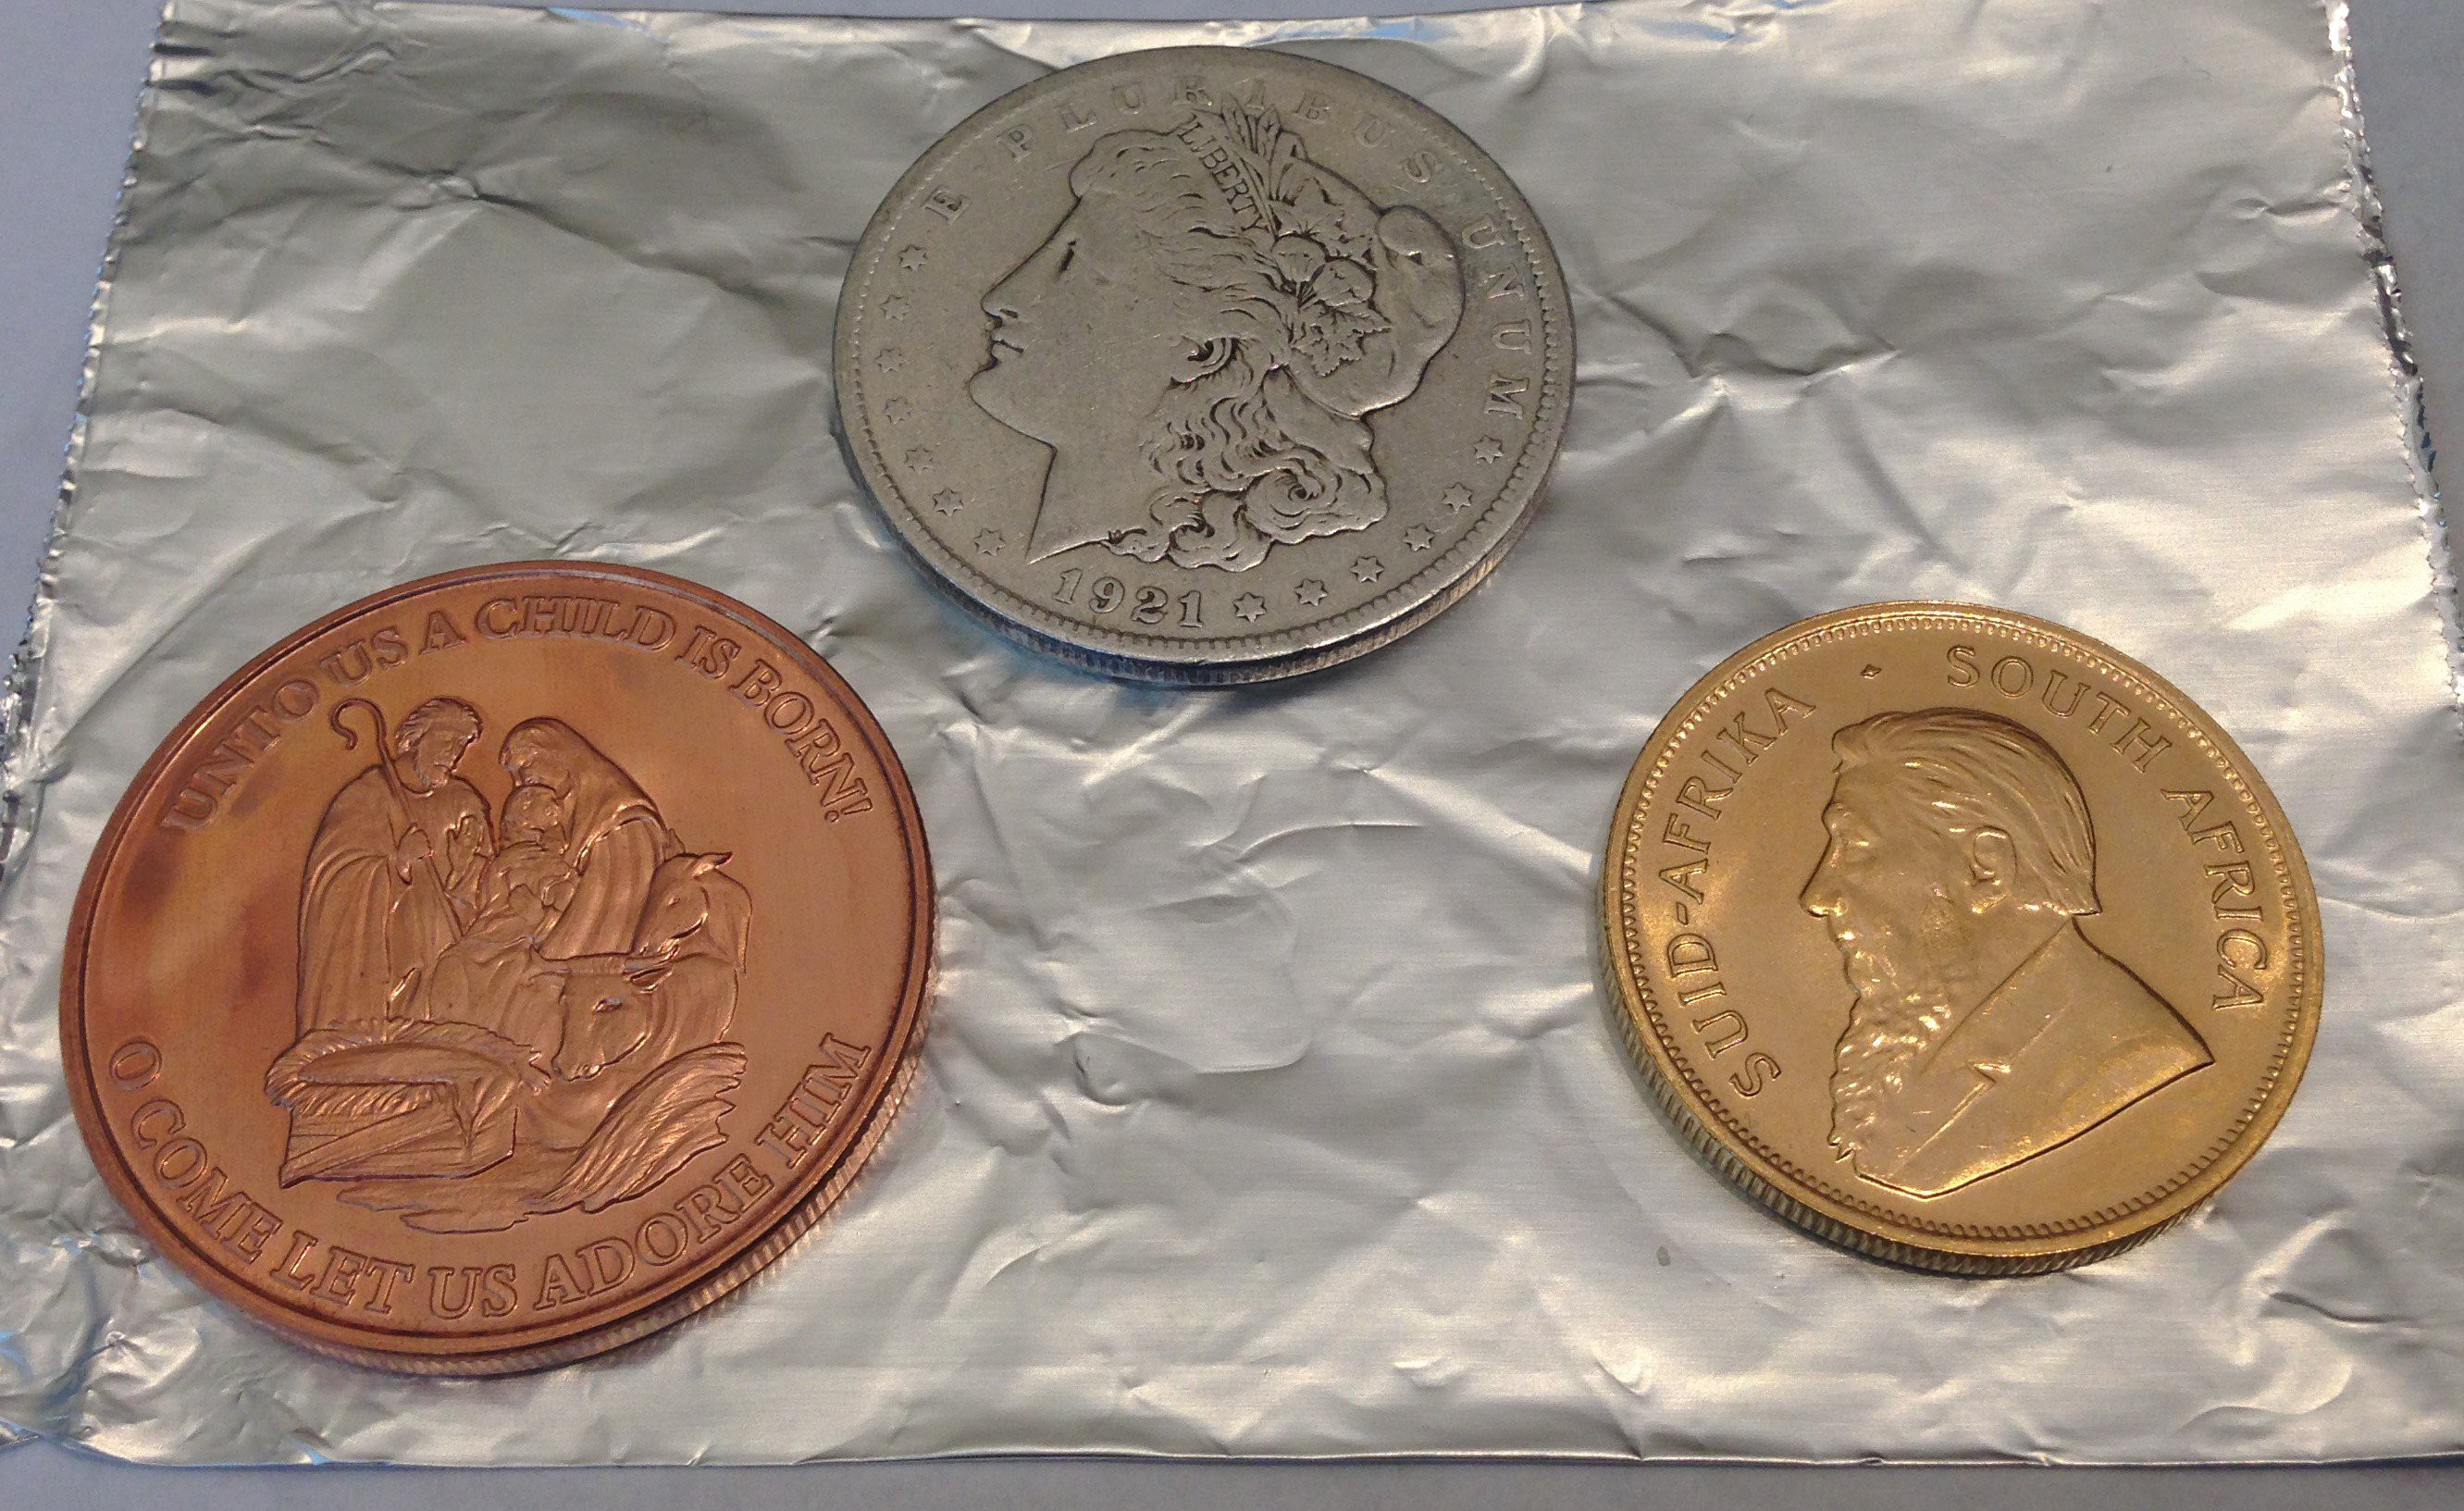
Aluminum foil, silver, copper, and gold (really 91.67% Au/8.33%Cu) coins. I held the spectrometer about 2 cm from each coin face and captured one set of data for each to the spreadsheet. I normalized the four individual spectra to one (they all had peaks at 610 nm).
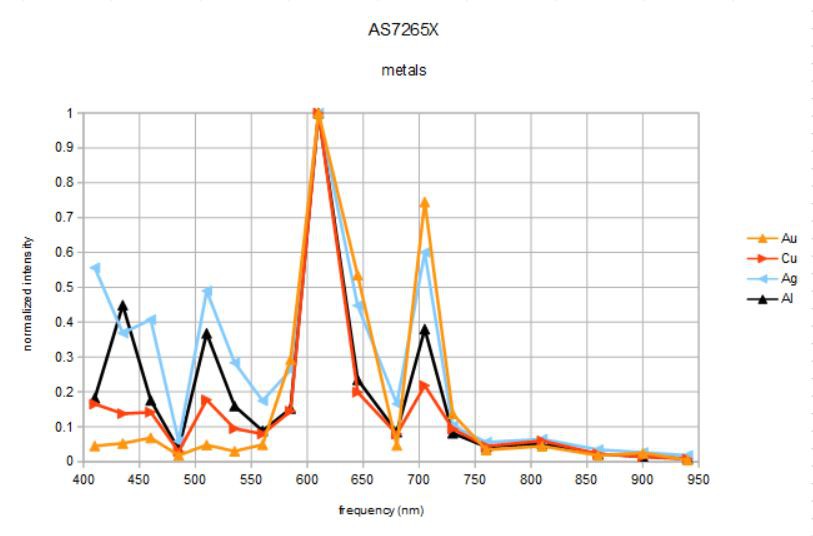
The first thing to notice is that beyond 750 nm or so there is no signal. This is because the broadband source is more or less extinguished above this frequency. I need to find a broadband source centered at about 850 nm...
Next, I haven't done any kind of subtraction. The data are not raw data but calibrated data, presumably using some sort of calibration coefficients that correct for deviations from a standard set during factory testing. This spectra is the result of using the spectrometer like a hobbyist might; turn it on, point and plot!
What can we learn from this first attempt at "material identification"?
Well, I really mean looking at spectra from similar things and asking if there is anything about the spectra that might be used to distinguish these materials? I think the answer is yes!
For example:
Gold and silver have strong signals at 645 nm that the other two metals lack, and a stronger peak at 705 nm than the other two metals.
Silver has strong reflectance at 410 and 510 nm that gold lacks. In fact, this accounts for the main difference between gold and silver reflectance and how they appear to our eyes.
Silver and aluminum have very similar spectra but silver is bluer and whiter (flatter spectrum).
Copper is dominated by the peak at 610 nm, right at the orange/red color boundary.
Here is what the "textbook" says we should be seeing:

This is reflectivity, which is a little different, but it makes it clear that the AS7265X spectrum should be affected by the spectral distribution of the broad-band source, and needs to be corrected for best comparison.
If I use the same method on white paper as my reference (I know, not an ideal reflector), this is what I get:

I am not sure what to make of the peaks at ~900 nm, probably a result of very small counts there and not significant. Now the differences in the data are even more distinct. Gold and silver have several strong peaks at 585, 645, and 705 nm. In addition, silver has a broad blue response completely lacking in gold. Copper has a broad peak between 585 and 610 nm, as does aluminum, but aluminun also has significant blue and green components with strong peaks at 435 and 510 nm that copper and gold lack. Aluminum and especially silver have the flattest spectra, meaning they appear the most white.
So, assuming such results are typical (TBD, of course) could one devise a simple algorithm to distinguish between these four metals based on these characteristics? I think maybe yes.
If dominant peaks at 585, 645, and 705 nm, gold or silver.

If also dominant peak at 485 nm, then silver, otherwise gold.

If dominant peaks at 585 and 610 nm, but not 705 nm then either al or copper.

If also dominant peak at 435 nm then aluminum, else copper.
Do the distinctions become clearer with higher intensity illumination, higher gain, longer integration times, or spectral averaging? It will be interesting to find out...
I also verified that by pulling I2C_EN LOW on the board I can no longer see any I2C device(s) on the I2C bus but if I connect SDA/SCL to Serial1 on my Dragonfly Development board I can use UART mode and AT commands just like before:
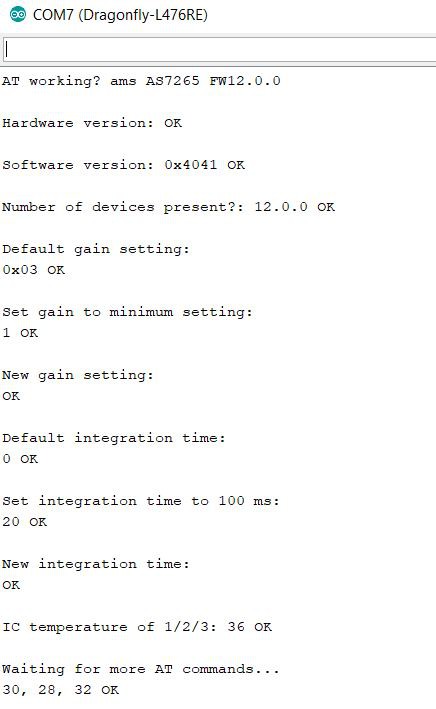
I am getting the same device type 40, and hardware version 41, software version of 12 with Patch and Build zero, even though the pokey serial output delays the output a bit.
This means the current version of the $25 Spectrometer is complete and fully functional and is operating according to design. Whew!
Now I might redesign it to make it even easier to use...
Discussions
Become a Hackaday.io Member
Create an account to leave a comment. Already have an account? Log In.
Super cool to watch your progress here!
Do you think there is a chance of distinguishing different kinds of plastic with this? Eg ABS, PETG, PP, PLA.
Are you sure? yes | no
I don't know. I think most common plastics are transparent in the near IR (< 1000 nm) but it would be easy enough to try this out.
My latest design has a footprint for an OSRAM broad band IR led which should provide good illumination between 700 and 1000 nm currently lacking in the visible broad-band source I am using. So I will be able to just test a bunch of materials and see what there is to see. I'll need a good reference, maybe just a standard silvered-mirror will do.
Anyway, it might be that common plastics have specific impurities with an absorption signature between 410 and 940 nm that could be used to identify them.
It's taken me a while just to get a working device; now the fun part of applying it to real world problems. I think what I will do, once I am happy with the design, is to have 100 made in China and sell them on Tindie. That way, anyone interested in a specific application can join in the fun!
Are you sure? yes | no
Making them available via Tindie sounds great, I am for sure interested in a couple! It fits well as a testcase for my current research, machine-learning on microcontrollers.
Are you sure? yes | no
The "textbook" plots for metal reflectance is for polished elemental metals in vacuum.
The worn silver coin is far from this standard given that it is rough (not a specular reflector) and oxidized (not elemental) and surely has dirt and fingerprint grease, etc., on its surface. Plus, I think the silver dollar is 90% silver and 10% copper. You certainly can't see your image looking into it like a mirror--this tells you its reflectance cannot be >97% over the entire visible spectrum.
But this is a good point about normalization and I have struggled with how to do this well enough. White paper is not a great choice, especially in the near IR.
I might try your suggestion and literally use a mirror. Instead of an integrating sphere, I plan to test averaging the spectra to account for changes in specular reflection when accumulating data while holding the spectrometer by hand.
I want to make the process of analyzing data simple and cheap, so no fiber optics, collimating lenses, or integrating spheres please!
Are you sure? yes | no
Yes, good point, otherwise it wouldn't stay "The 25$ spectrometer" very long.
However, my point is not so much the high reflectivity of silver, but the uniformity with which it's reflects the different wavelengths. I think the differences you see across the spectrum is an artifact.
Are you sure? yes | no
Yes, partly. First of all the "silver" spectrum I measured is for a dirty, oxidized silver-copper alloy, not elemental silver (none of the four samples are elemental). Secondly, what I am plotting is the ratio of light reflected from the silver alloy to light reflected from white paper. Thirdly, the source light varies strongly across the visible range and I am measuring one shot (i.e., measured in 100 ms) spectra; the result would likely improve with averaging and gain optimization as noted. Lastly, while I am reading the calibrated data, using calibrated values determined at the factory, there is no evidence the calibration is accurate.
Therefore, there is no reason to expect the "silver" measurement to have a reflectance of 1 across this frequency band in this experiment. Nevertheless, it has the flattest spectrum of the four metals measured, as noted.
My interpretation of all of this is that with a better reference (maybe a mirror), and optimized gain and source intensity, and some kind of averaging (all TBD) this $25 device might make an accurate reflectance photospectrometer.
It is certainly accurate enough when used in the hobbyist mode above to distinguish between different metal alloys for real, physical reasons.
Are you sure? yes | no
Looking at silver, the reflectivity should be very close to 1 (>97% for almost the entire spectrum from 400 nm to 20 µm), which is why silver is used in mirrors for many spectrometers. So your normalized spectra are probably not very normalized.
Reflectance is more difficult to measure properly than transmission/absorption, and I'm guessing this is even harder to do right with materials that can have specular reflections. Have you thought about using an integrating sphere?
Are you sure? yes | no