 Christoph
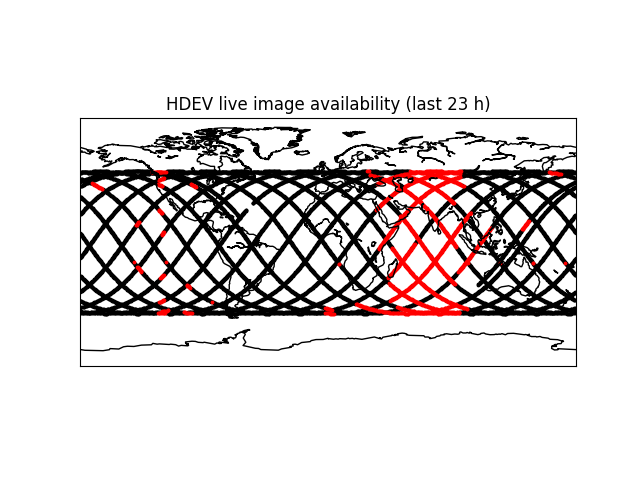
What I got (red means: no live image available at that time/location):

Apparently, the live image is more or less consistently not available between some 38° east and 95° east. That's just based on one day, though, starting from unix timestamp 1534627704 (August 18th 2018, 21:28 UTC)
How I got there:
Here's a script that, whenever HDEV live image availability data is received via MQTT, requests the current ISS position from a web service and combines that information. The result is written to stdout, from where I wrote to a file. I had this script running for 24 hours (it self-terminates after that period of time):
# http://open-notify.org/Open-Notify-API/ISS-Location-Now/

import urllib2
import json
import paho.mqtt.client as mqtt
import time

def on_connect(client, userdata, flags, rc):
  client.subscribe("iss-hdev-availability/available-bool")

def on_message(client, userdata, message):
  try:
    available = message.payload

    req = urllib2.Request("http://api.open-notify.org/iss-now.json")
    response = urllib2.urlopen(req)
    obj = json.loads(response.read())
    timestamp = obj['timestamp']
    lat = obj['iss_position']['latitude']
    lon = obj['iss_position']['longitude']

    print("{},{},{},{}".format(timestamp,lat,lon,available))

  except URLError:
    pass

client = mqtt.Client()
client.on_connect = on_connect
client.on_message = on_message
client.connect("test.mosquitto.org", 1883)
client.loop_start()
start_time = time.time()
duration = 24*3600
while True:
  try:
    if time.time() > (start_time + duration):
      break
    time.sleep(1)
  except KeyboardInterrupt:
    break
client.loop_stop()
So now we have live image availability vs location, for a 24h period. The dataset is here:
https://cdn.hackaday.io/files/14729630165536/hdev-availability.csv
(it's also in the project files)
That data can be drawn on a map. I found out that there's a map toolkit for matplotlib, and installed it. The rest is quite simple:
import matplotlib as mpl
mpl.use('Agg') # because the AWS EC2 machine doesn't have tkInter installed
import matplotlib.pyplot as plt
from mpl_toolkits.basemap import Basemap
import numpy as np

import csv

# https://matplotlib.org/basemap/users/cyl.html
m = Basemap(projection='cyl',llcrnrlat=-90,urcrnrlat=90,\
            llcrnrlon=-180,urcrnrlon=180,resolution='c')
m.drawcoastlines()

x = []
y = []
xn = []
yn = []
npoints = 0

with open('hdev-availability.csv') as csvfile:
  csvreader = csv.reader(csvfile)
  for row in csvreader:
    npoints += 1
    lat = float(row[1])
    lon = float(row[2])
    available = int(row[3])
    if available:
      x.append(lon)
      y.append(lat)
    else:
      xn.append(lon)
      yn.append(lat)

plt.title("HDEV live image availability (last {} h)".format(int(npoints*6/3600)))

m.scatter(x,y,3,marker='o',color='black',latlon=True)
m.scatter(xn,yn,3,marker='o',color='red',latlon=True)

plt.savefig('hdev-availability-map.png')
# plt.show()
In the last line you see the save-image-to-file operation, and the result is the map shown at the top and again here:
Discussions
Become a Hackaday.io Member
Create an account to leave a comment. Already have an account? Log In.