 Walter Dunckel
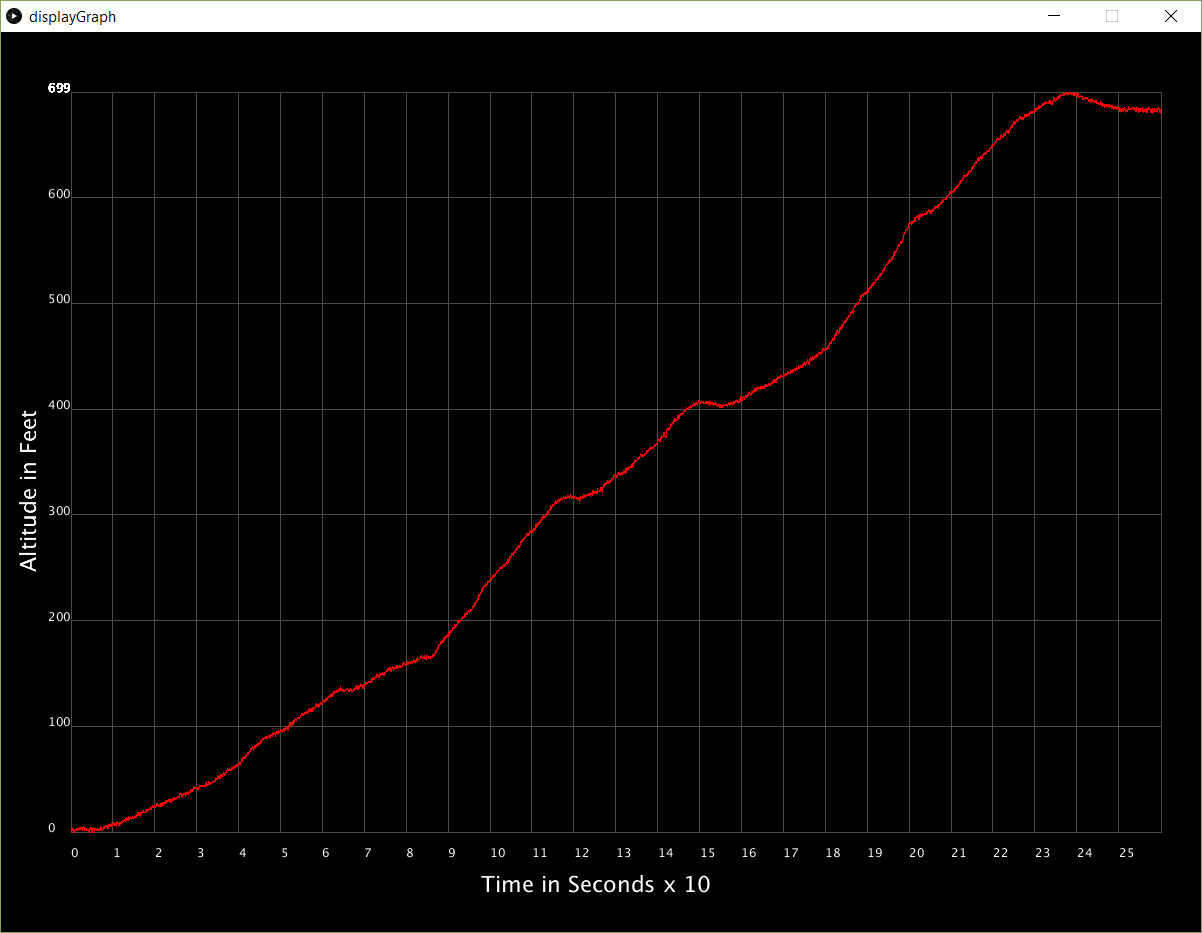
Spent some time getting graphing working to read altitude from a sample csv file containing over 26,000 altitude data points. The csv file was collected by my hardware, and logged using my laptop while driving over a hill. After pulling my hair out for a while, I realized processing did not like the spaces between the data points. I edited them out, and will be changing the firmware so it just sends a comma between data points, with no spaces. I was a little worried that processing would be bogged down with so many samples, but I guess this is the type of thing Processing is made for.
Spent some time getting the graph to be happy with different size windows. So it is semi adjustable - just did not adjust font size. More of that could be done later. I tried to comment the code as much as I could to help me understand what it was doing. One of the things that first screwed me up was that the Y values of the graph are inverted. 0 is at the top, and the maximum is at the bottom. One of the neat things that processing has is a map() function. This places your value on the graph in the correct relative position, regardless of changes of window size.
Files are here: https://github.com/radiohound/NXPMotionSense/tree/Rocketry-and-RC-Telemetry
Discussions
Become a Hackaday.io Member
Create an account to leave a comment. Already have an account? Log In.