 jean
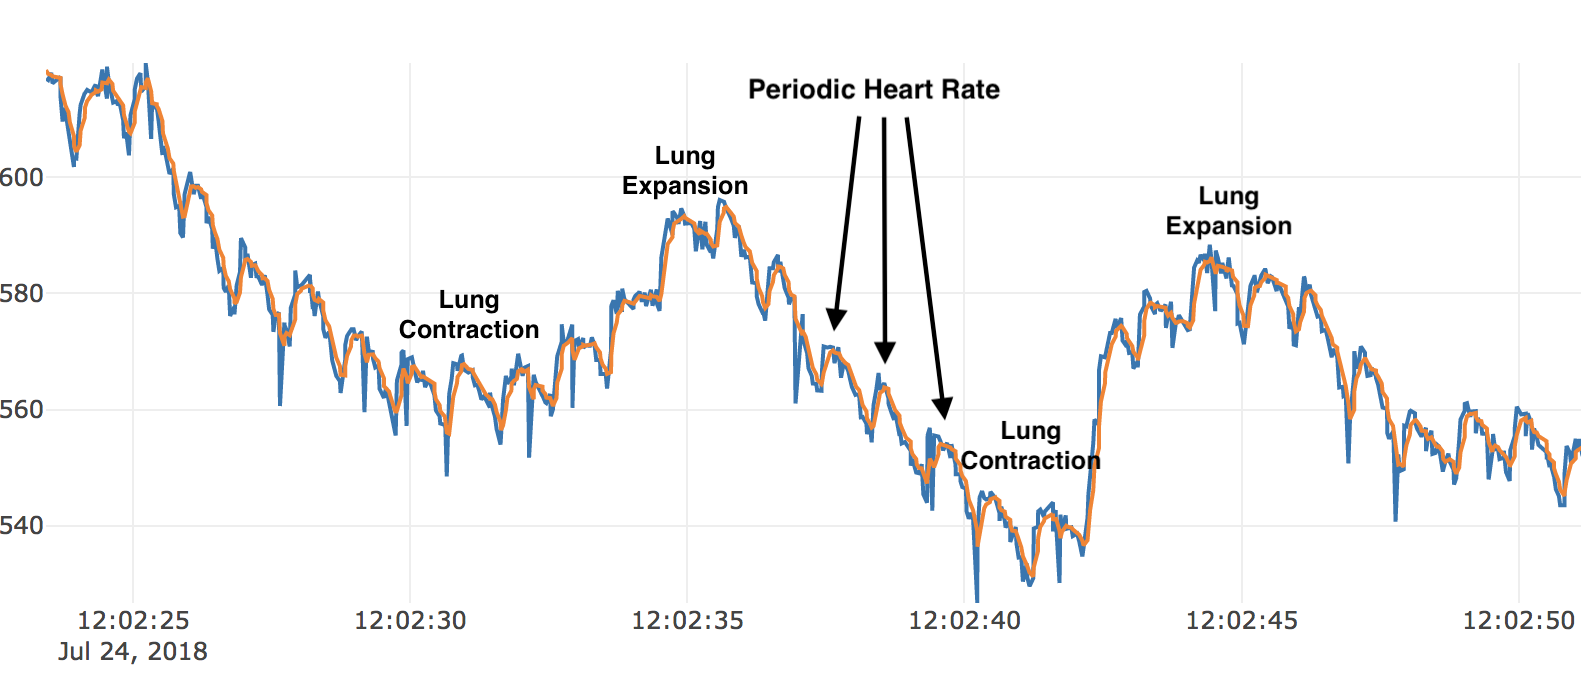
jeanWith the latest PCB revision: spectra, I can wrap the electrodes around my middle to see lung expansion as well as heart rate. Below is a time series of just 4 electrodes to show breathing in and out, as well as impedance changes due to the movement of blood through the heart.
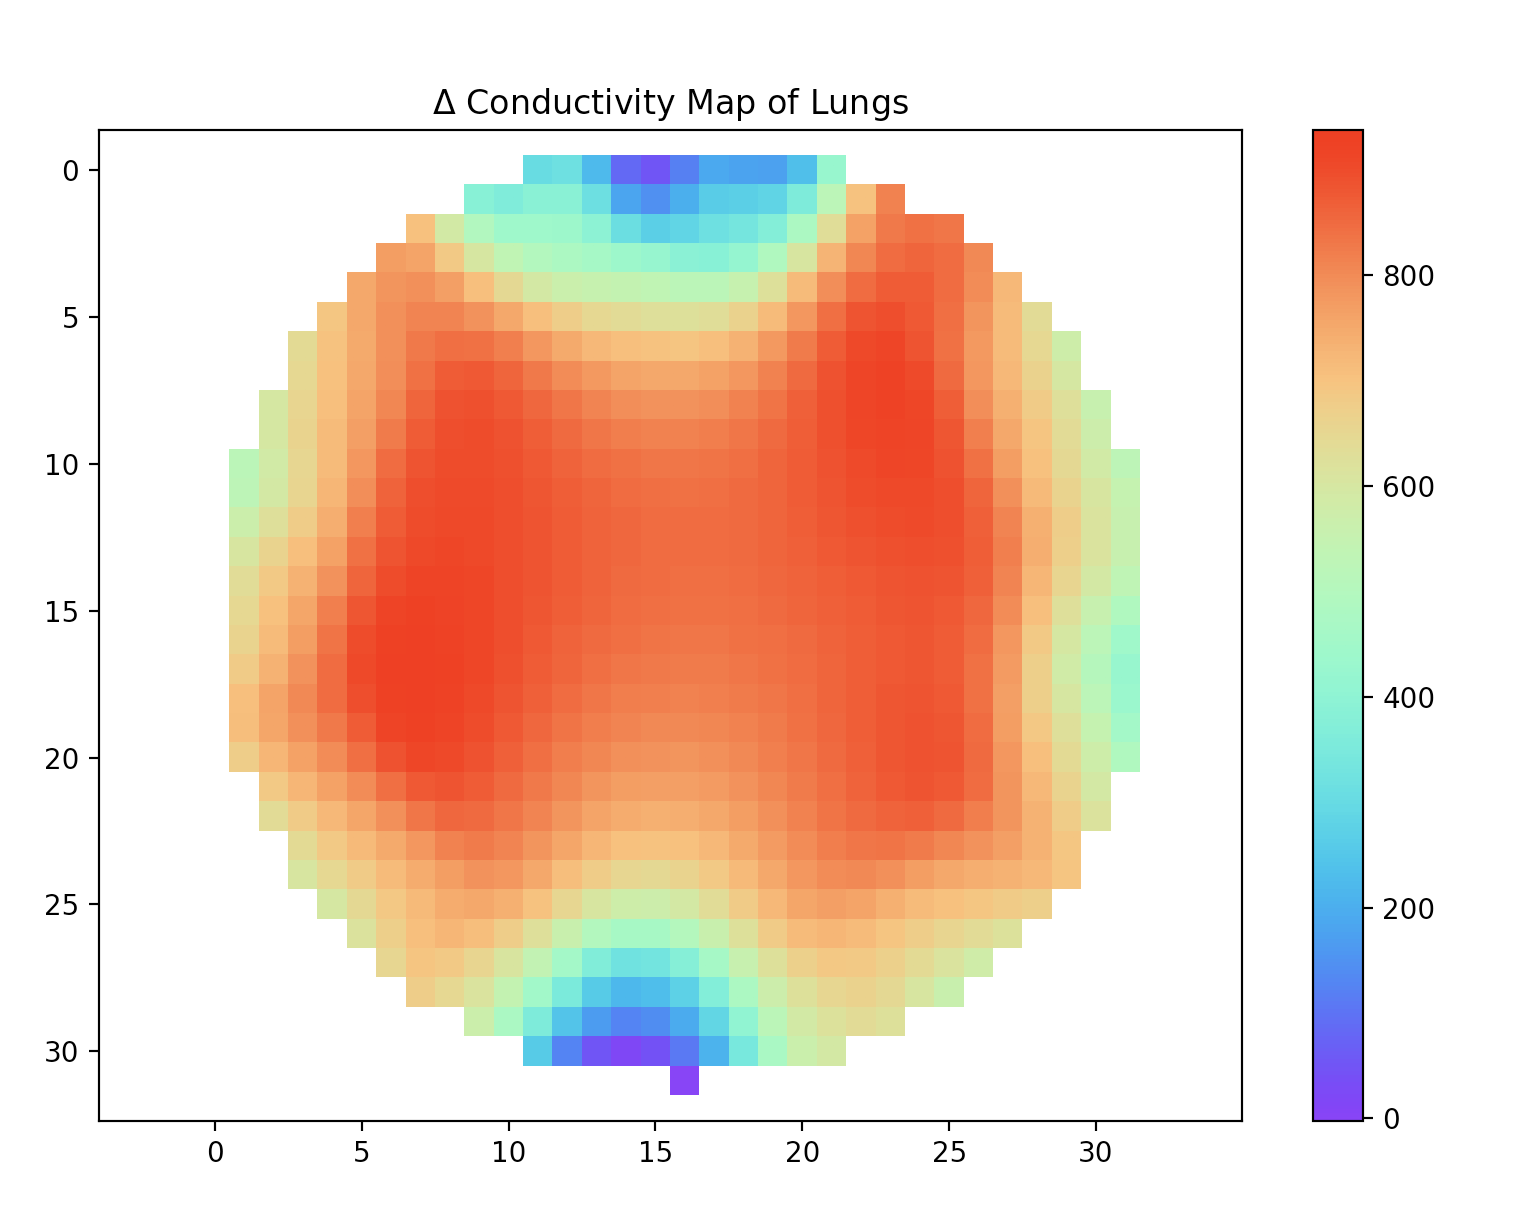
Once I'd get the time series data on my body, I went to wrap the 32 electrode cable around my thorax and used the GREIT algorithm to do a tomographic reconstruction of a conductivity map of my lungs. This is just an initial image, and you can clearly see I have two lungs! Further work could be done to refine the algorithm, and ensure the connection to my body is good but I am quite happy with this as a tomographic image reconstruction, using only 32 electrodes. In comparison, a CATSCAN typically uses upwards of 256 'electrodes' or angles for it's reconstruction, and also uses ionizing radiation. Below is the frequency at 25kHz, so it's just one frequency. With multi-frequency EIT even more information should be available.
Discussions
Become a Hackaday.io Member
Create an account to leave a comment. Already have an account? Log In.