 Chris Johnson
I'm currently working on the Python software to interface with the EC/pH/Control board and also developing the web interface.
The web interface, shown below, uses webiopi. It's fairly programmer friendly and so far has been reliable. The graph is from plotly , an open source javascript graphing library. The graphs can be zoomed and panned to look at areas of interest. A new point is added to the graph at the end of each spray cycle. The gaps in the plot are from when the control program was not running.
For testing, the spray cycles are running every minute. As you can see in the second picture, everything is sitting on my desk, so it's only running simulated spray cycles.
The approximately linear increase in conductivity over time is due to water evaporation. Since only pure water evaporates, the density of the dissolved ions left in solution increases, and that increases the conductivity.
Click here for an interactive version of the graph.

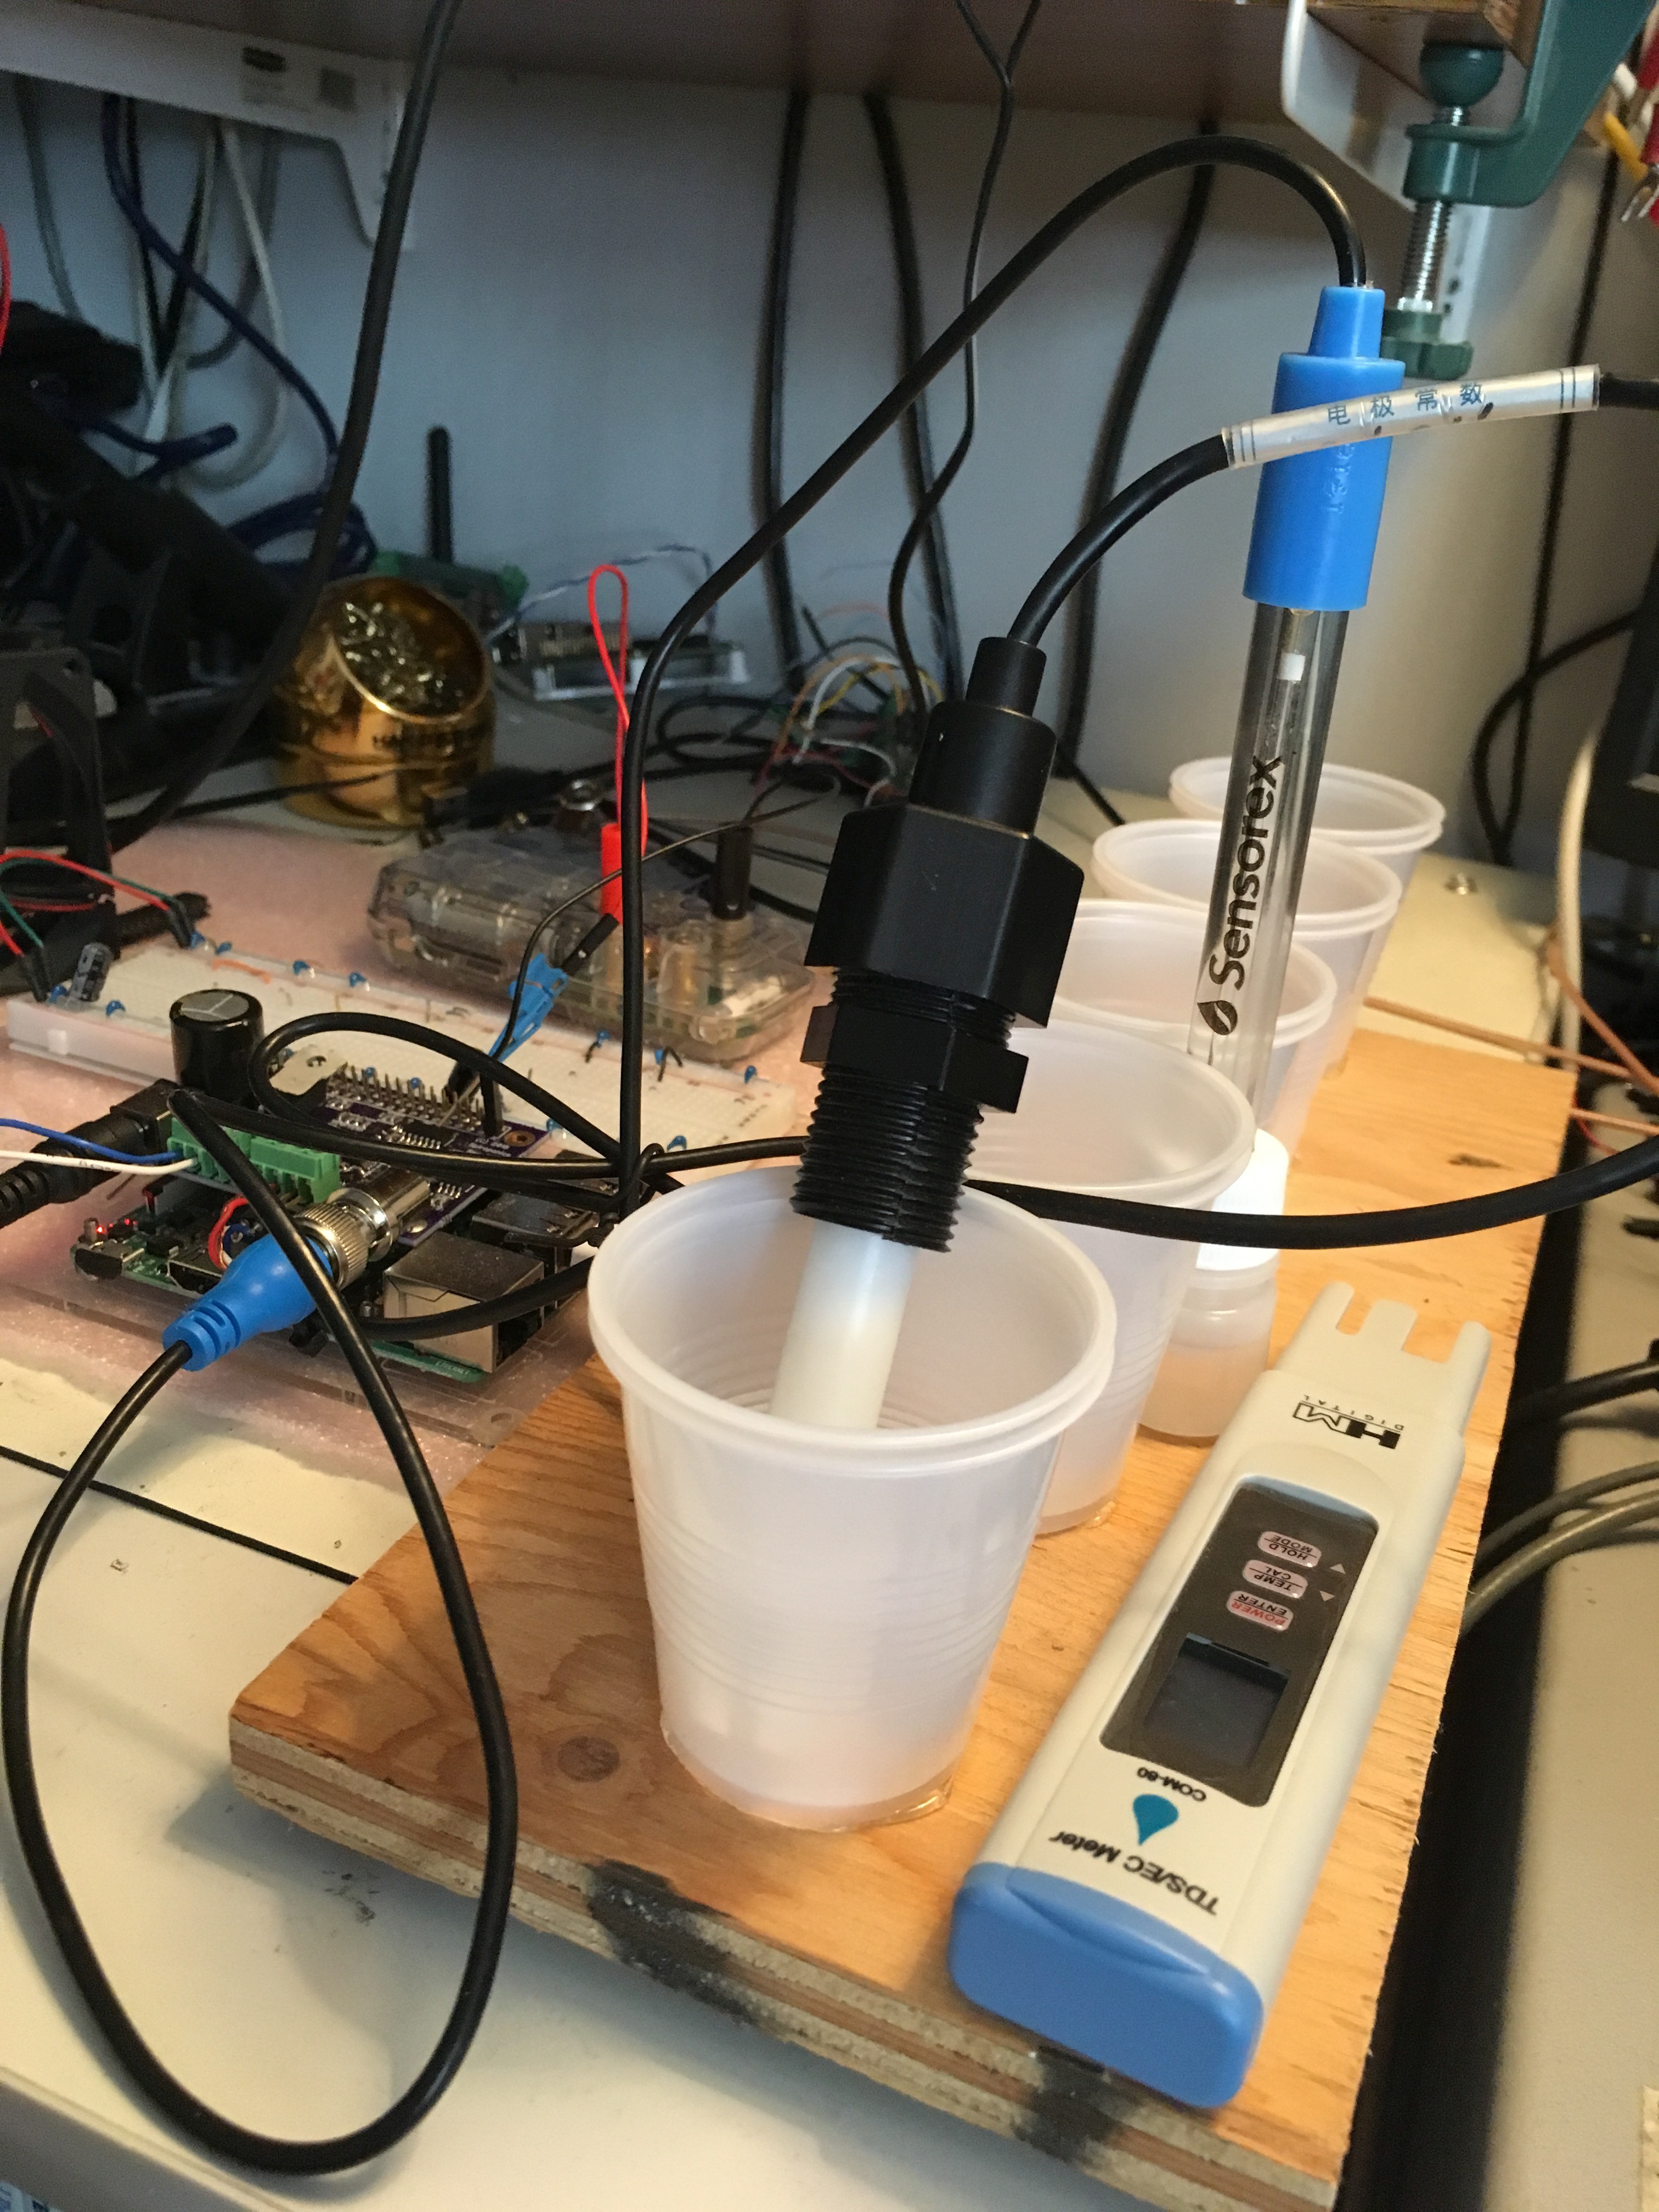
I've made an EC calibration setup with solutions of various conductivities in cups that are hot melt glued to a base, in order to avoid spills. The pH probe is sitting in a standard pH 4 probe storage solution. The plot above shows that the pH is slightly temperature sensitive. A thermistor built in to the EC probe measures the temperature. The solutions are stabilizing to the same slowly changing room temperature.
Discussions
Become a Hackaday.io Member
Create an account to leave a comment. Already have an account? Log In.