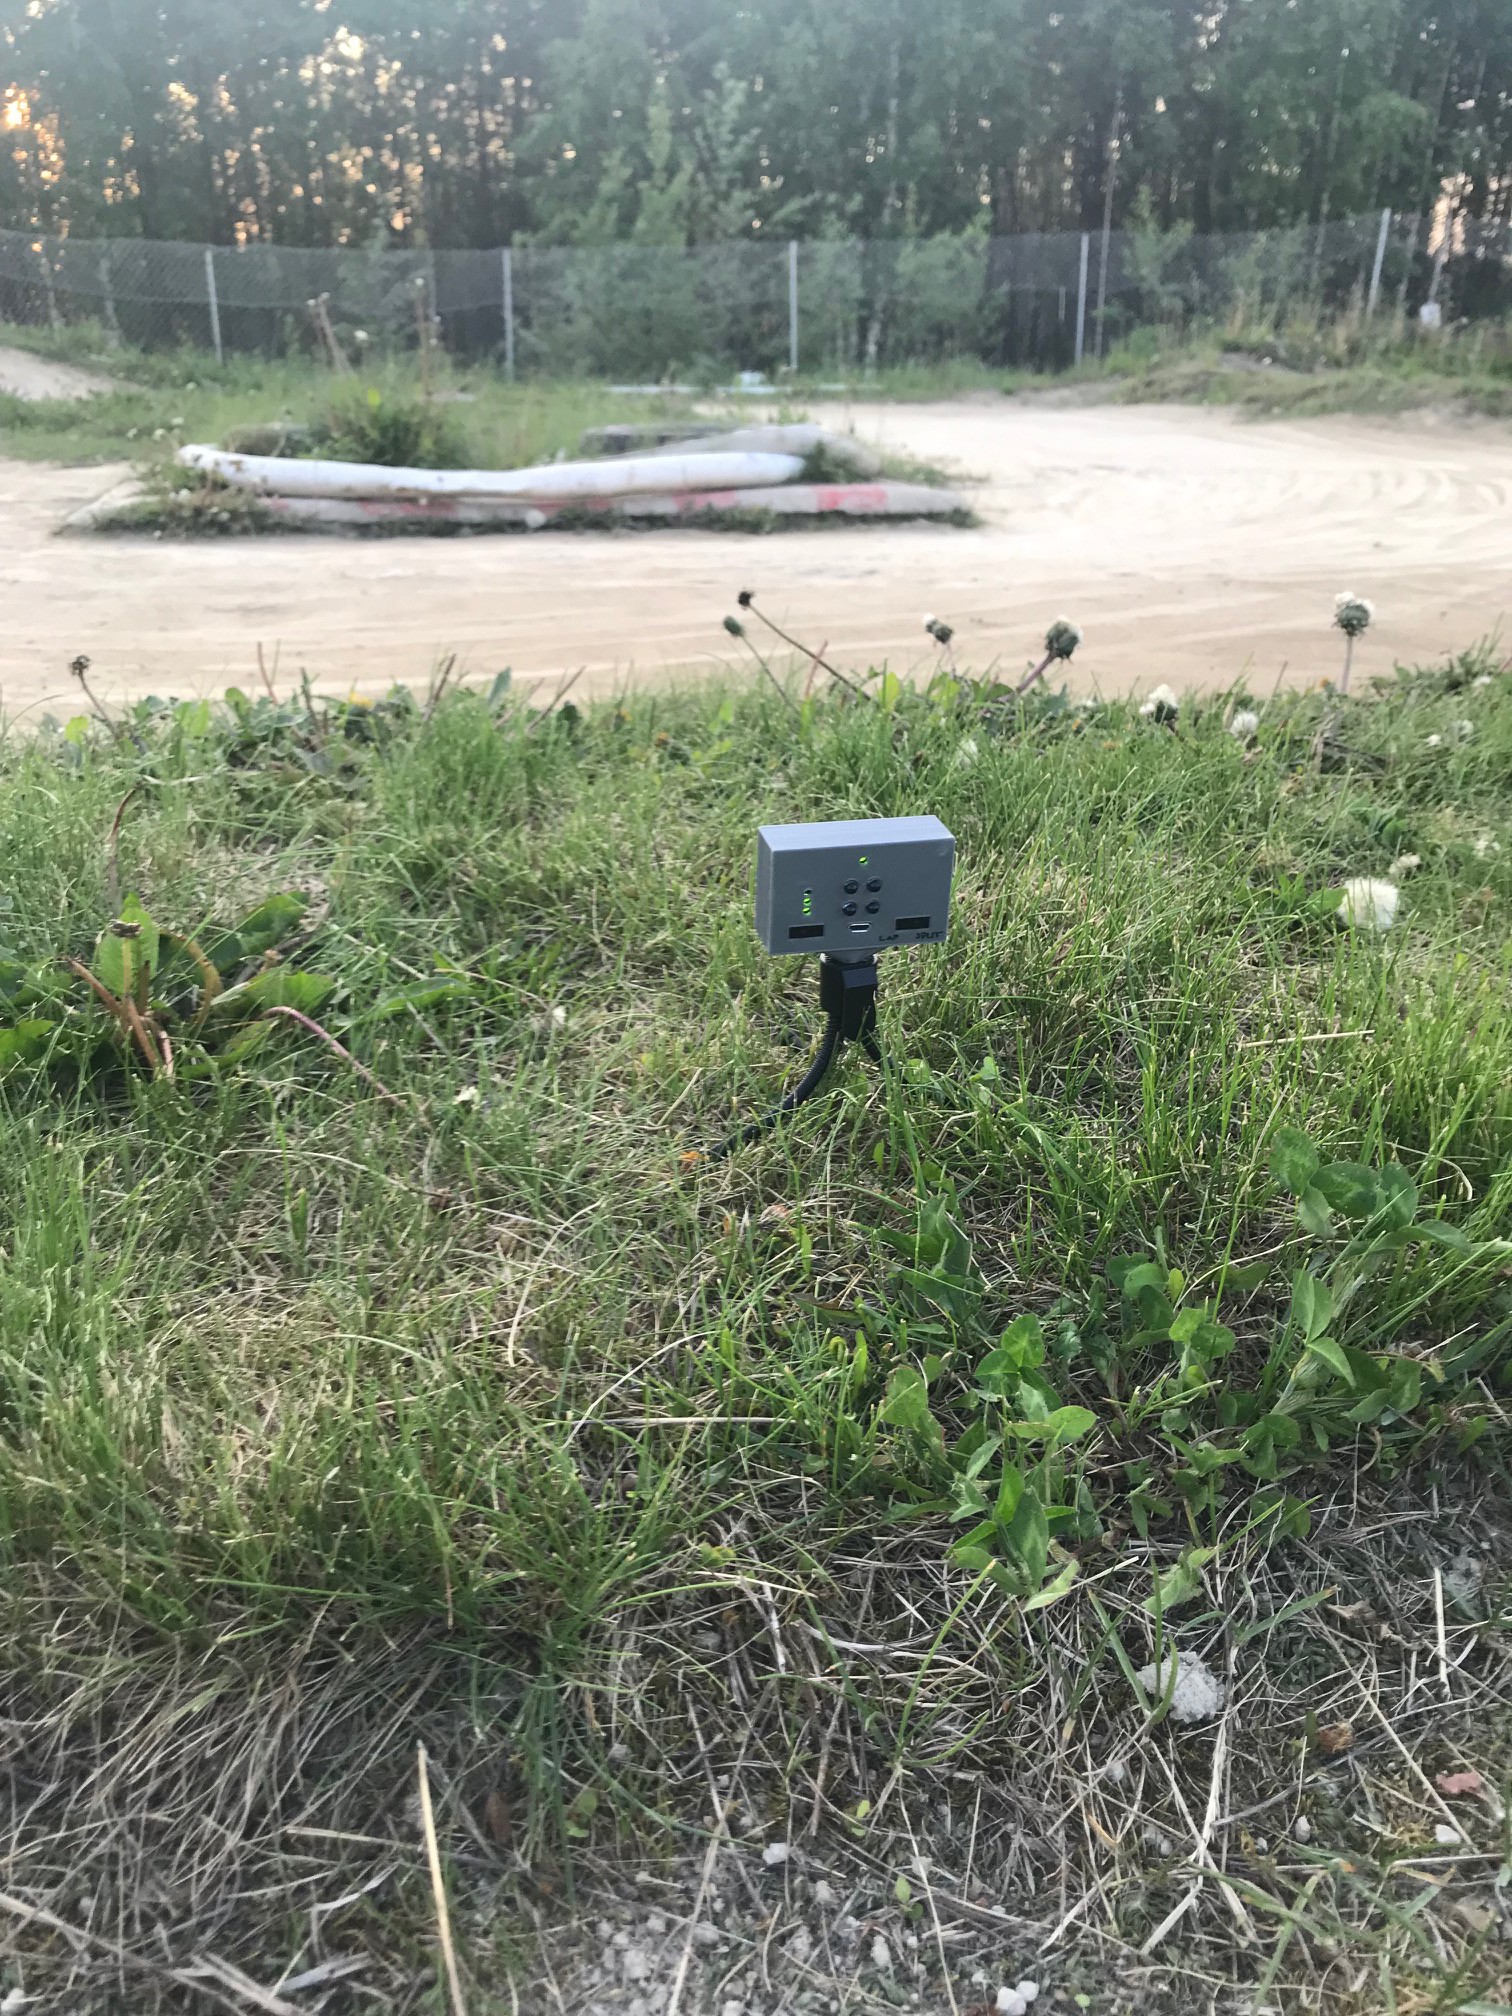
Laptimes is a key element when analysing performance and in this case these are generated with a help of IR beacon(s). Generating laptimes can be achieved with one beacon and by adding one or more beacons it’s possible to generate split times.
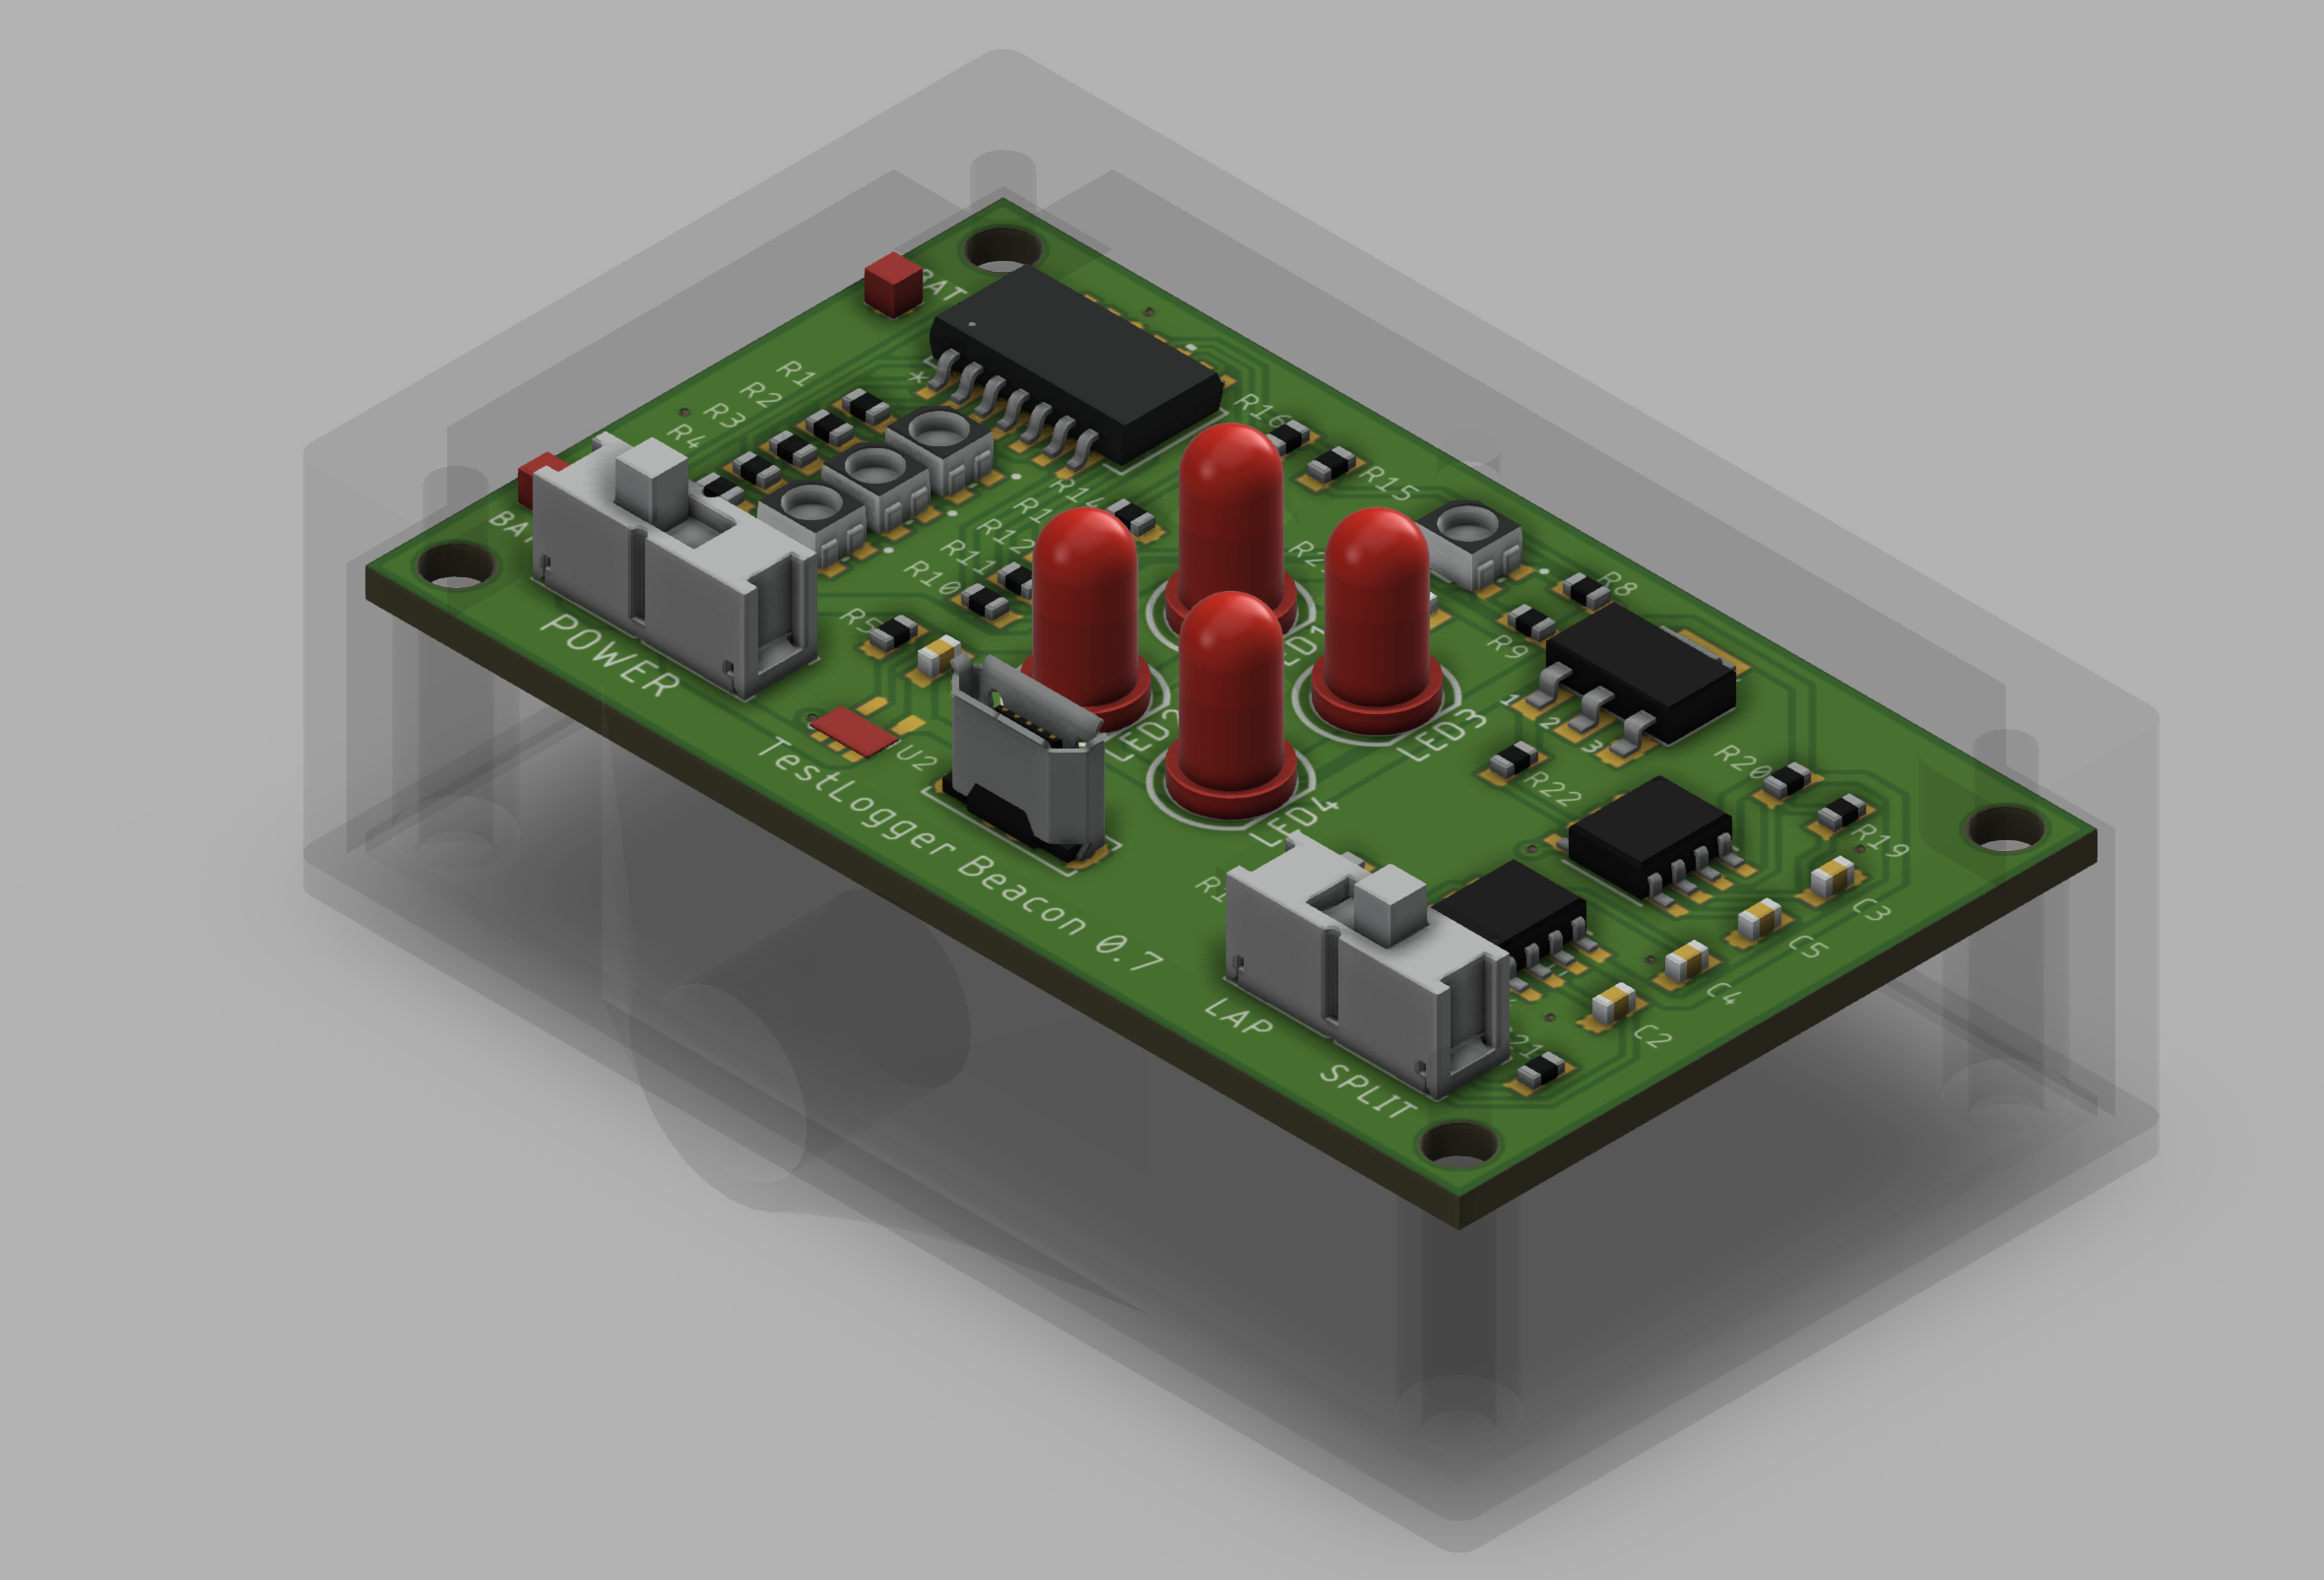
Beacon sends 38 kHz infrared signal on selected pulse length which is then received in the car and logger triggers the lap indicator. Beacon has a switch where the 38kHz pulse length can be changed and this is used to identify if beacon signal is main laptime or split time.
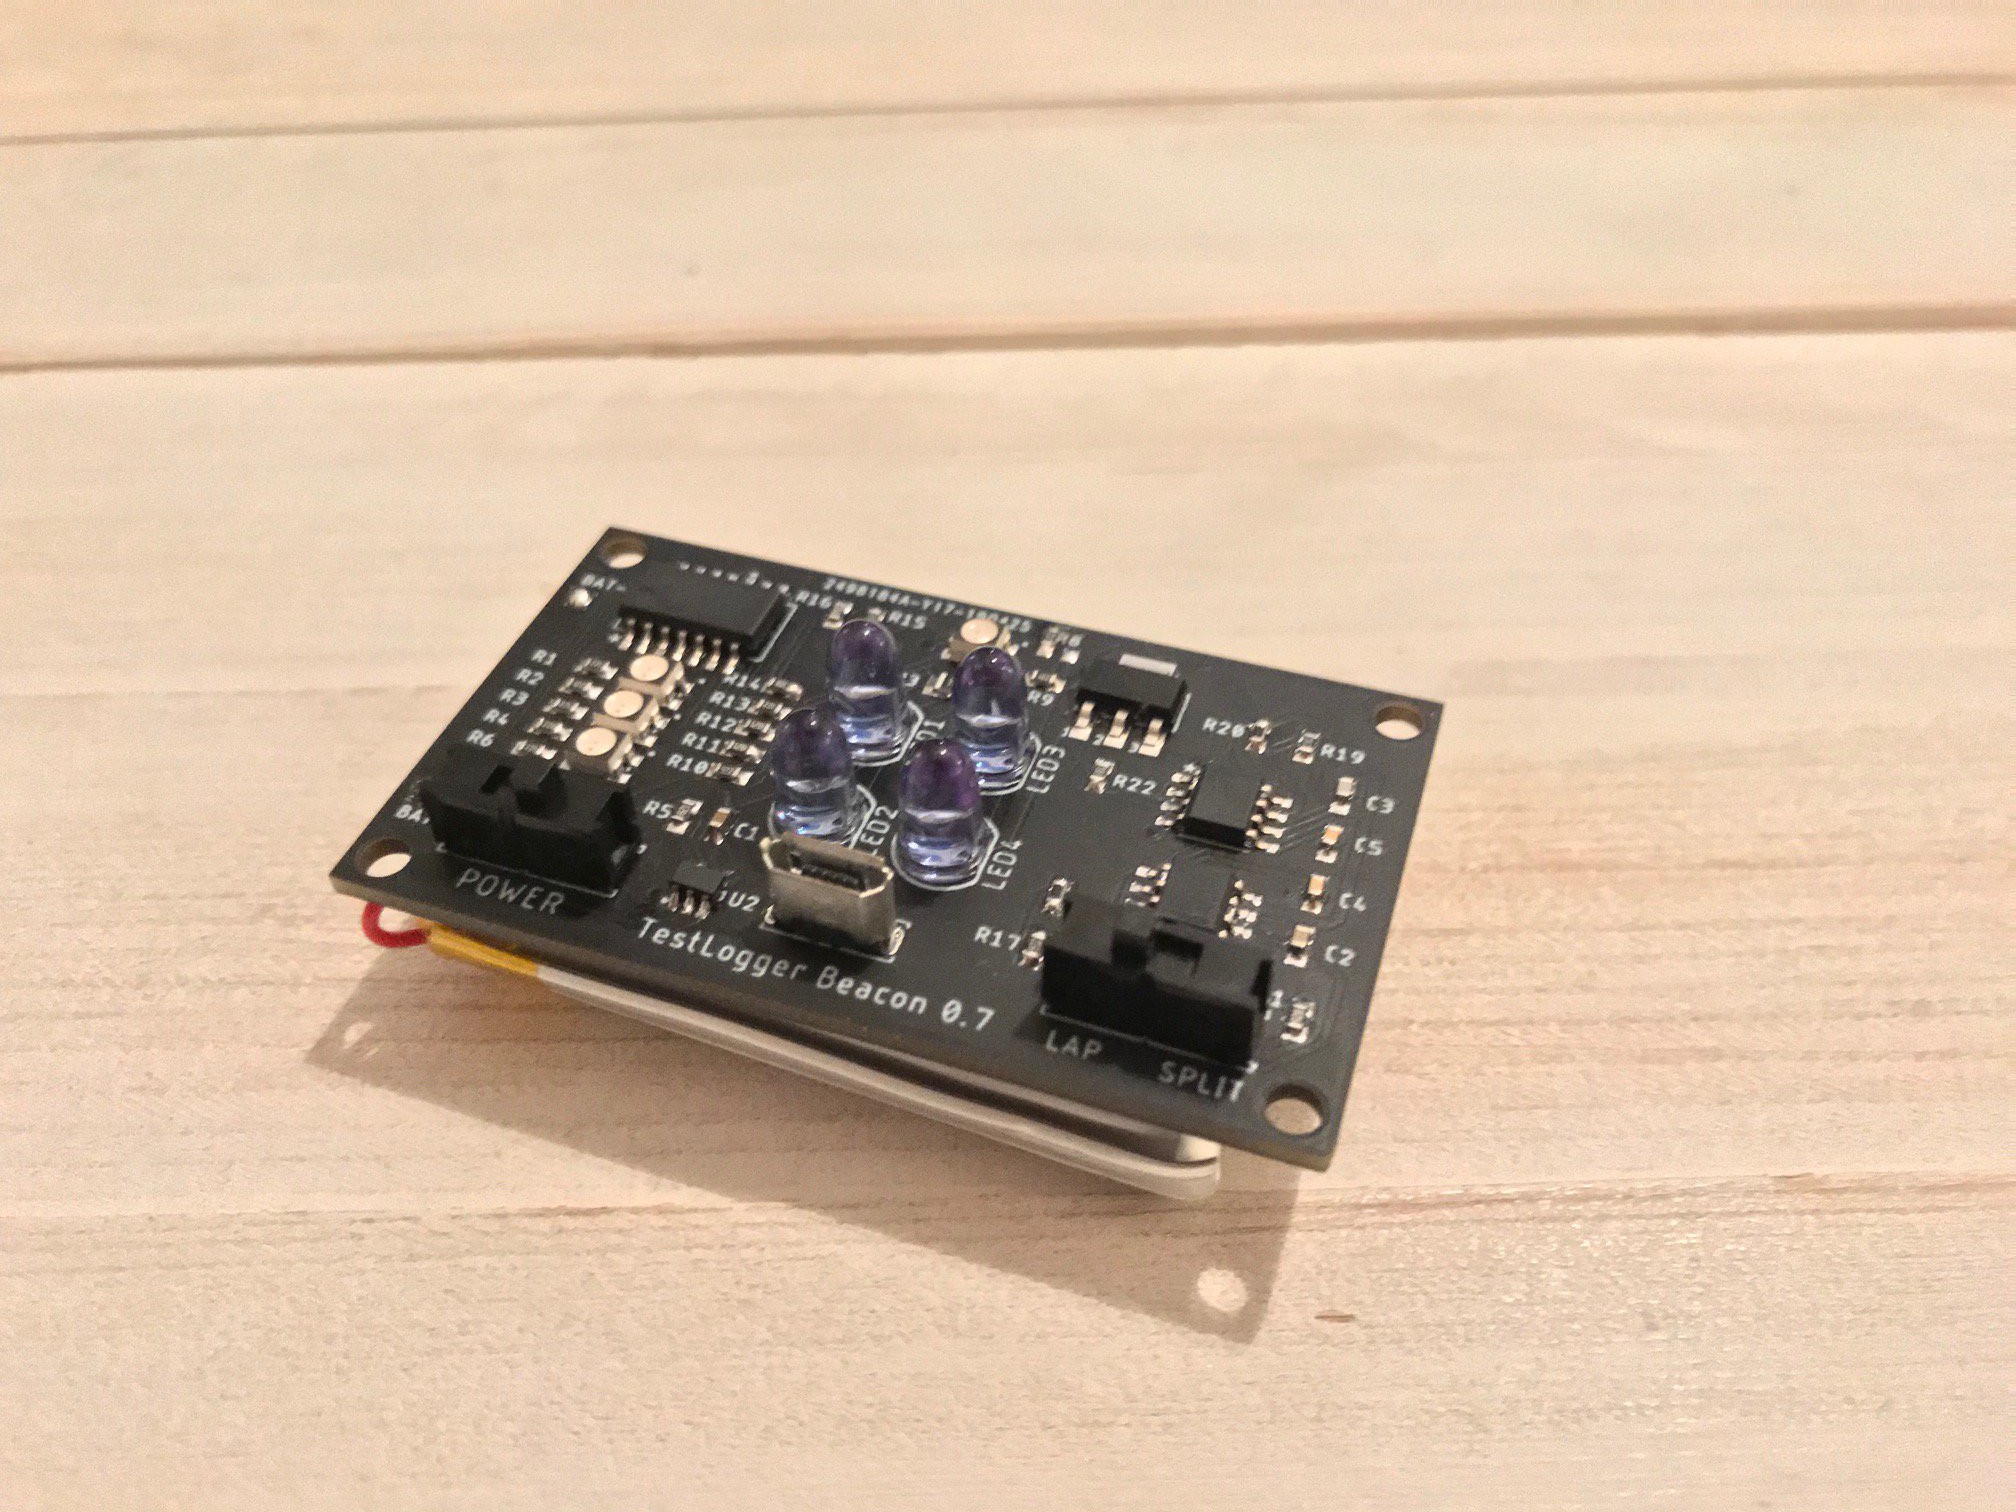
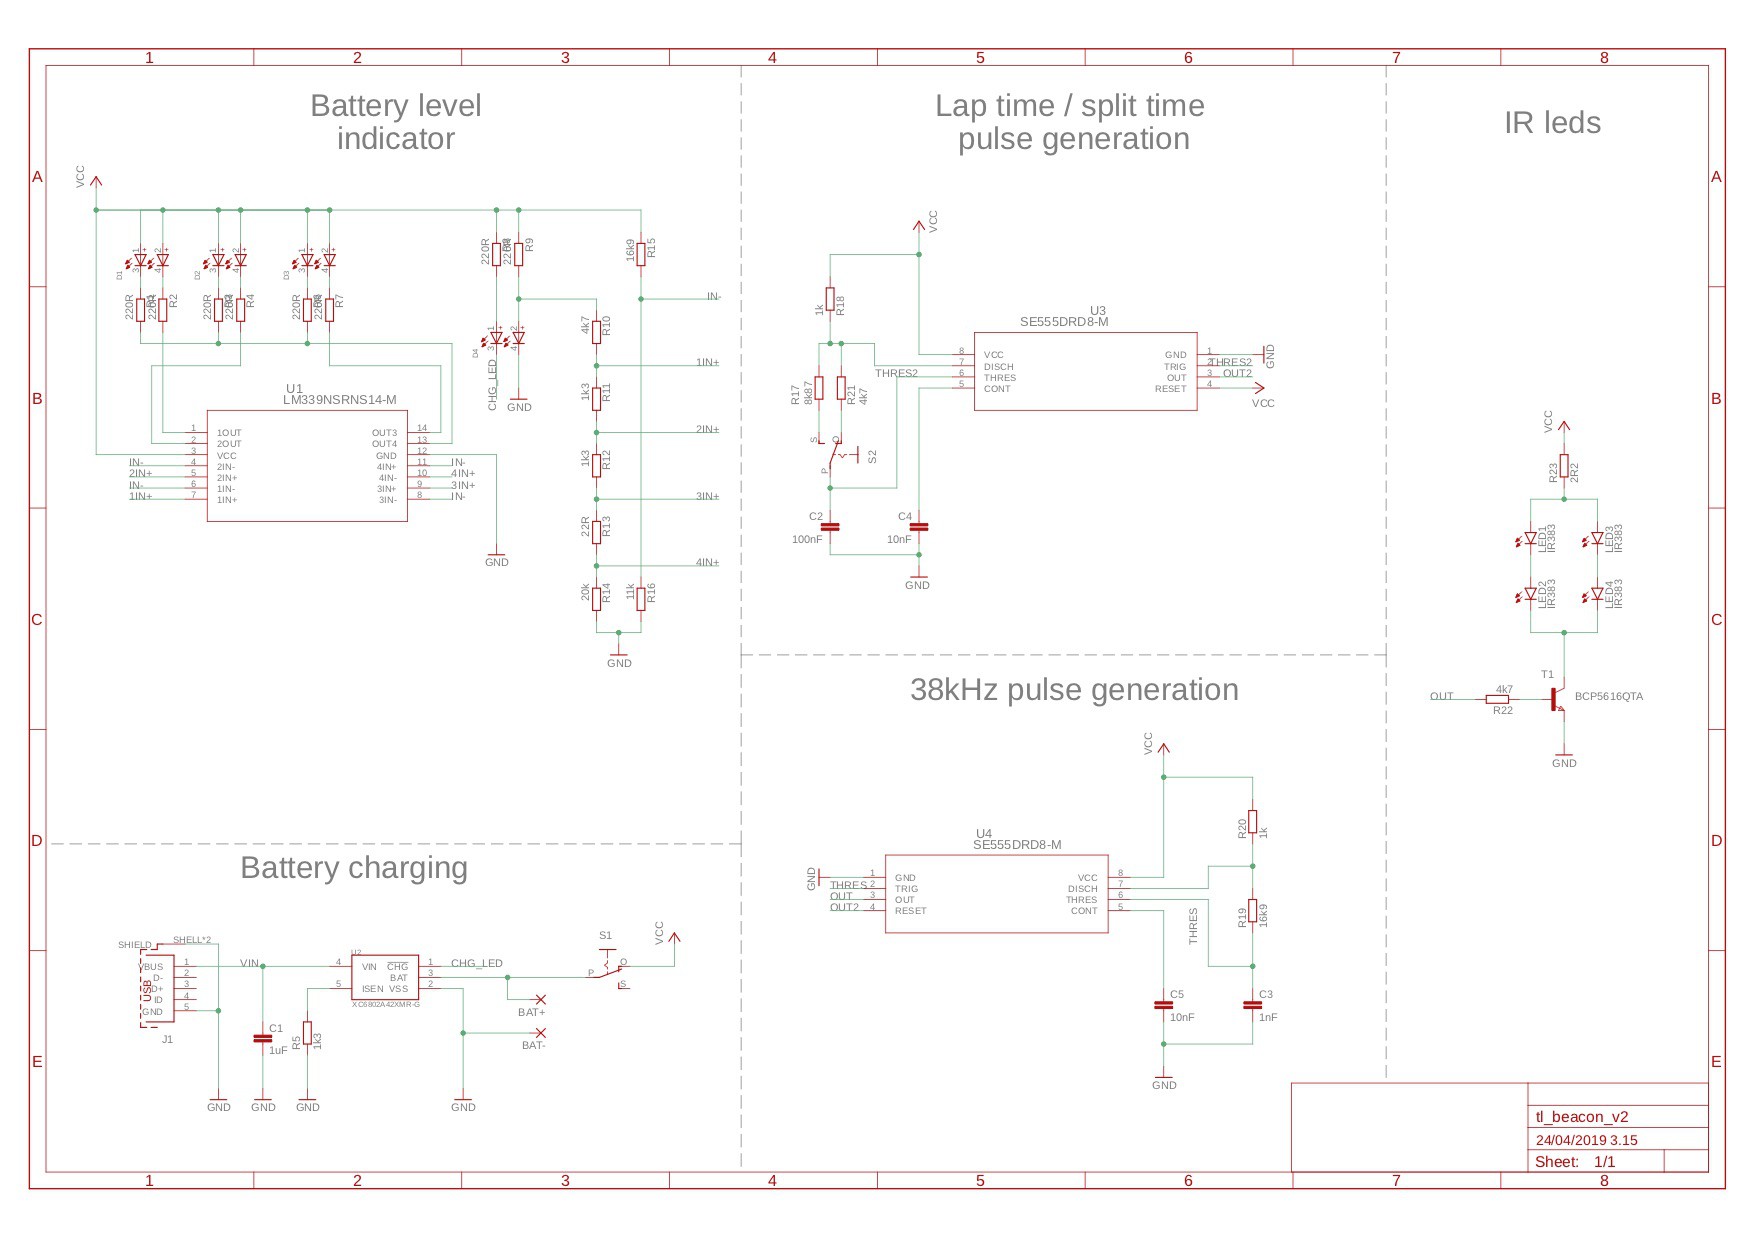
Beacon also has a lithium based battery which has 2000mAh capacity and nicely fits behind the PCB. To control the battery, there is also battery charging circuit where charging done via micro USB. Battery level indicator is built with four input comparator and bi-colour leds.
Operation principle
The 38kHz signal with around 50% duty cycle is generated with 555 timer and second 555 timer is used to control how long the 38kHz signal is transmitted and how long it is paused. This is done for IR receiver to reocognize different pulse lenghts. IR leds are controlled via NPN transistor as 555 timer don’t have that much capacity to pass current from the output. IR383 were selected for use and reasons were narrow transmission angle (20 degrees), wavelength (940nm) and max current level (peak forward current 1A).
Currently I'm using 1R resistor in front of the IR leds and take drains the battery in around 3 to 4 hours and to be honest the transmitting power is maybe even too much. So try with 2R2 and see how that works.
Battery charging and charge status
Battery charging has nothing special built. Just used XC6802A42XMR-G with a reference design from the data sheet.
Battery level indication is done with LM339NSR and I used this article as a base https://www.instructables.com/id/Li-Ion-battery-level-indicator/. I have just adjusted the resistor values to my needs and last step is done inverse as I wanted to turn on red LED's when voltage below threshold. I created a excel sheet where I calculated the suitable resistor values.
How does it show in data?
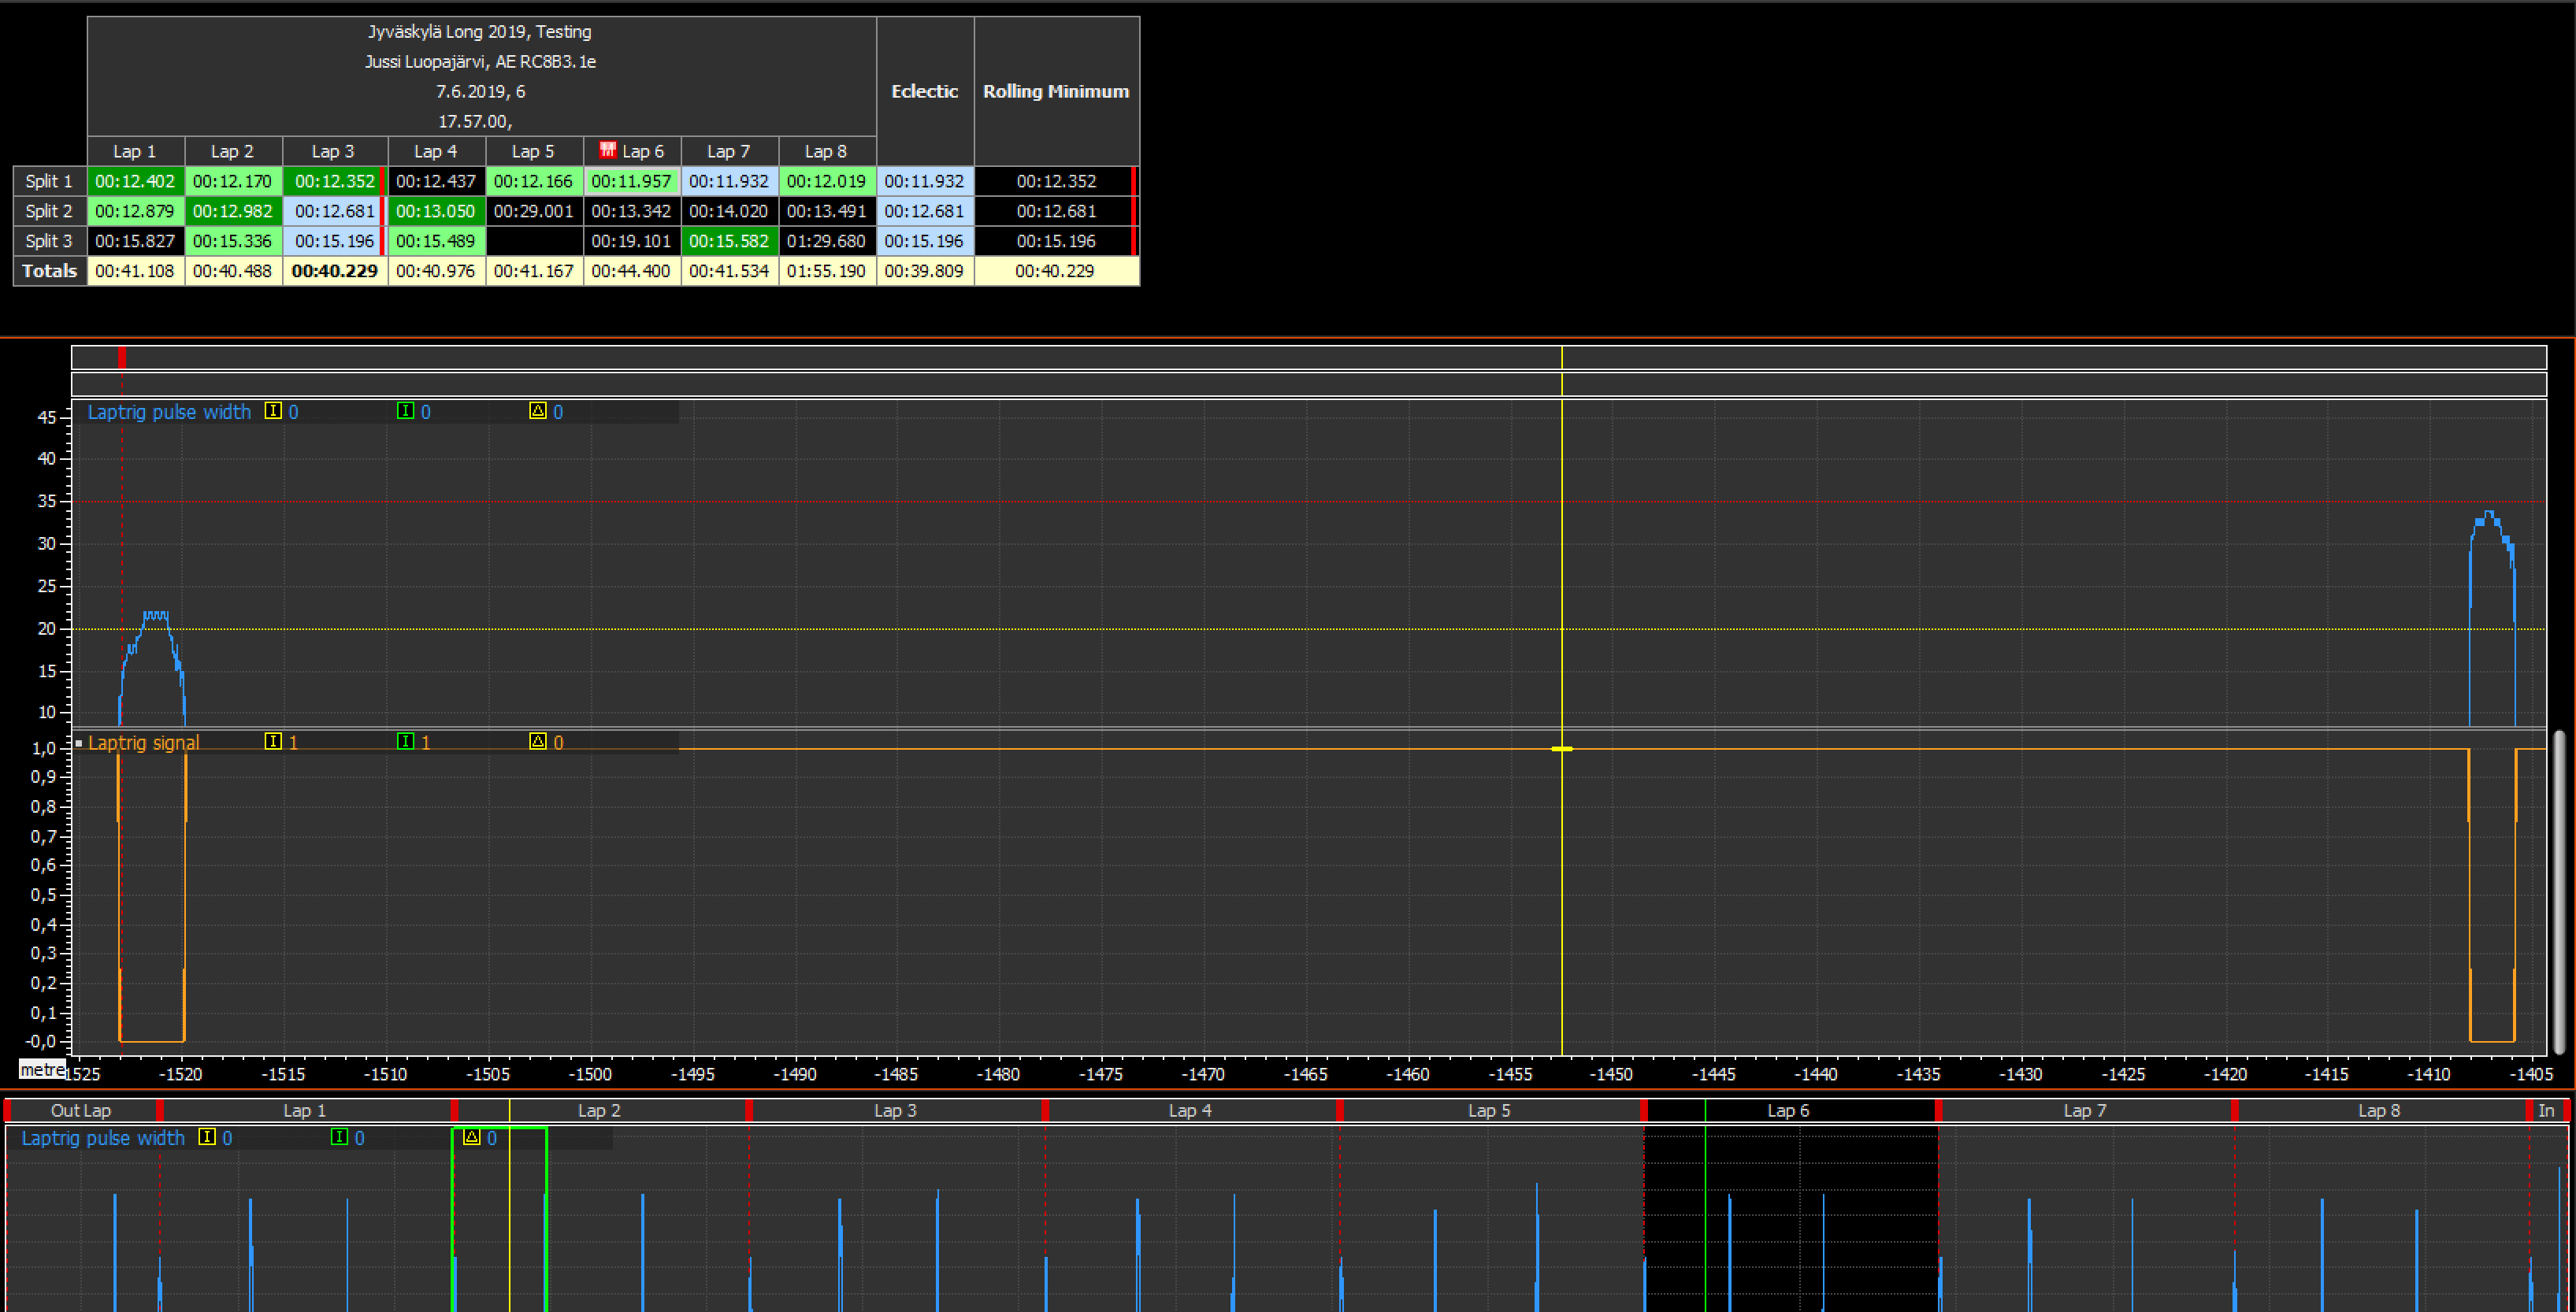
Below there is picture of data where there is one pulse from main beacon and one from split beacon. In the data you can see the blue line which has two pulses and these are points were beacon is active. Basically the logger measures the pulse width and this value is logged which is the pulse you can see in the picture. Then average is calculated from certain amount of samples to see if the signal is from main beacon or split beacons.
The thing get's slightly tricky as pulse is not square shaped but instead it is round, so calculation of the average can't be started from the first pulse but instead after e.g. ten samples. I haven't investigated the physics behind the phenomem, but it is related to the fact that moving car is passing the beacon and on the edges the measured pulse width gets shorter. I might need a IR led with even more narrow distribution angle?
Discussions
Become a Hackaday.io Member
Create an account to leave a comment. Already have an account? Log In.