It's been a while since last post and things have progressed a fair bit on HW side like Collector Full V2.2 and completely new IR beacon, but that's not the topic for today. Finally I'm posting about something else than HW development and it's about the collected data.
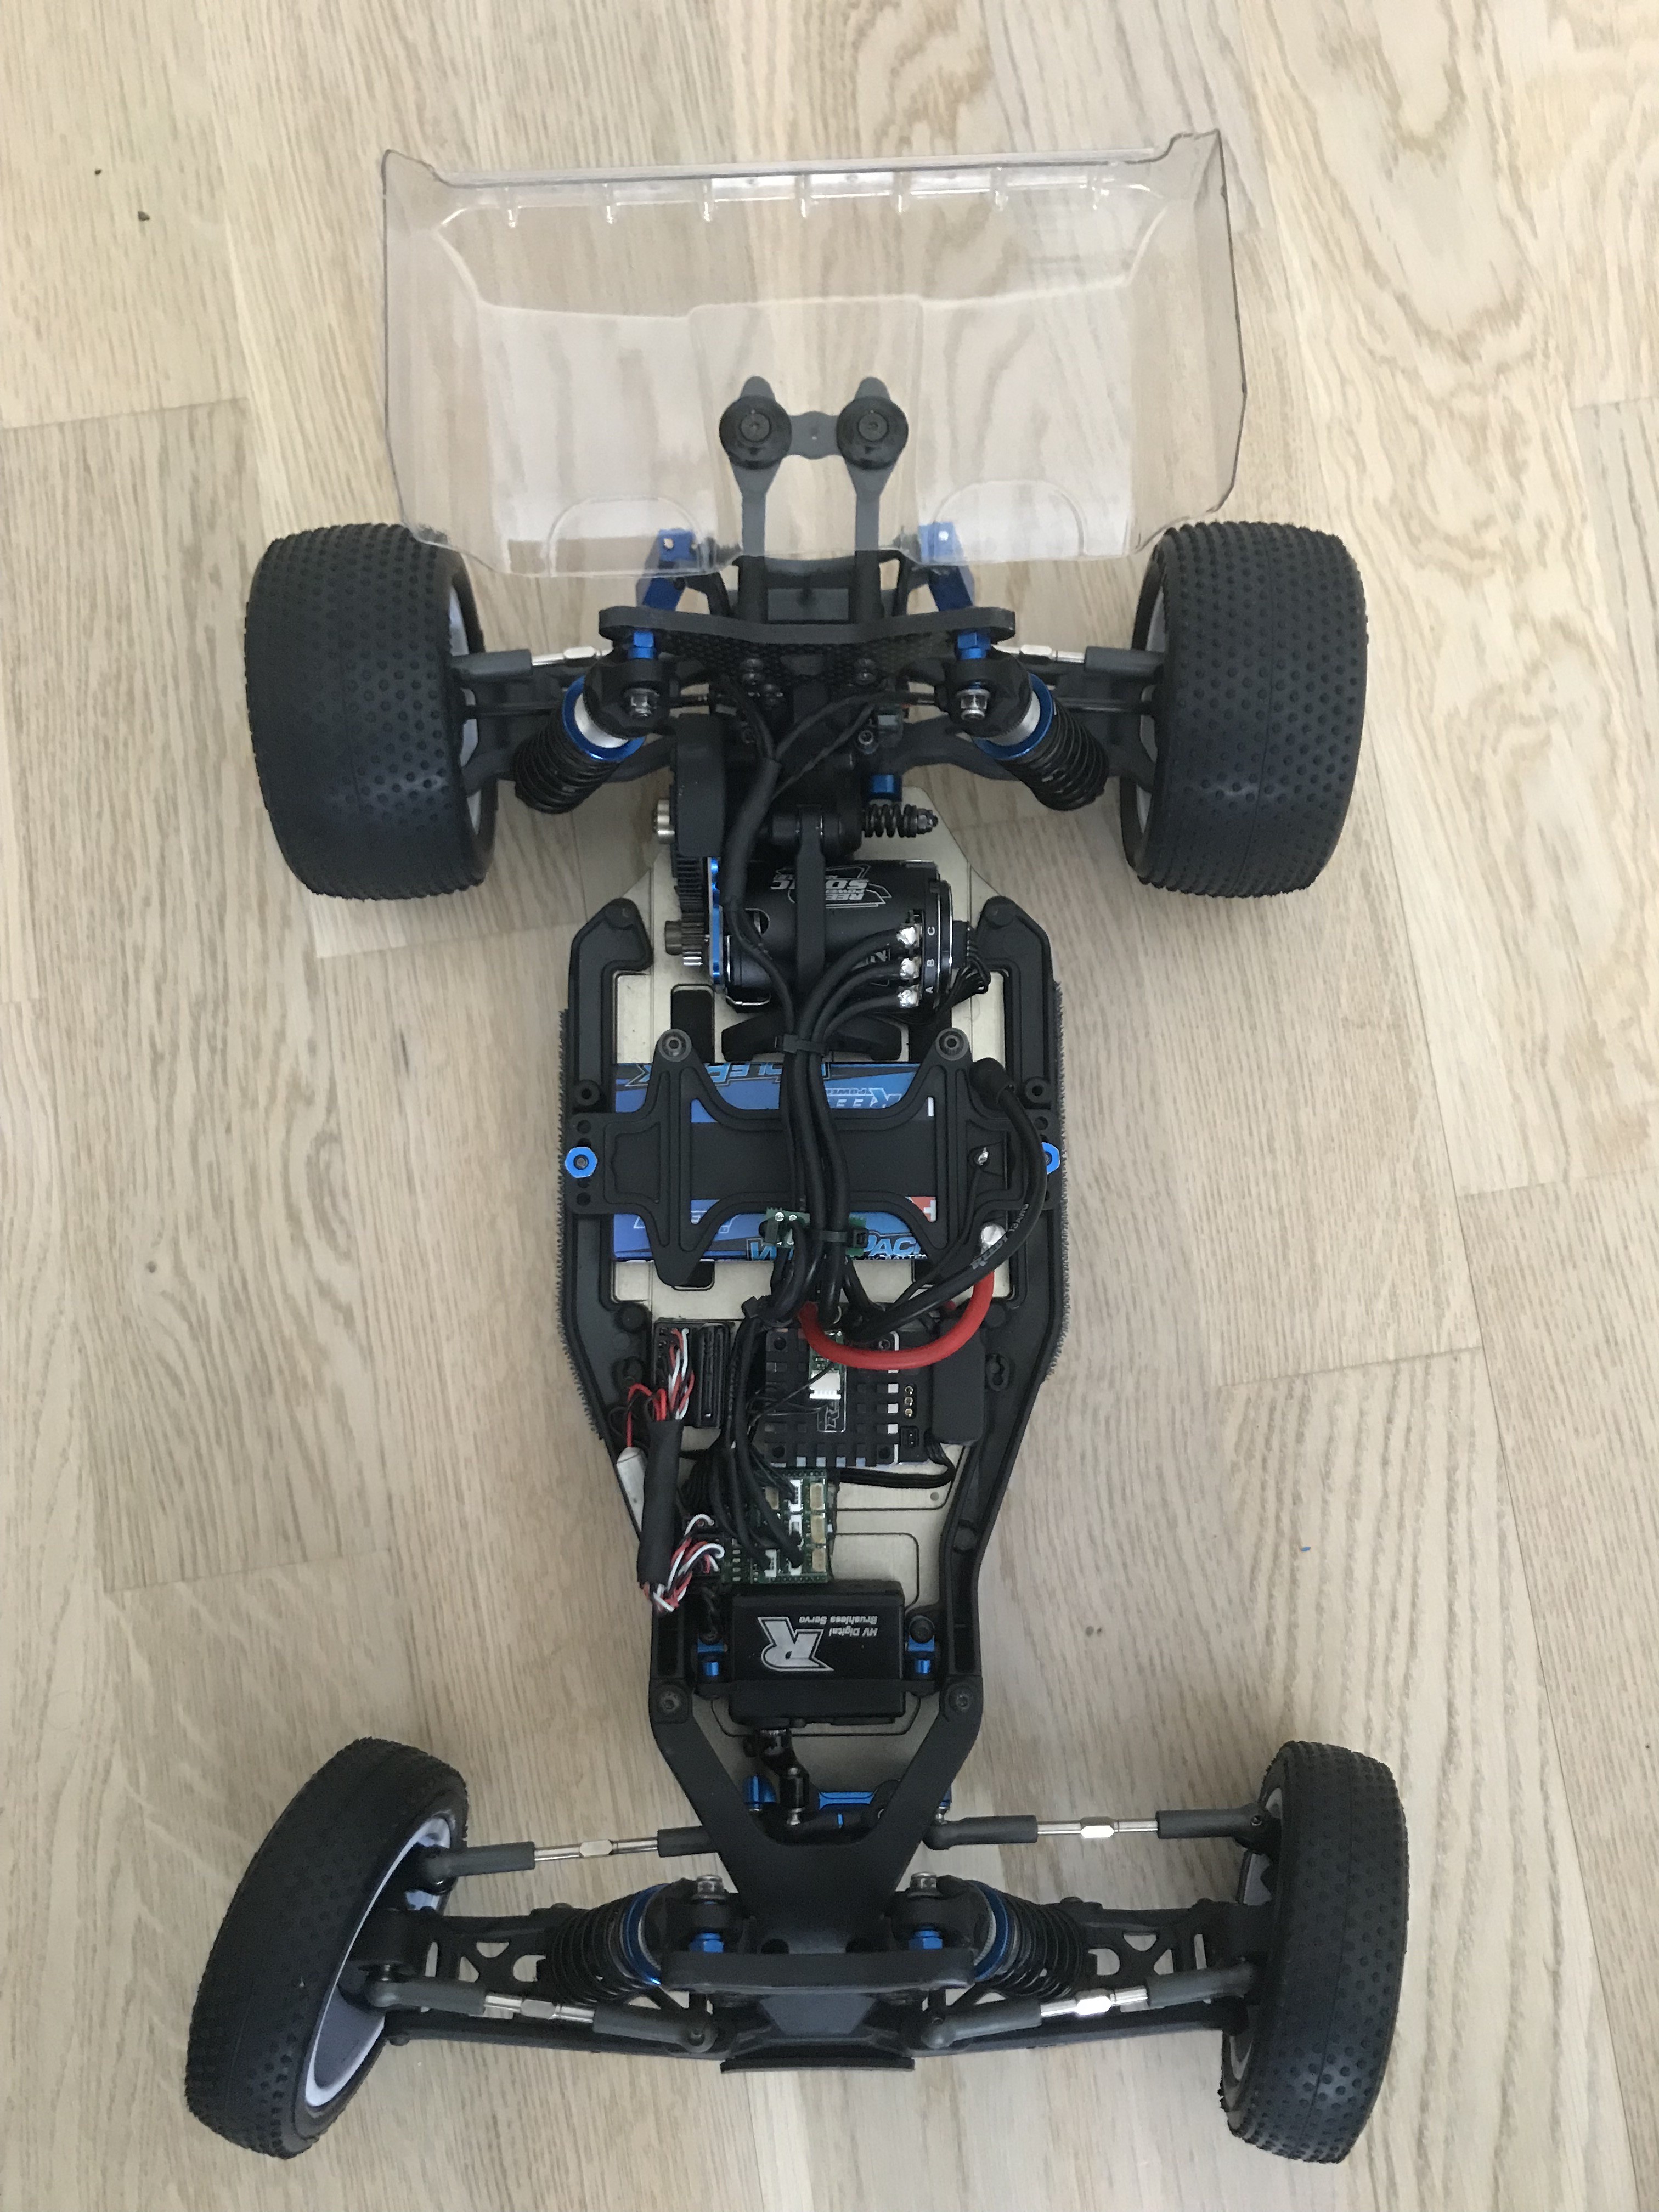
I've been using the Full V2.1 with my 2WD buggy (It's Team Associated B6.1D, see https://www.teamassociated.com/cars_and_trucks/RC10B6.1D/Team/) and I've logged the channels as follows.
- Steering
- Throttle/Brake
- RPM/speed from motor sensor port
- Wheel speed from both rear axle outdrives
- Battery voltage from two cells
- G forces on three axis
- Angular velocity with gyro
- Damper movement on rear corners
- Laptimes
Of course this amount of channels gives you a massive possibilities to analyze both car and driver, but here few simple examples to start with where you need only steering, throttle, speed and vertical acceleration.
Here is the car with the setup above.
Top Speed
I dare to say that most common question any RC driver have ever heard is the magical question how fast the car goes. Well, without data it's quite hard to say but now we have that and we can finally give an answer.
Below is a screenshot of speed trace. Green line is an average of all speed channels, second area has all three recorded speed channels, third area has throttle position and fourth area shows vertical acceleration. The yellow cursor is placed at the end of a straight and that tells us the speed which is 53.5 km/h and throttle is 100% and after that it drops to zero and the speed starts to reduce as well.
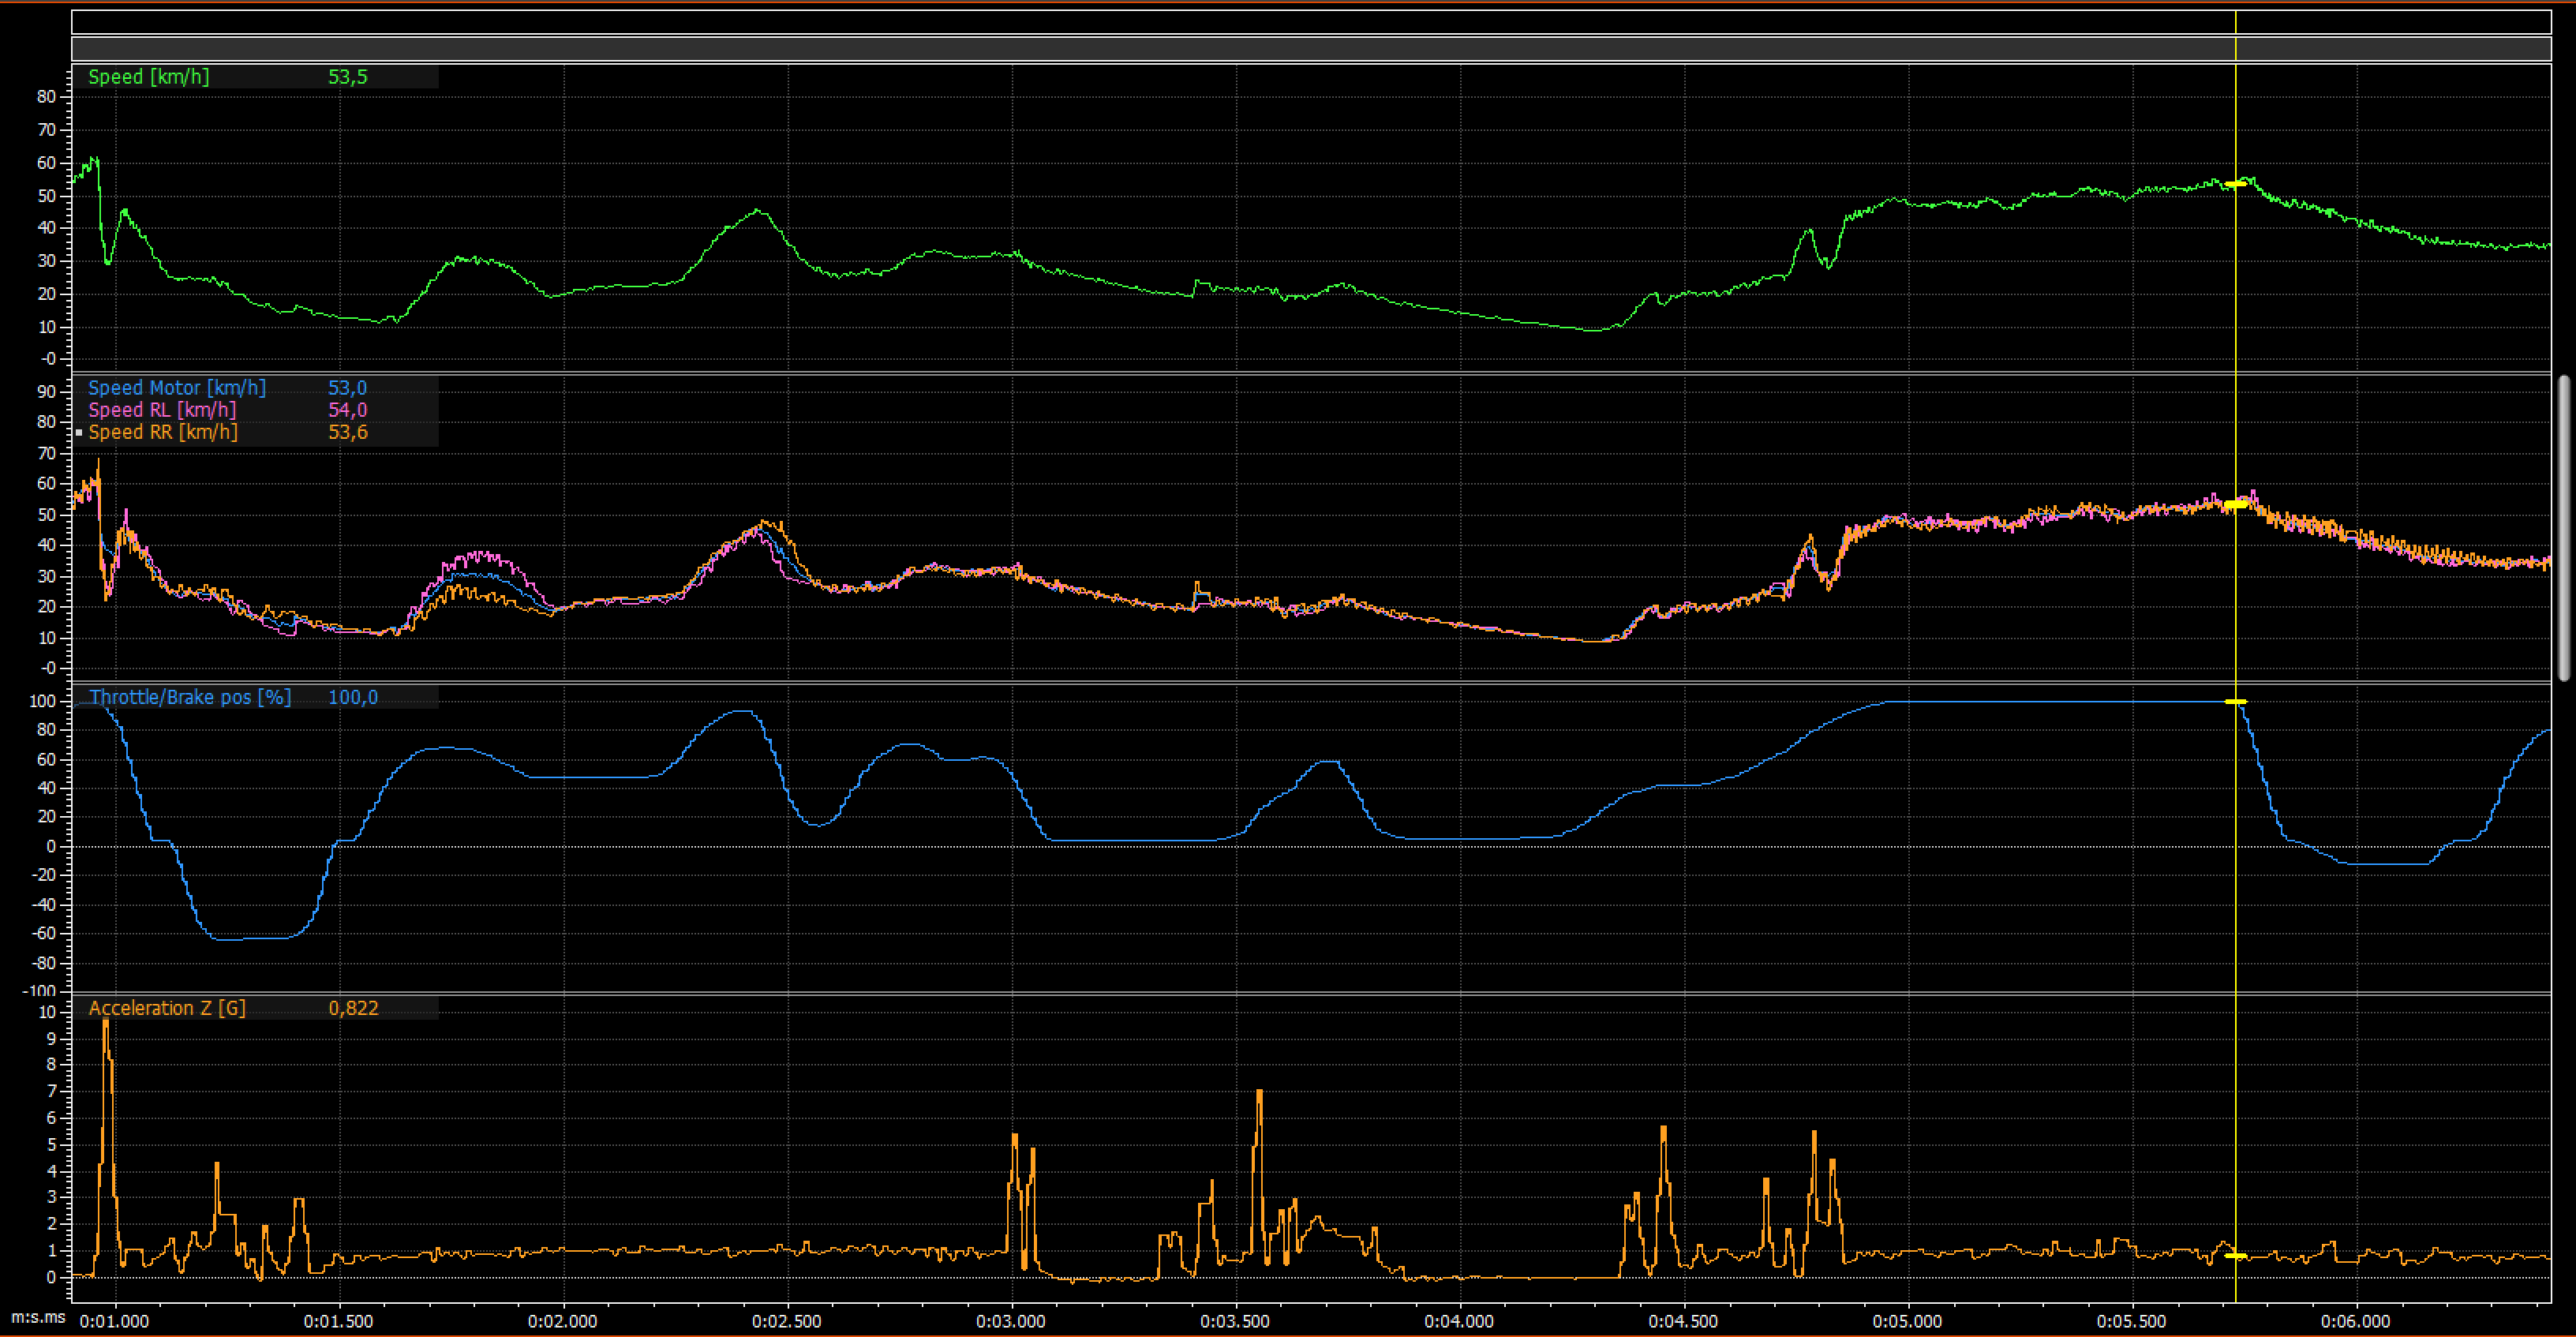
Why to use common sense when the computer tells you a number? In the first scenario you can see some noise on the second area where you have all the speed measurements, so then you can already say there is some error margin in the value.
We also need to consider if there is any wheel slip which increase the speed, but in this case I don't see that it would be the case.
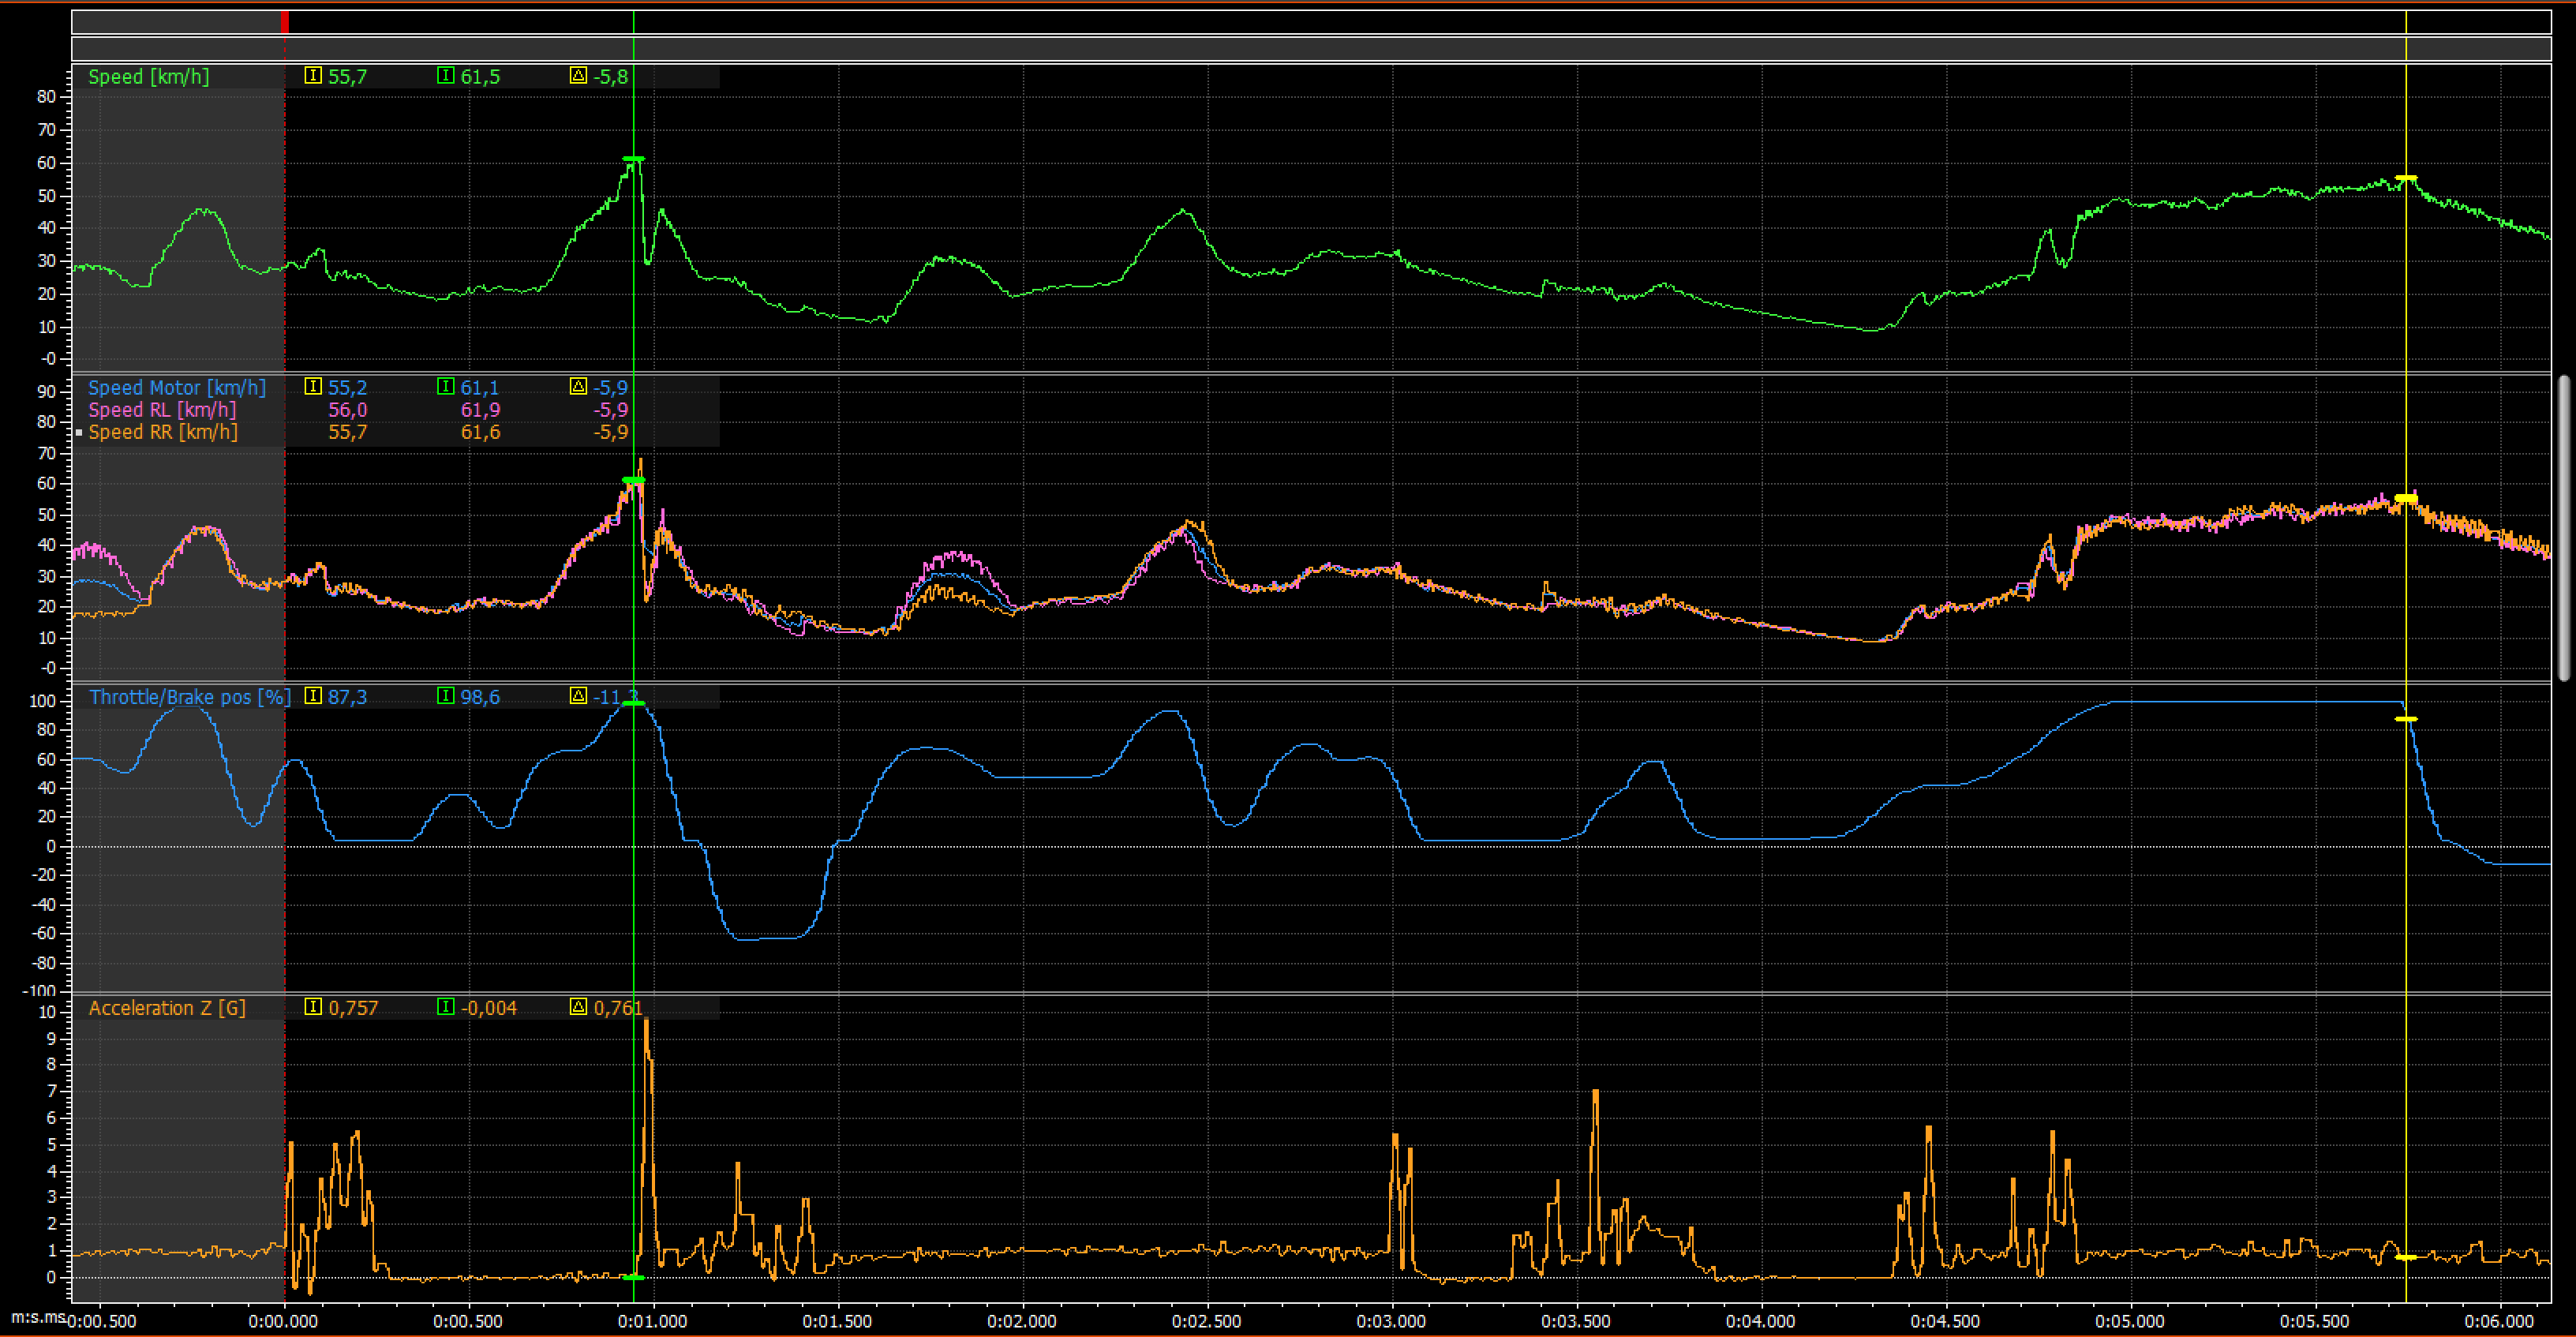
So that around 55 km/h was from the end of fastest straight, but when you look the whole lap and there is a point where the speed is actually higher. So what is going on in here? The picture below shows you the highest speed and the end of the straight and I have cursors in both locations and delta is 5.8 km/h where the speed at end of the straight is slower.
This is the reason why I wanted to have vertical acceleration visible in the screen because that shows zero in the point where speed is highest and in static situation it should be 1. This tells us that the car is in the air and I press the throttle already in the air. If you look closely after the green cursor the vertical acceleration goes to around 10 Gs and speed drops very quickly and this tells that the car lands. So this tells us that this isn't real top speed of the car and we need to use the speed from end of the straight.
How to utilize the speed information when testing? One simple example is to compare different gear ratios and what is the effect on acceleration phase as well as the top speed. You can also try different driving styles e.g. taking different lines in the corner before the straight and see if it has an impact on the speed on the straight.
This picture already shows something else what is interesting but we come to that later on in the future posts ;-) And that is not my sh*t driving :D
Driver behaviour
The only input what driver can do is to turn the wheels and accelerate/decelerate the car. Target for those driver inputs is to make the car go around the track as fast and consistent as possible within the limits of car's capabilities. Then what can you tell about the driver based on the data? For example it's possible to see if the driver smooth or aggressive. What techniques driver uses to for example workaround oversteering and understeering.
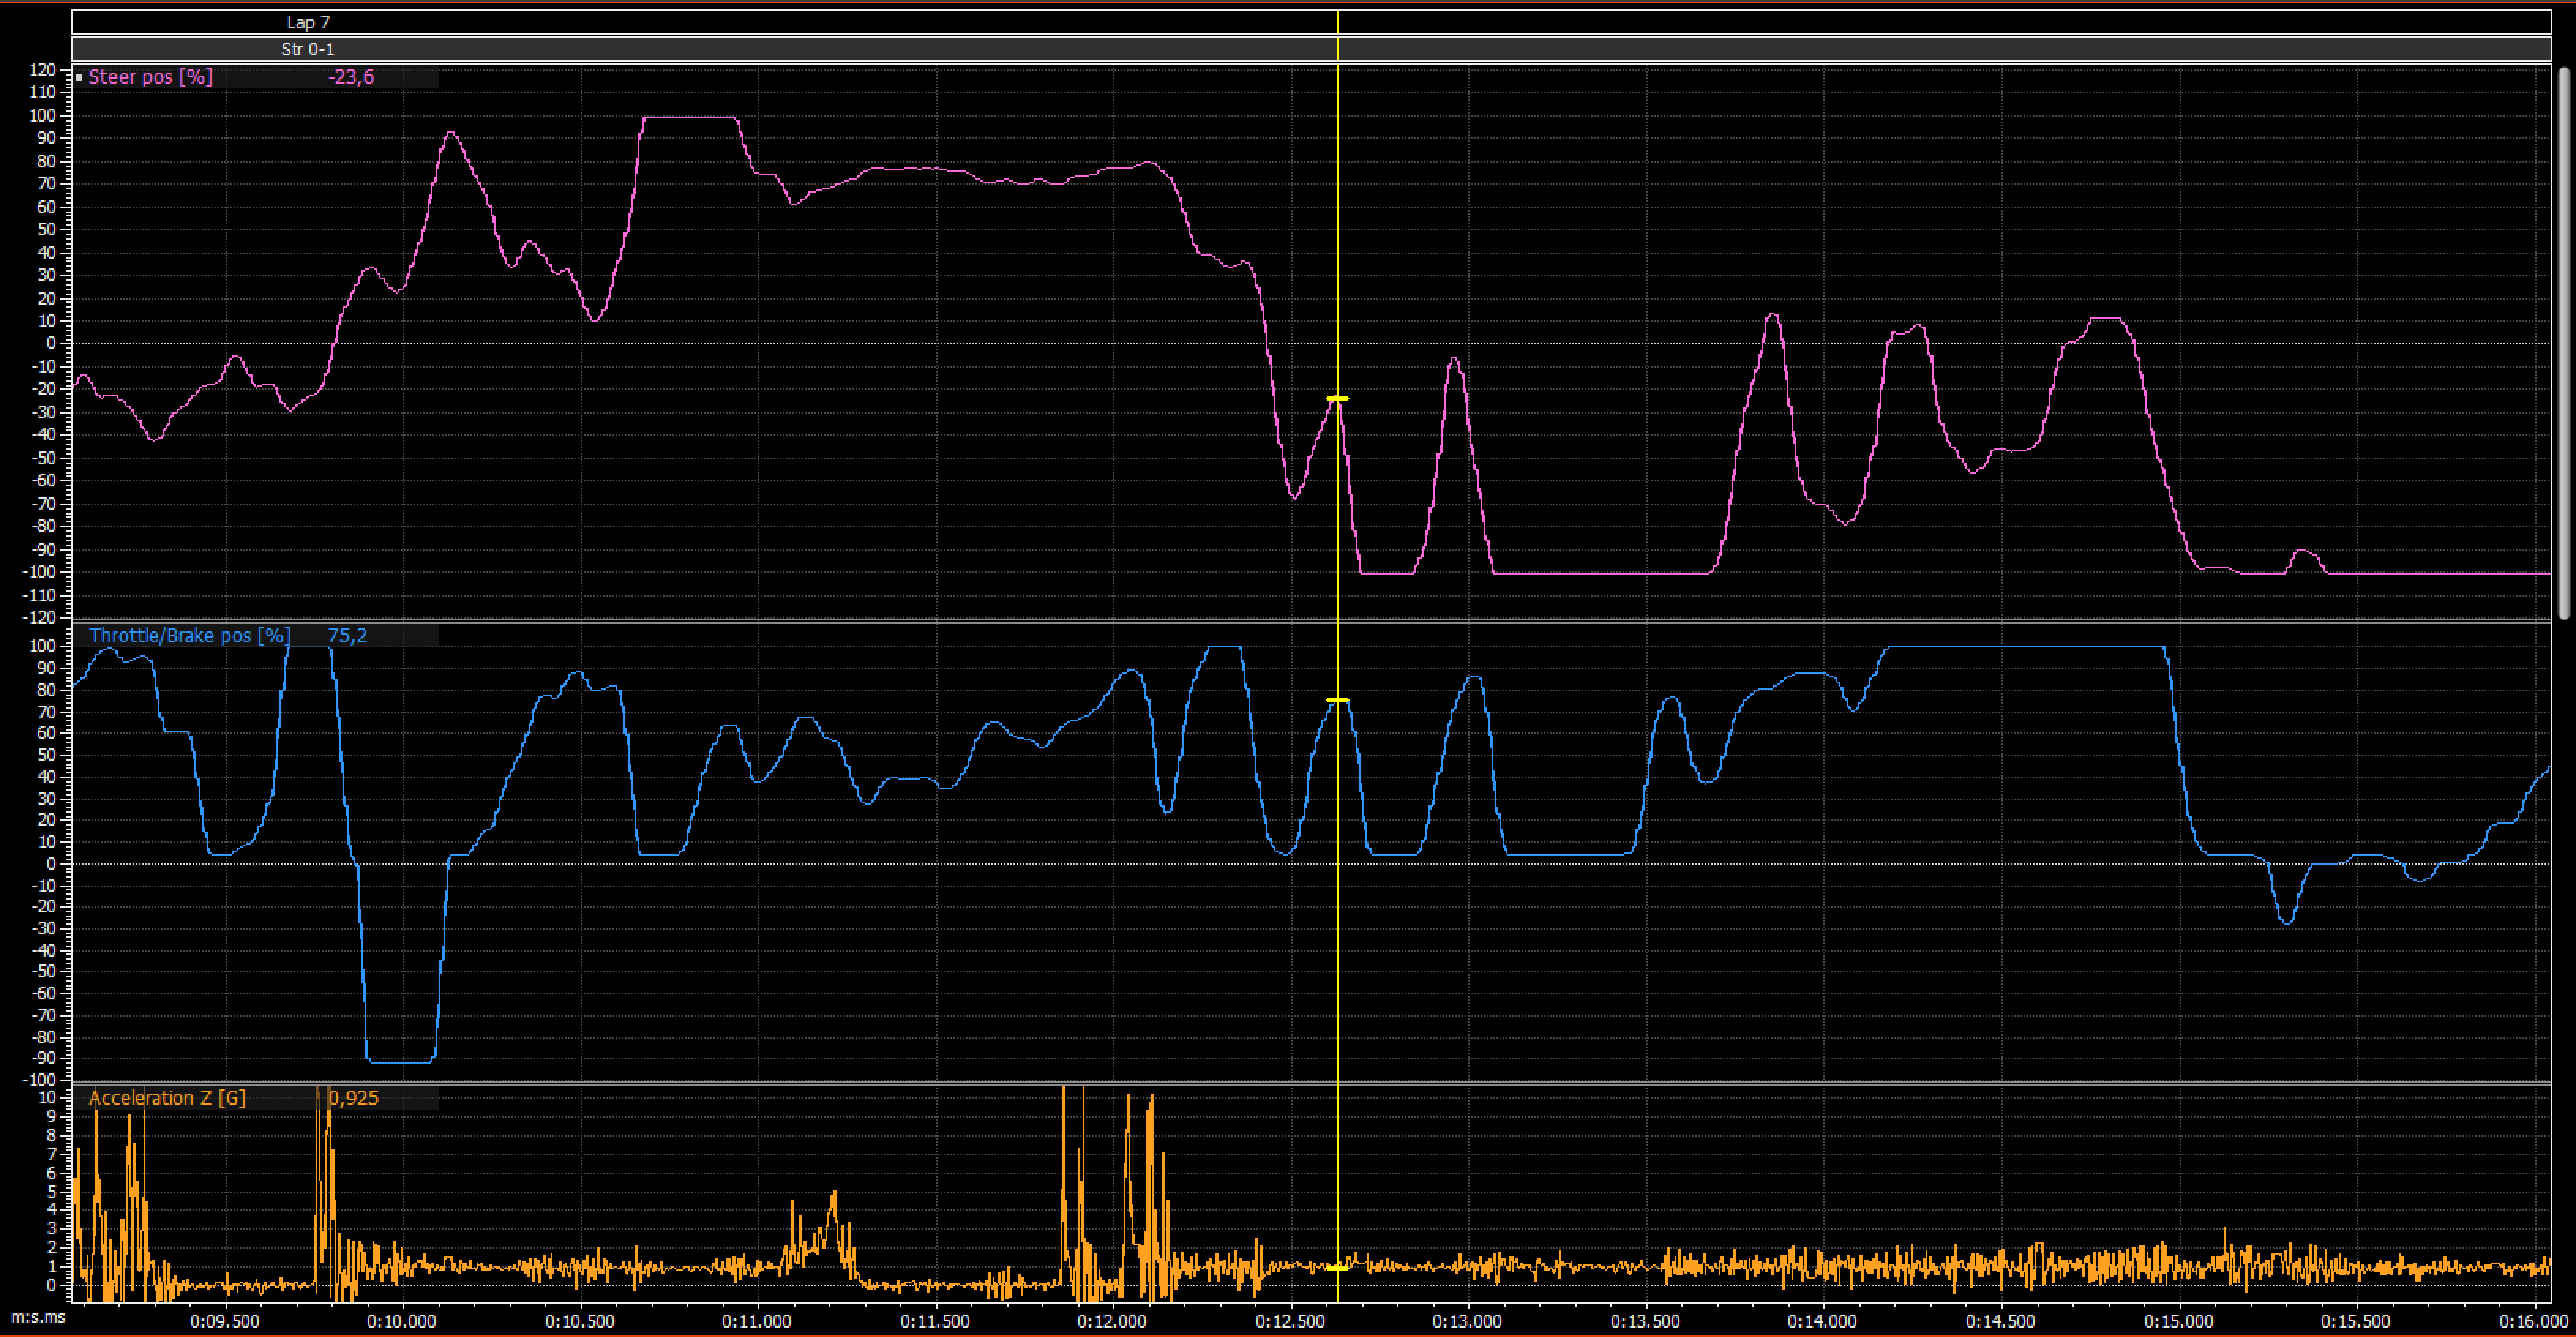
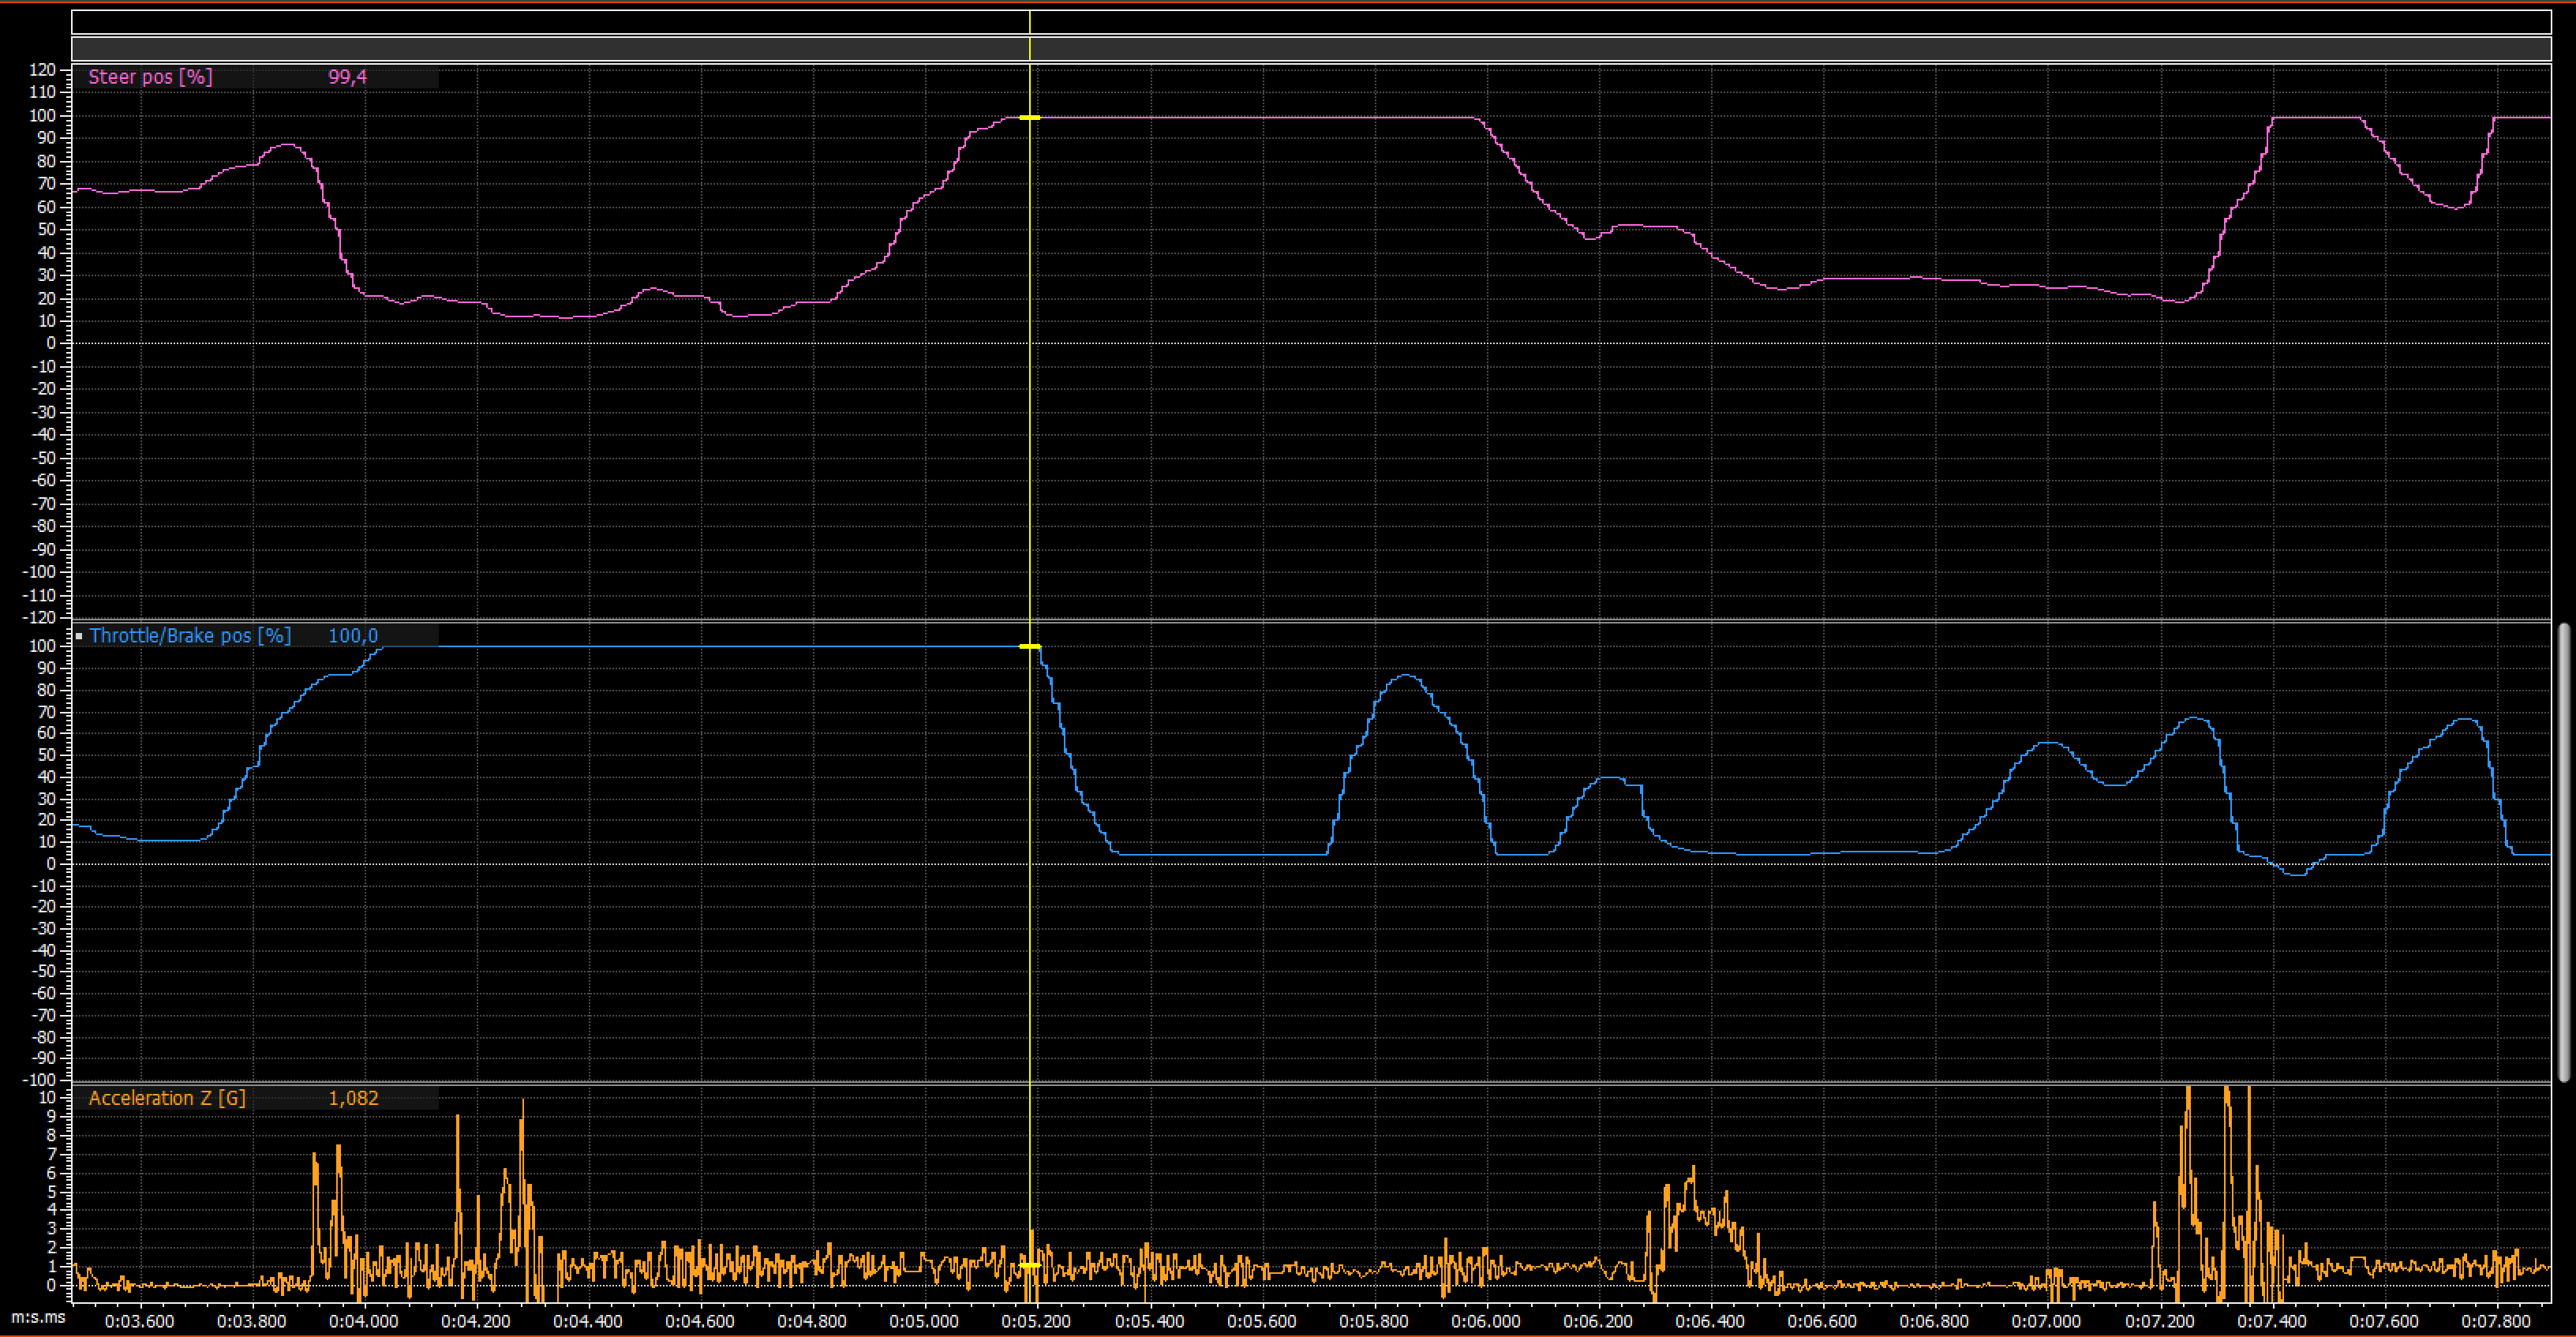
Here is two examples to show what can be seen in the data. Purple line shows steering input where positive values are wheels turning to left and negative values are wheels turning right. Blue line shows throttle usage where positive values is throttle and negative values is braking side.
The image below is from medium speed right hand turn and what can be seen here is the massive amount of corrections. You can see the corrections from the cursor location onwards where both steering and throttle have massive spikes. Very likely the car behaviour is not something what I wanted and tried correct it with both throttle and steering input. Likely this is a situation where car is understeering and now I disturb the chassis movement all the time by adding throttle and reducing steering. Probably I have complained about the understeering and chassis setup needs appropriate changes, but could I try smaller adjustments and different timing with both steering and throttle? Now I make steering adjustment at the same time as the throttle adjustment, so maybe I didn't the have confidence that is able adjust the possible oversteer what only throttle adjustment brings?
The second situation is from the same straight as the top speed example but different run. At the location of the cursor you can see the steering input is 99,4% and throttle is 100%. You also see the steering input will be in max position for a very long time and throttle stays in zero. This already tells us very clearly even we don't check any other channels that the car is understeering a lot and I'm just waiting for the car to turn in. At time 5.7 you can see that I'm able to go back on throttle for a short while, but it's a very long time (around 0.5 seconds) in a fast corner without throttle. This makes the speed decrease and the outcome is a slower lap time.
In RWD car most of the weight is on rear wheels when you are on full throttle and front wheels don't have that much effect, so maybe I could try to ease the throttle before starting to turn in and get weight moved to the front wheels to get better turn in. It might have the wanted effect but then I might have problem make it happen consistently each lap.
Key element here is the driver feedback and how it also needs interpretation. If driver complains either understeering or oversteering, then next thing is to find those situations from the data and link the comments to data based on feedback. Then it possible to analyse if the driver does something unusual when approaching the corner or if something can be done for the setup.
But it might be that the driver might not have complained anything because the car feels easy to drive and he is on a comfort zone. Unfortunately then it's difficult improve the car or the driving (i.e. improve the laptimes) and with help of data these points are possible to see and discuss with the driver if something different could be tried.
What's next
I hope this opens a little bit what data analysing enables. There would a lot examples to write about and you could definitely write a book about it but that's not the purpose in this case. I hope to get at least few people to get interested about data analysing and investigate it a bit. Data is not the absolute truth when it comes to improving the performance but it can be very valuable tool and give guidance.
I will write more about the topic and maybe get even more skilled persons to write something? Topics could be e.g. dampers, differentials, slipper clutch or driver comparison. Let's see what the future brings.
Hopefully next post is about sensors. What sensors I'm using and how those are fixed to the car. Thank you for reading!
Discussions
Become a Hackaday.io Member
Create an account to leave a comment. Already have an account? Log In.