 johnowhitaker
This is an overview of the project - each component will eventually get it's own project log with more details. While I work on this, the best place to get more information is my project report (available in the linked GitHub repository).
Introduction
This project arose because I wanted to do some experiments with Computed Tomography, but I didn't know enough to see what would work and what wouldn't. How many sensors does one need to achieve a particular goal for resolution or performance? What geometries work best? And what if we can't keep everything nice and regular?
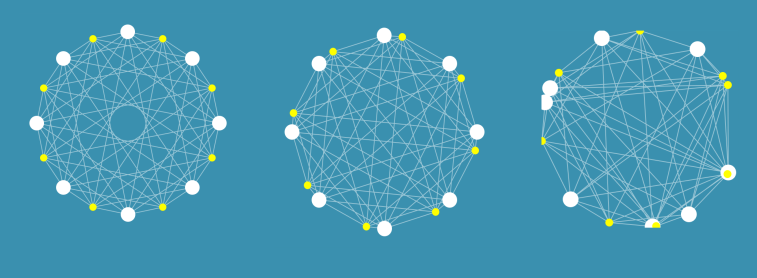
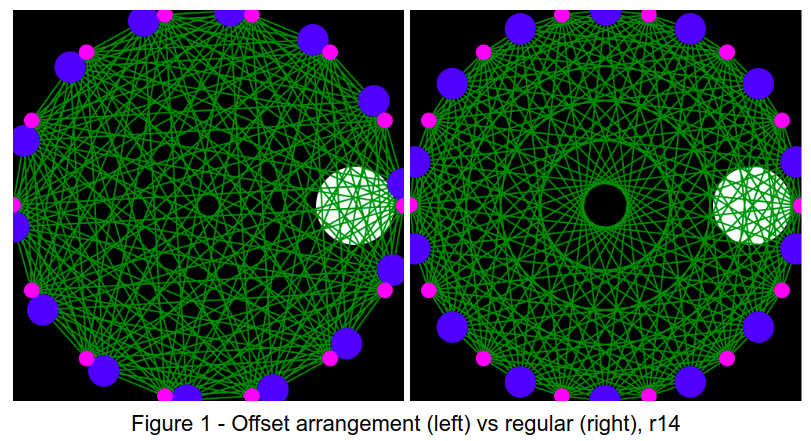
I built some tools that let me simulate these kinds of arrangements, and did some early experiments on image reconstruction and on the use of machine learning (specifically neural networks) to make sense of readings. Even with a weird arrangement like the on on the right, I could make some sense of the data. I'm not going to write up the simulation stuff here, but there is code and info in the GitHub repository. It will get tidied up and updated once the marking process ends.
I tested out these arrangements in the real world by building some fixed arrangements, and by using a 3D printed scanner to position an LED and a phototransistor (PT from now on) in different locations to slowly simulate having many detectors and emitters.
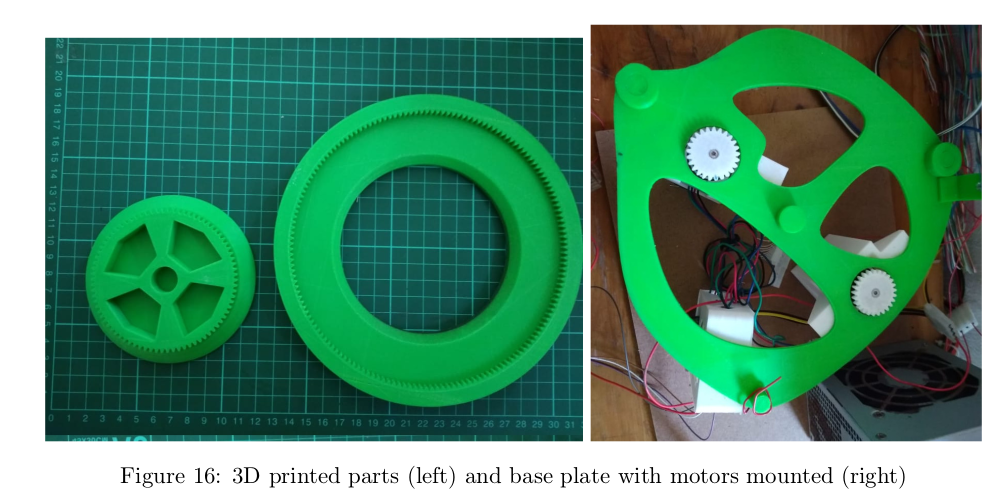
The Rotating Scanner
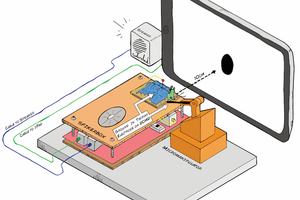
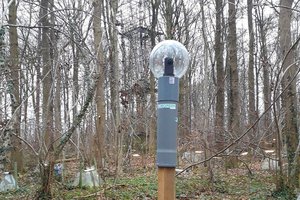
This was fun to build - it was pretty much my first project using my 3D printer, and man was it easy to get something working fast! There are two components to the top surface, each of which is controlled by a stepper motor. The drive circuitry would be familiar to anyone who has played with 3D printers or other CNC machines. A teensy microcontroller board drives the steppers in response to commands from the computer and reads the light intensity at the PT with the built in ADC.
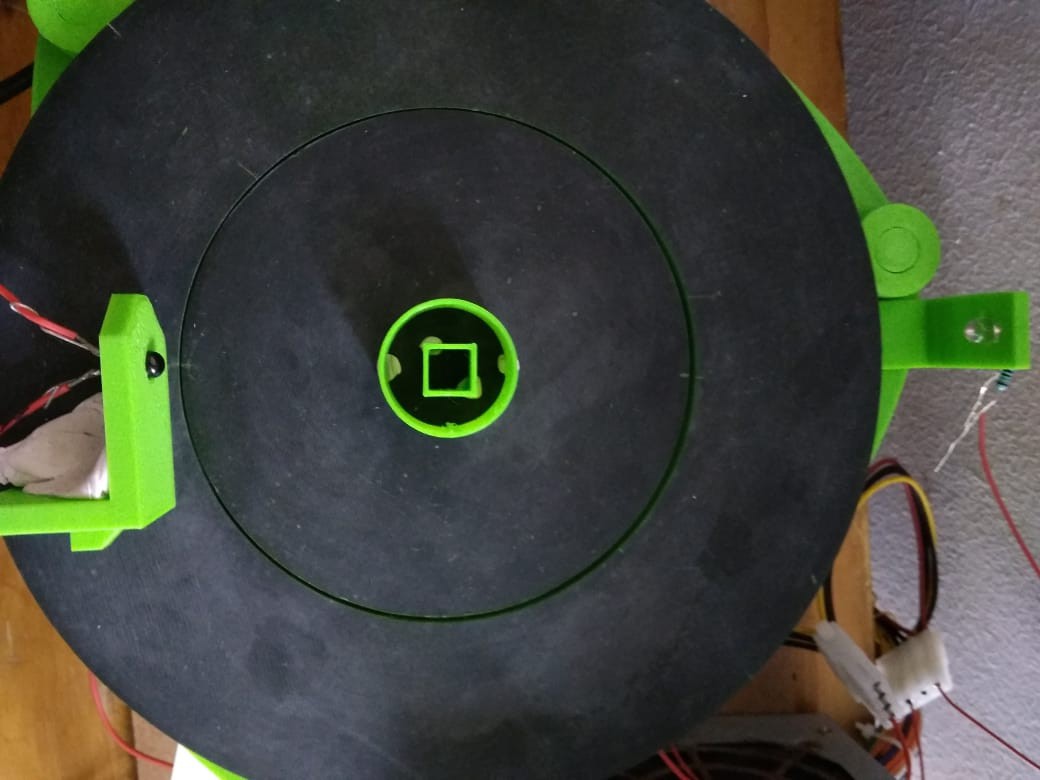
The above image shows a scan in progress. The outer ring moves the phototransistor around, taking readings. Then the object being scanned is rotated and the process is repeated. Here are some example scans:
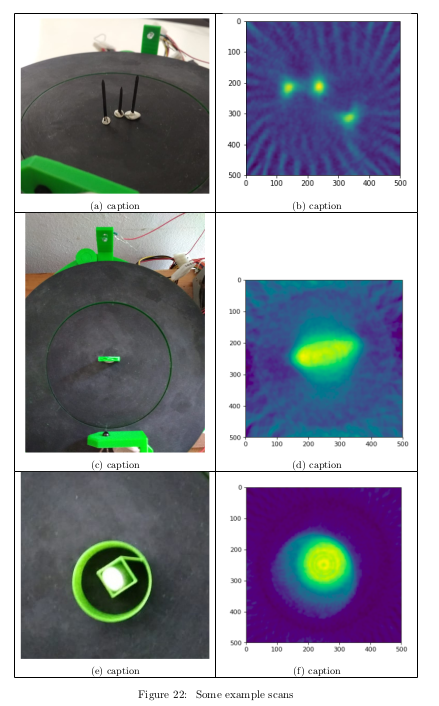
These scans were pretty rough, but with tweaking it could image 0.1in pin headers:
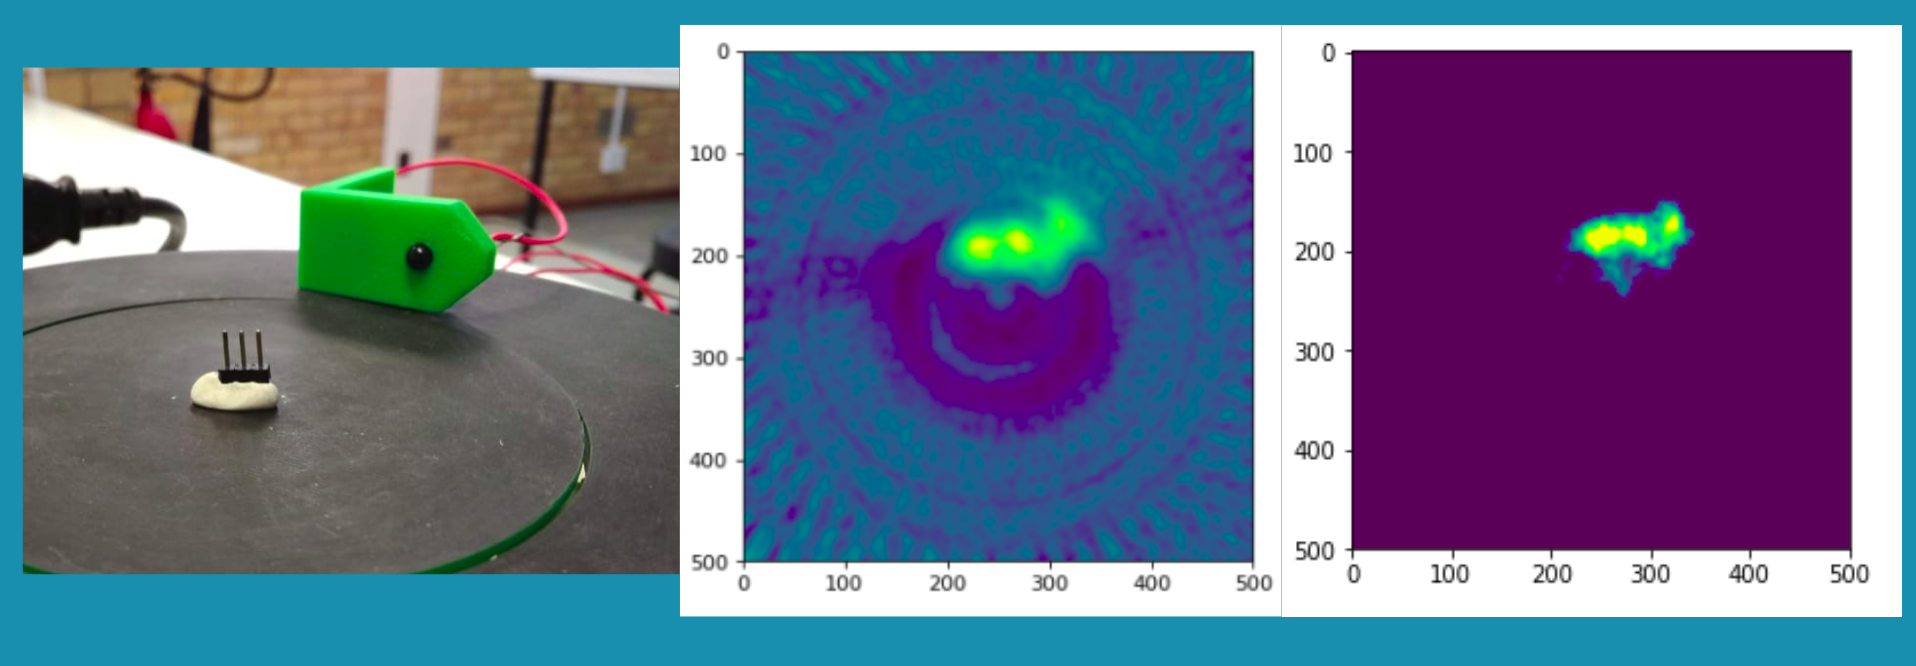
A view of the underside/internals
I'll post more on this if I get it out and do more scans, but that covers the basics. I can take a high-res scan and store that. Then later, if I'm looking building a ring of sensors with, for eg, 16 elements, I can see what the output would be by taking a subset of the higher res scan and working with that. So it let's me try out new arrangements quite quickly, in the real world. A useful tool!
Fixed arrays of sensors
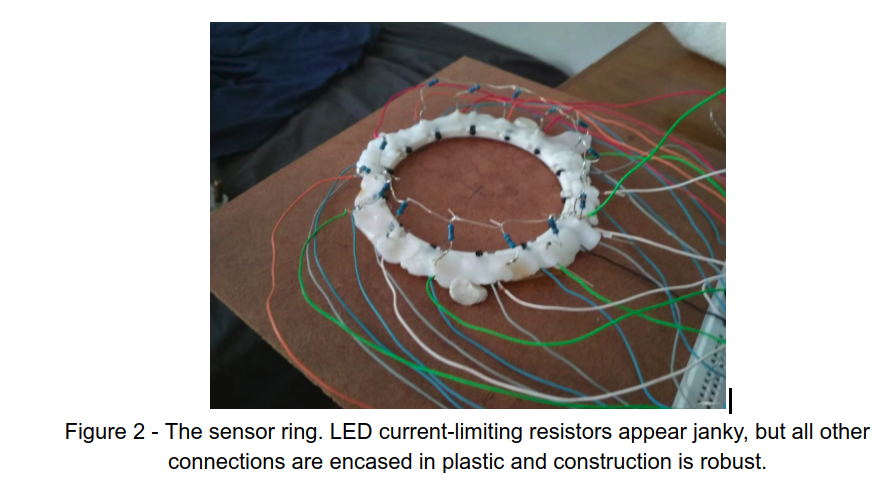
This was the end goal - building some sensor rings to take readings instantly rather than waiting for the rotating platform to build up a scan.
The first few I build had 8 LEDs and 8 PTs arranged in a ring:
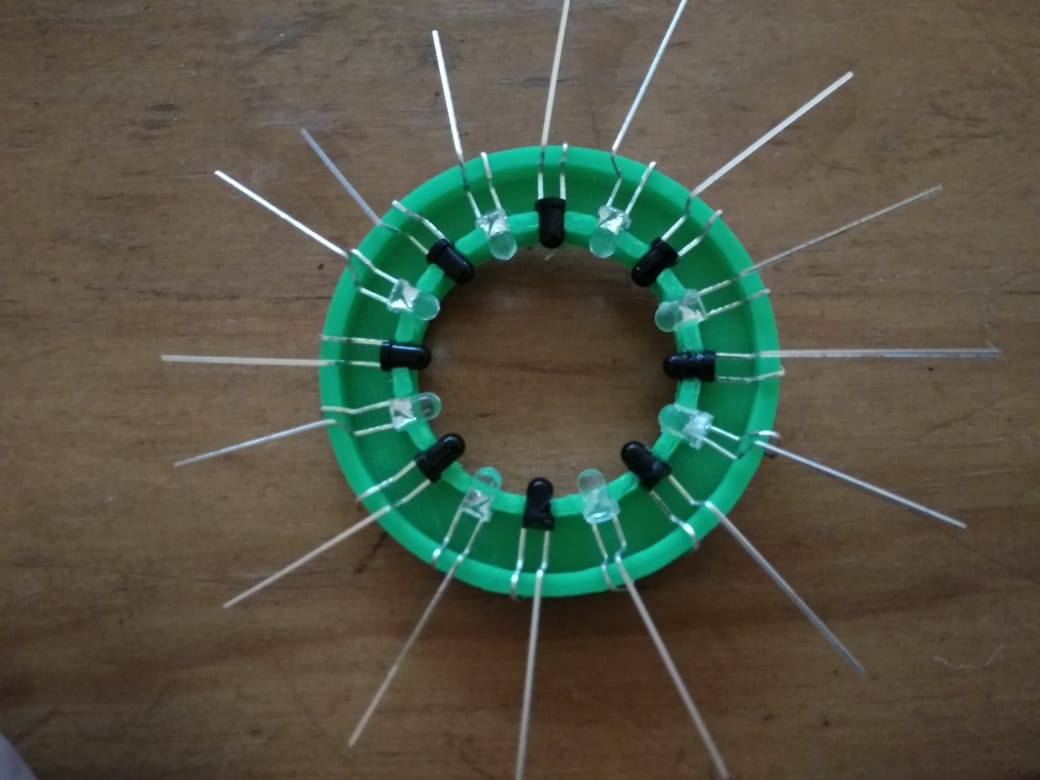
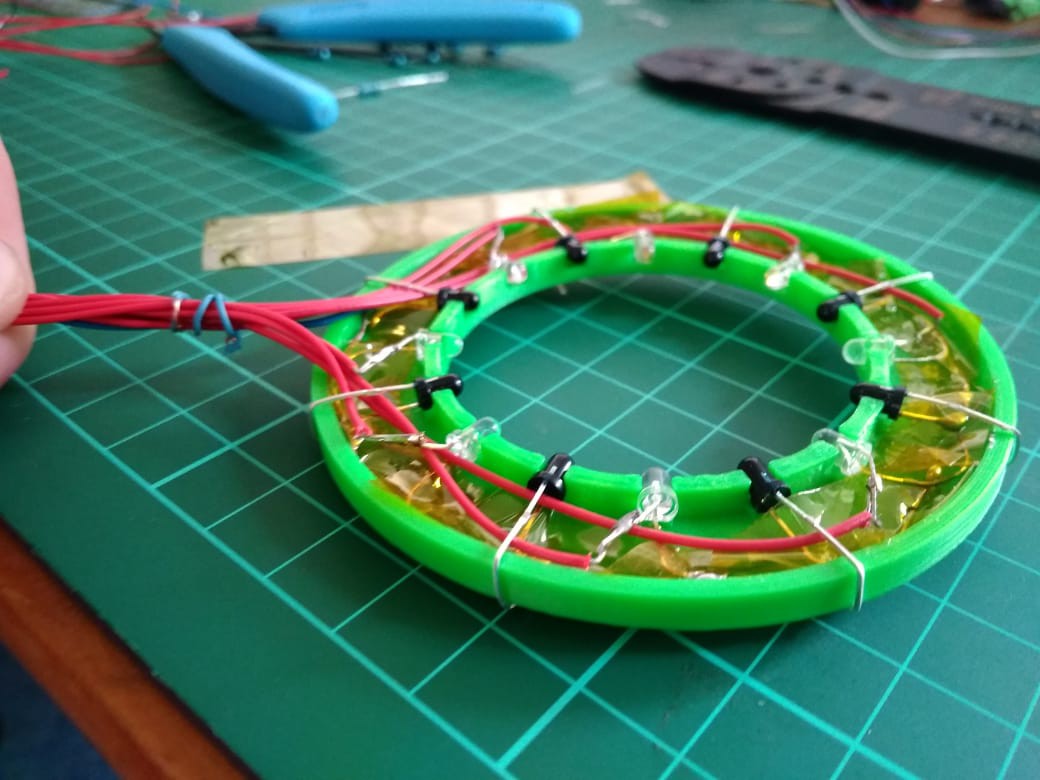
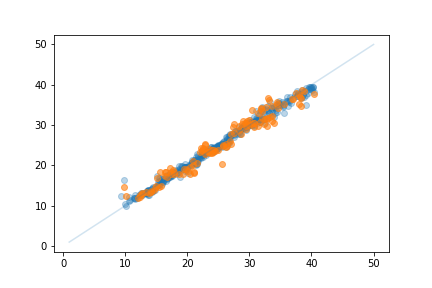
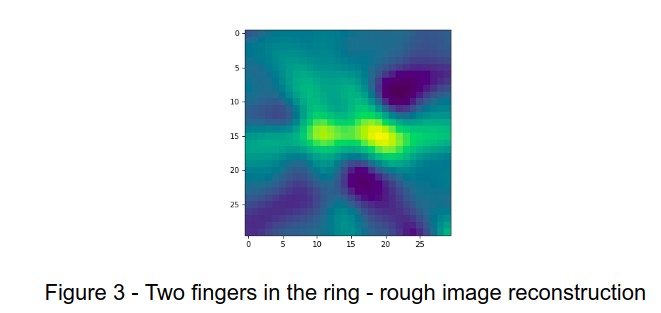
Image reconstruction on these was poor, as expected. But with some machine learning magic I could estimate position of an object within the ring to within ~3mm, and differentiate between different objects (for eg, pen and finger) with high accuracy. Pretty fun! I set up one ring as a game controller - a finger placed in the ring could be moved to steer a ship and dodge enemies.
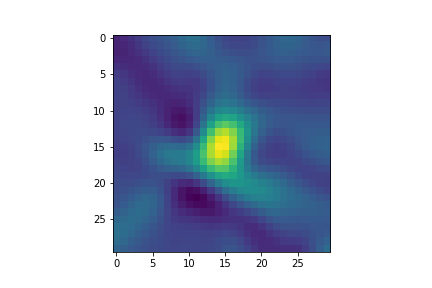
Raw image reconstruction of a finger moving:
I'll have to do a separate post about the ML work, or add info here later...
More recently, I've been building better rings and trying different arrangements. <TODO update on ring of 14


 Dieu My Nguyen
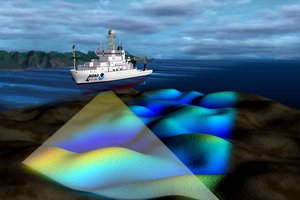
 Koen Hufkens
 Lars Knudsen
Neat project. We used the fact that IR passes through human flesh to detect gestures: https://www.youtube.com/watch?v=hCahI7ZRbOA
I will certainly follow your progress.