 Bud Bennett
ObsPy is a collection of seismological programs in Python (2 and 3) that aid in recovering streaming data for analysis, filtering and display of the data. The wiki page is here. ObsPy runs on nearly all modern OS platforms: Windoze, Mac, Linux. It can be installed on a Raspberry Pi with a simple command:
sudo apt-get install python3-obspy
It is much more difficult to get it running on a Mac. Embarrassingly, I have forgotten how I got it running on my Mac desktop machine so I'm no help there (it was either MacPorts or Brew).
I use ObsPy because I find it flexible and better documented than the other public domain seismology programs available in the wild. The filtering capabilities don't generate wild group delay distortion or strange transient effects like I've seen in other programs. This is important to me since the seismometer streams raw data from the cap2dig converter and it needs some post processing to get rid of temperature and drift artifacts.
Archiving Data:
The Raspberry Pi B+ that is attached to the seismometer is not powerful enough to do much more than manage the cap2dig converter and the ringserver. The CPU usage hovers around 40-50%. I tried to have it archive the data from the ringserver on a daily basis, but it bogged down the machine so badly that the ringserver failed. So now I have a separate Raspberry Pi 2 sitting on the network whose sole job is to archive the daily data stream generated by the seismometer. This is handy since the archival process happens whether or not my desktop machine is running. Every so often I transfer the archived data files to my desktop machine and can view the data anytime after that. It would be tempting to just increase the size of the ringserver buffer, but then the size of the buffer file gets too unwieldy for the ringserver.
The archiving program is seedlinkArchiver.py and is located in the files section of this project. It is managed as a service under systemd and starts upon boot up. I found that it is better to obtain short, 15 minute long, data snippets from the ringserver to avoid the higher probability of getting server errors with long data segments. The archiver checks the time every 10 minutes. If a new UTC day ends then it collects the previous day's data stream from the ringserver. The stream is collected in 15 minute chunks, which the user can lengthen or shorten. If there are gaps in the stream longer than 1 second, or there is a communication error, the program will try three times to get good data. Each chunk of the stream is then concatenated with the others to obtain the entire day's stream. Believe it or not, this approach is faster than just getting the entire day's stream in one long piece. The day's stream then high-pass and/or low-pass filtered to user adjustable values and then archived to a usb thumb drive in both filtered and raw data formats.
Viewing the Data:
There are two basic programs to view the data: directly from the ringserver over the network, or via the archived data streams.
seedlinkRemote.py is a program to view data over the network. (It is possible to get real-time data using a program called seedlink-plotter.py, but it can't really deal with raw seismometer data that contains a significant DC count offset.) I use seedlinkRemote when I wish to view quake events that have not been archived yet. The program has three options: a dayPlot, hourPlot, or custom plot. A calendar widget allows the user to pick a date and then offers the three choices. If the user chooses a dayPlot, he has the option of filtered/raw data, and the magnitude threshold of the event notation. A typical dayPlot with filtered data, and >5 magnitude quakes noted, looks like this:
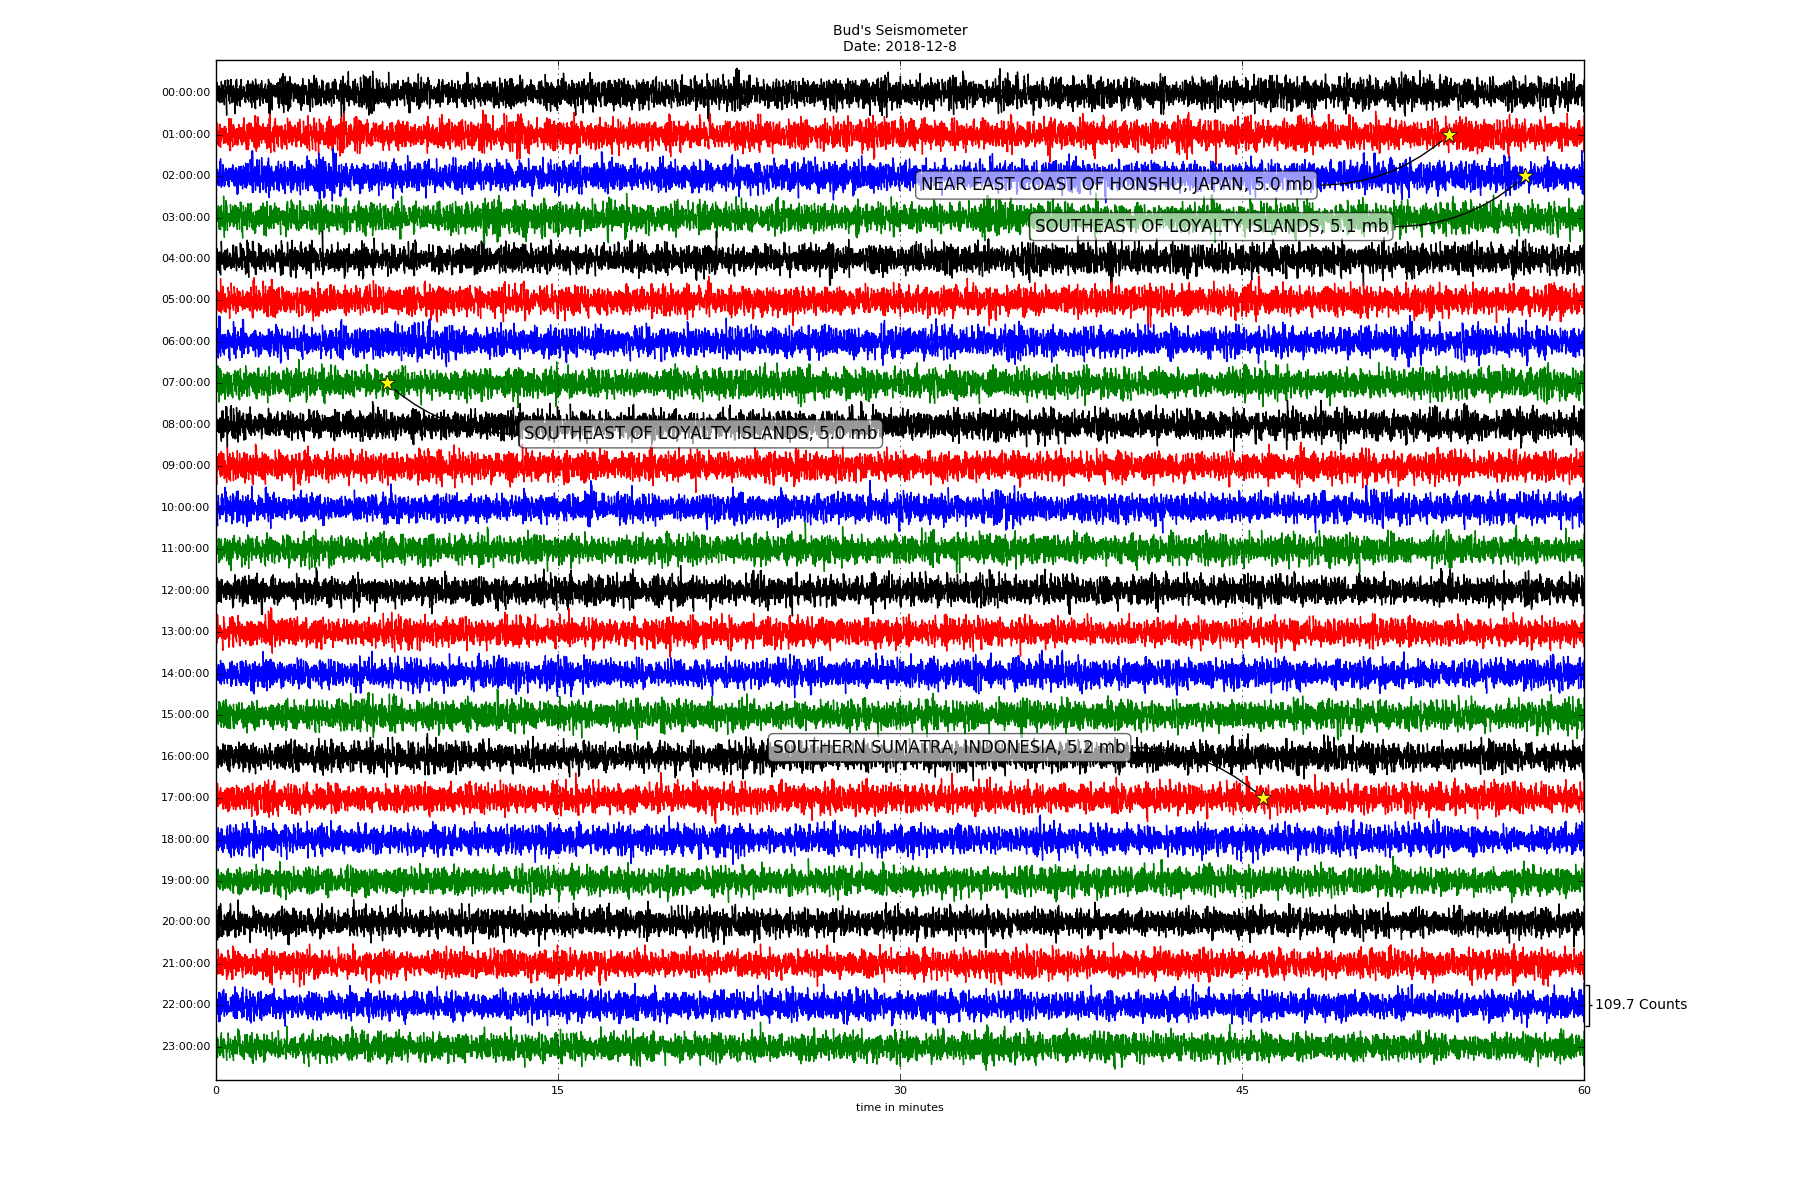
Pretty boring here in Colorado. We have very stable earth.
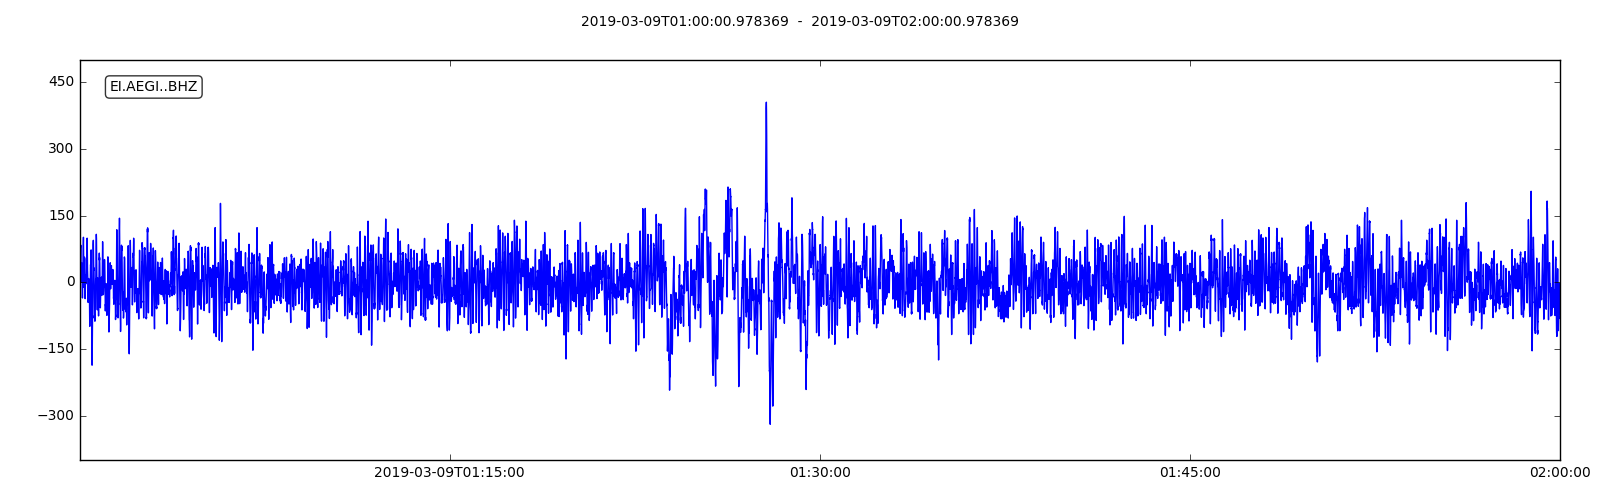
The hourPlot only allows for filtered or raw option (the junk in the middle is probably wind noise):

Custom plots are good for isolating a single event or getting some unique data. A custom plot will take user inputs of starting date/hour/minute and the duration of the plot along with filtered or raw as another option:
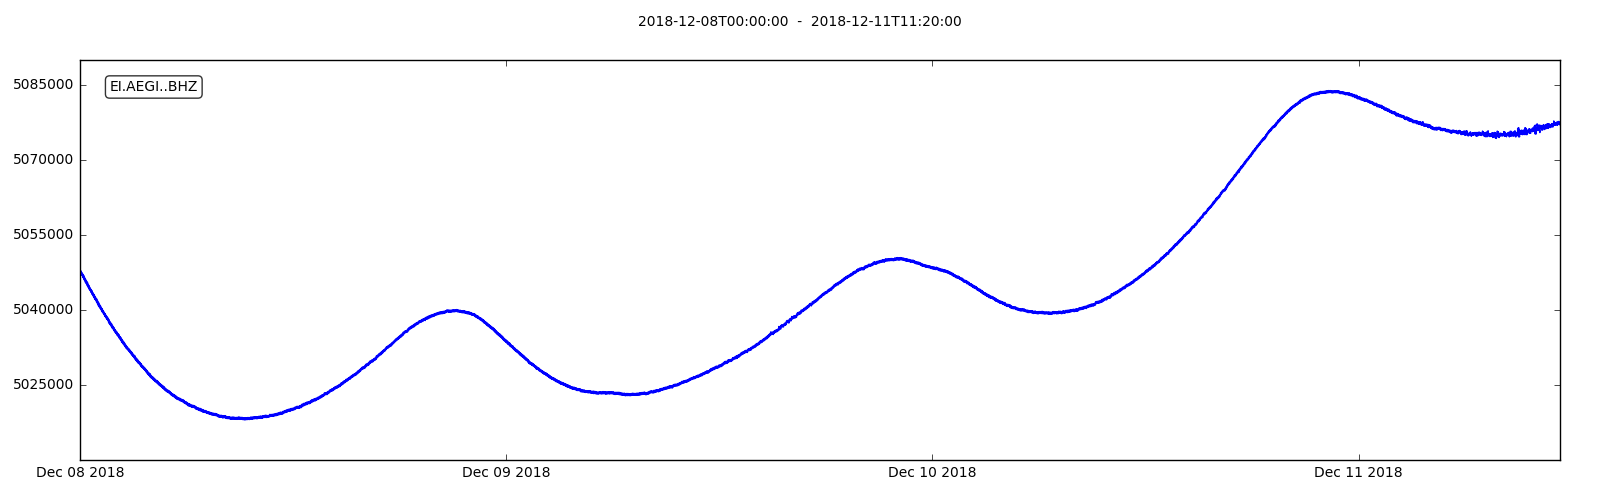
The above custom plot is raw data over a three+ day period (from the archive). You can see the magnitude of the daily temperature effect and its multi-day trend.
The program for viewing the archived data is ArchivePlotter.py. It offers the same options as seedlinkRemote.py but is much faster because the data is stored on the hard drive. The ArchivePlotter also has access to much more data since the ringserver only has access to the last few days.
Other ObsPy Capabilities:
You can also write programs that automatically detect earthquakes -- my program gives me too many false positives. I've only scratched the surface of ObsPy. Check out the tutorials to get an appreciation for what you can do with it.
Discussions
Become a Hackaday.io Member
Create an account to leave a comment. Already have an account? Log In.