 Ben Holmes
Since last time
Getting the PCB mounted in the case required desoldering the header pins for the input and output jacks, as well as the LED. It fits snuggly now, but I also have a reference design for the future so I know which way to solder the pots without trial and error. The only necessary socketed offboard connector is the DC jack as hardwiring it would prevent the PCB from coming free of the case.
Testing, 1 2 3...
From initial tests the circuit works fully. When the effect is bypassed there is no obvious change in signal (true bypass is great). When the effect is engaged it distorts plenty. The volume pot was wired backwards but with the socketed pins it only took a minute to fix.
The first proper test I ran on the circuit was around the biasing trim-pot, RV2. This ought to change the DC gain of the amplifier and effect the frequency response somewhat too.
The below image shows a the output of the pedal when driven with a guitar signal. The blue is when the bias is set to minimum, and the red when set to maximum (or it might be the other way around, orientation is confusing when I haven't marked the PCB).
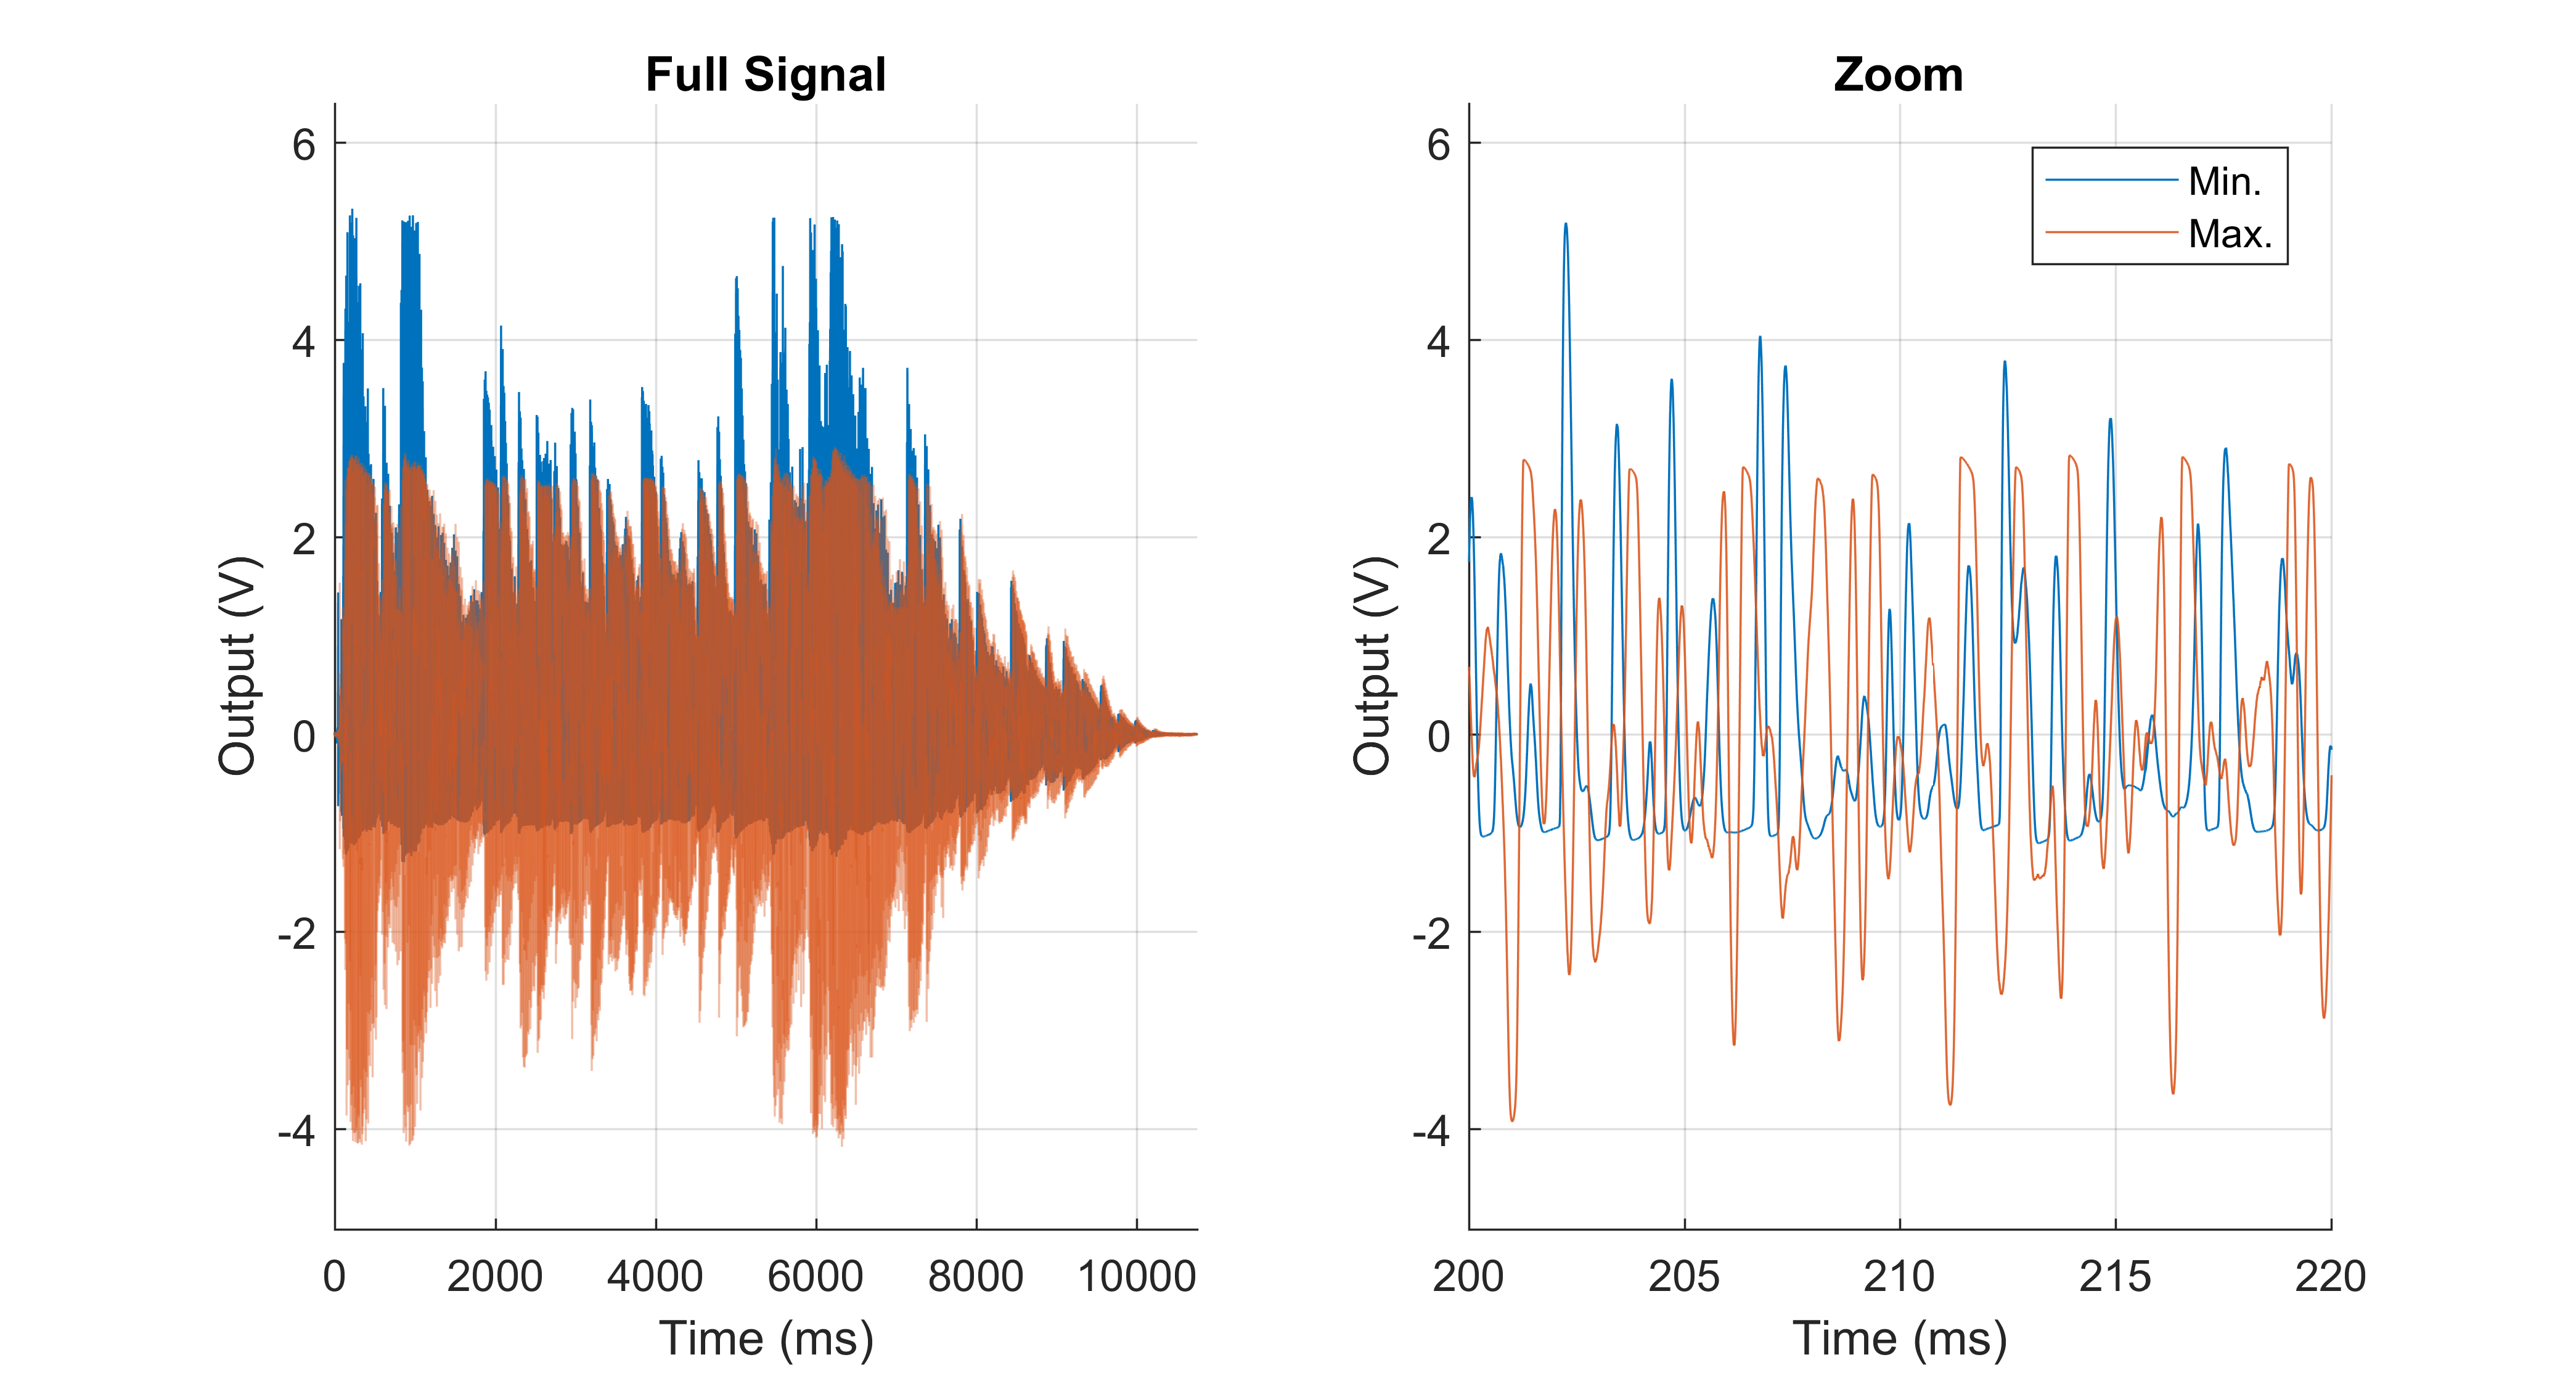
A huge change in bias can be observed, but I don't really know what this sounds like. When setting up a pedal for the beta testers I'll get them to play it while I calibrate the trim pot to see what tone they like best, and use this to work from.
Swept-sine technique
To gain some intuition about this I wanted to try a swept-sine characterisation, which basically provides an amplitude response at each harmonic of a signal, providing insight into the distortion behaviour. Results can be seen below:
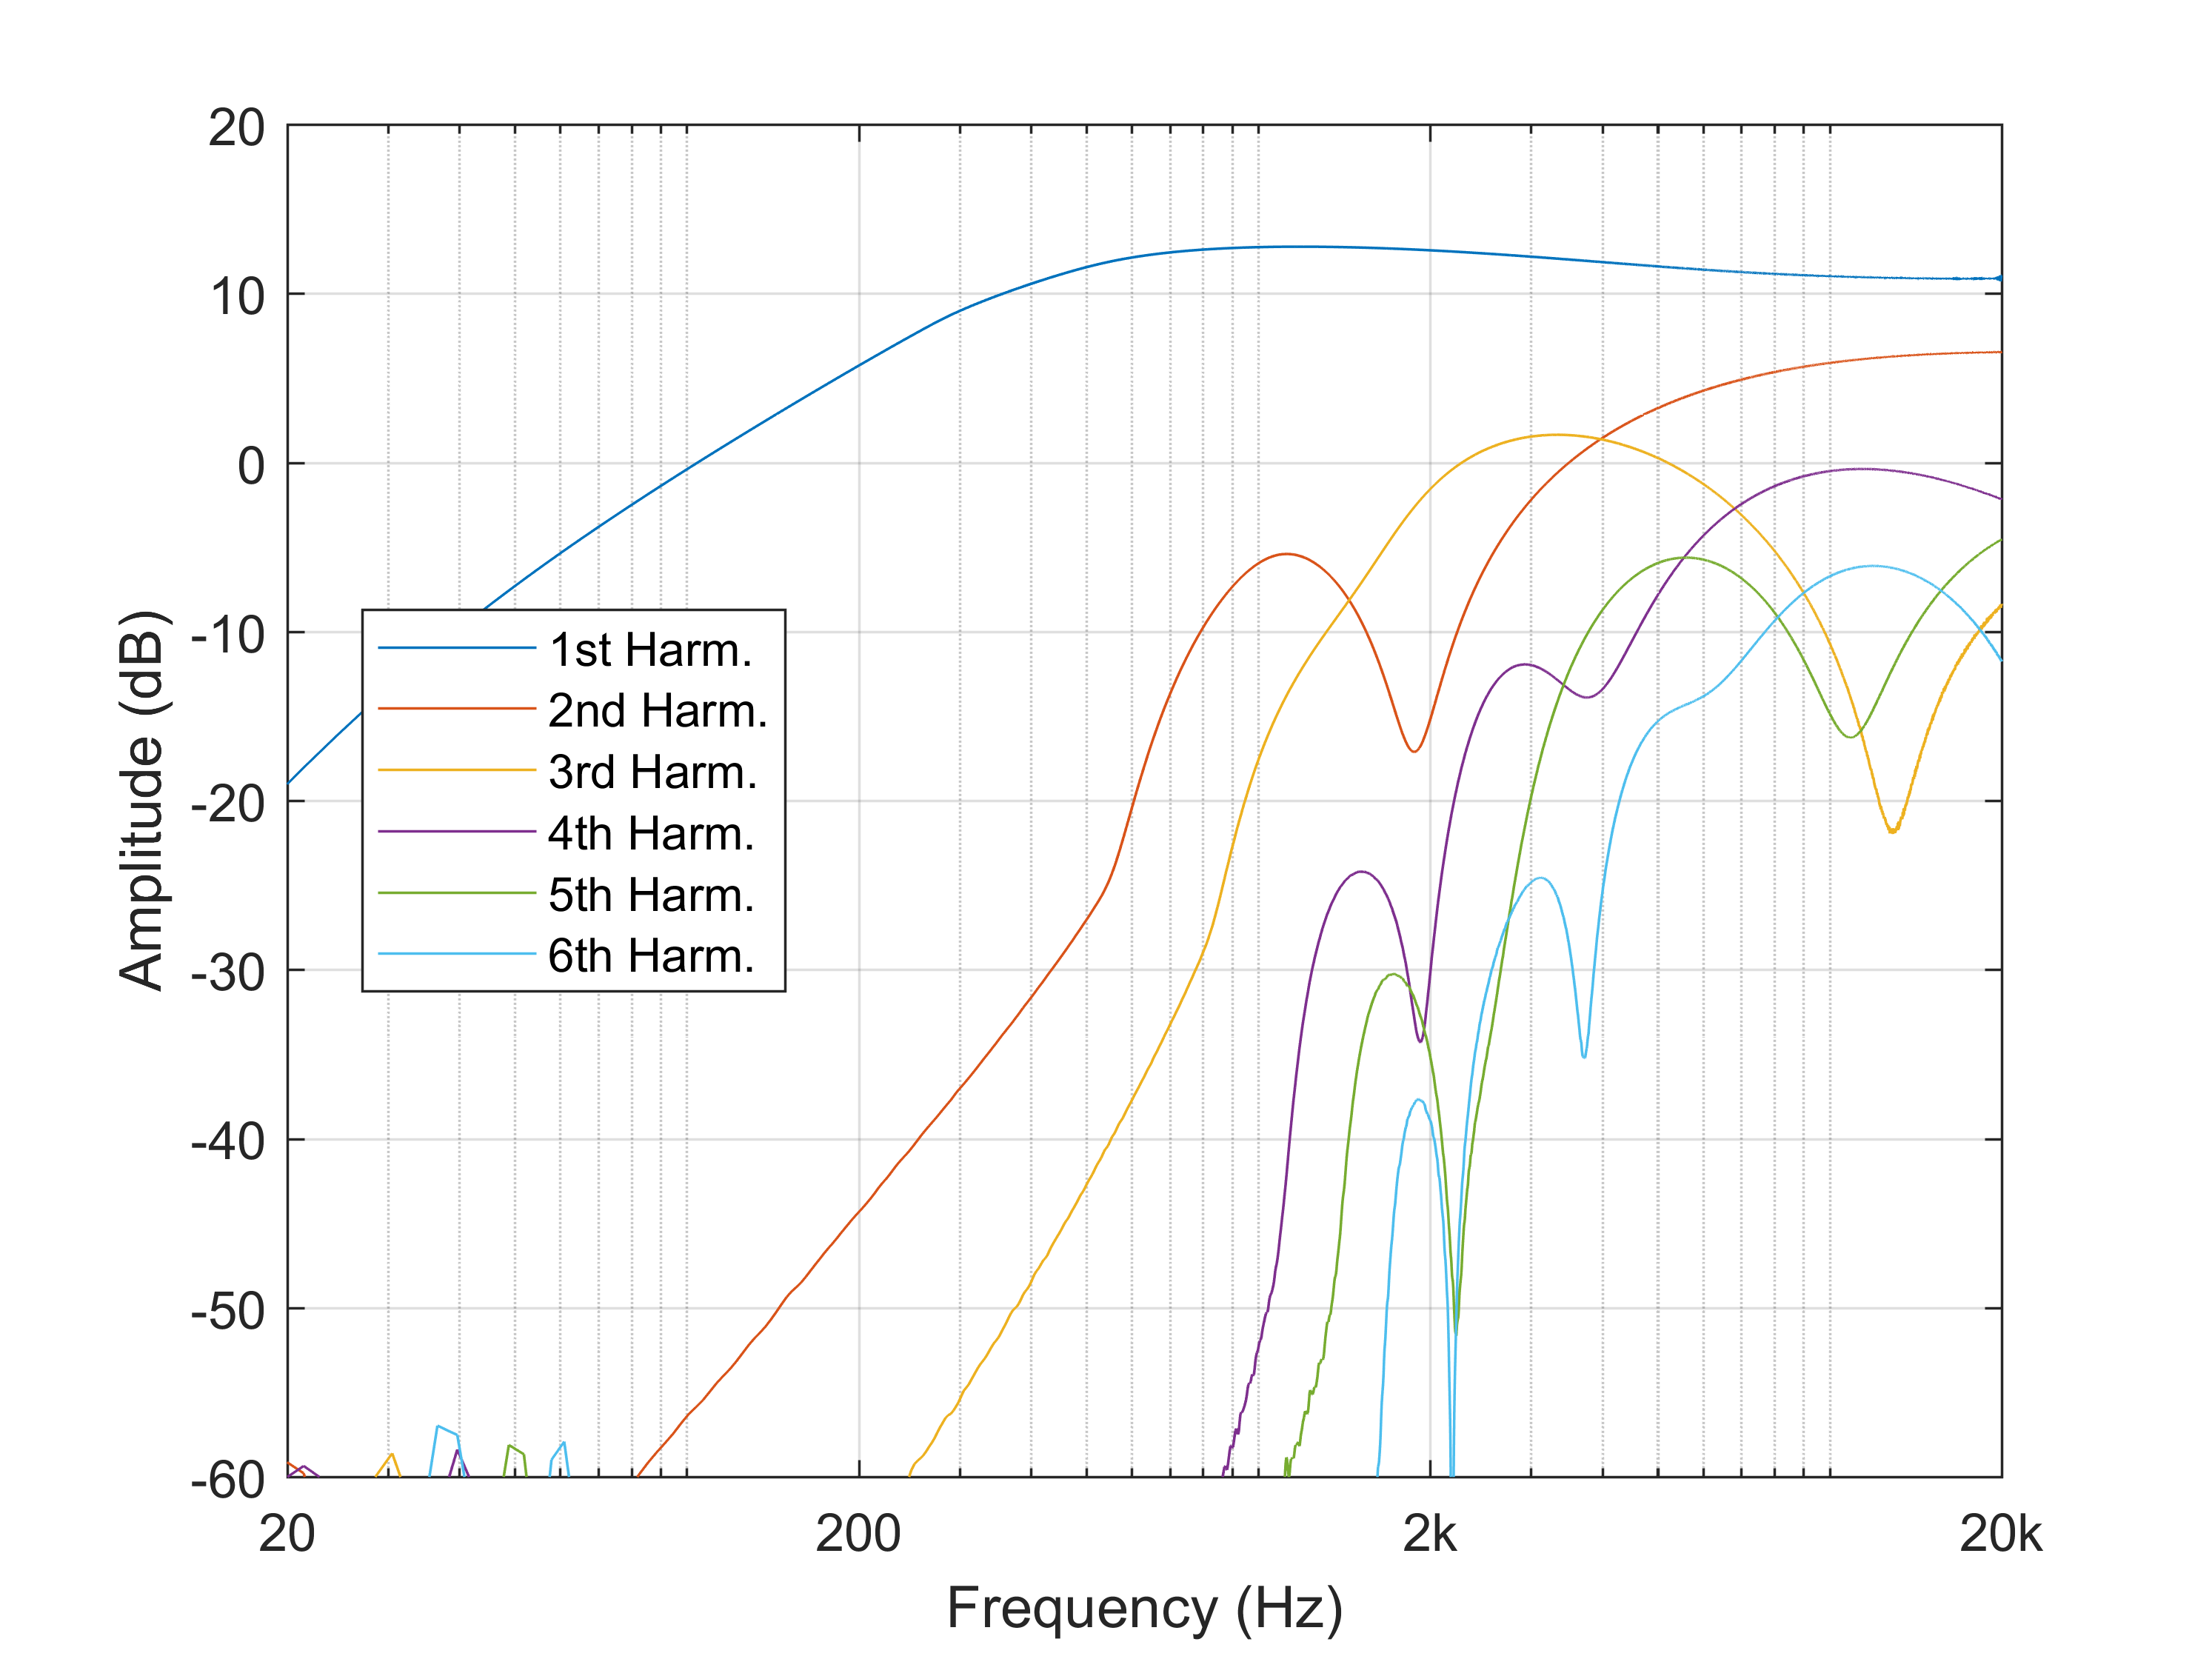
Here's a quick breakdown for the figure. It is an amplitude response, like that which you'd use to show the gain of different frequencies for a linear circuit. Most will be familiar with this concept if you've studied signals and systems. Instead of just the first harmonic (in blue), which is what you'd get with the typical amplitude response, this provides the response for the harmonics caused by the nonlinear behaviour of the signal. One gotcha of the process is that the higher harmonics will look more and more bandpassed as this is a limitation of the method - you need longer signals and FFTs to provide a wider pass-band range.
My basic interpretation of the plot is that the treble booster cuts the bass and boosts the treble, and there's a lot of distortion too. This data was gathered at maximum bias and full gain.
The test can be repeated for minimum bias:
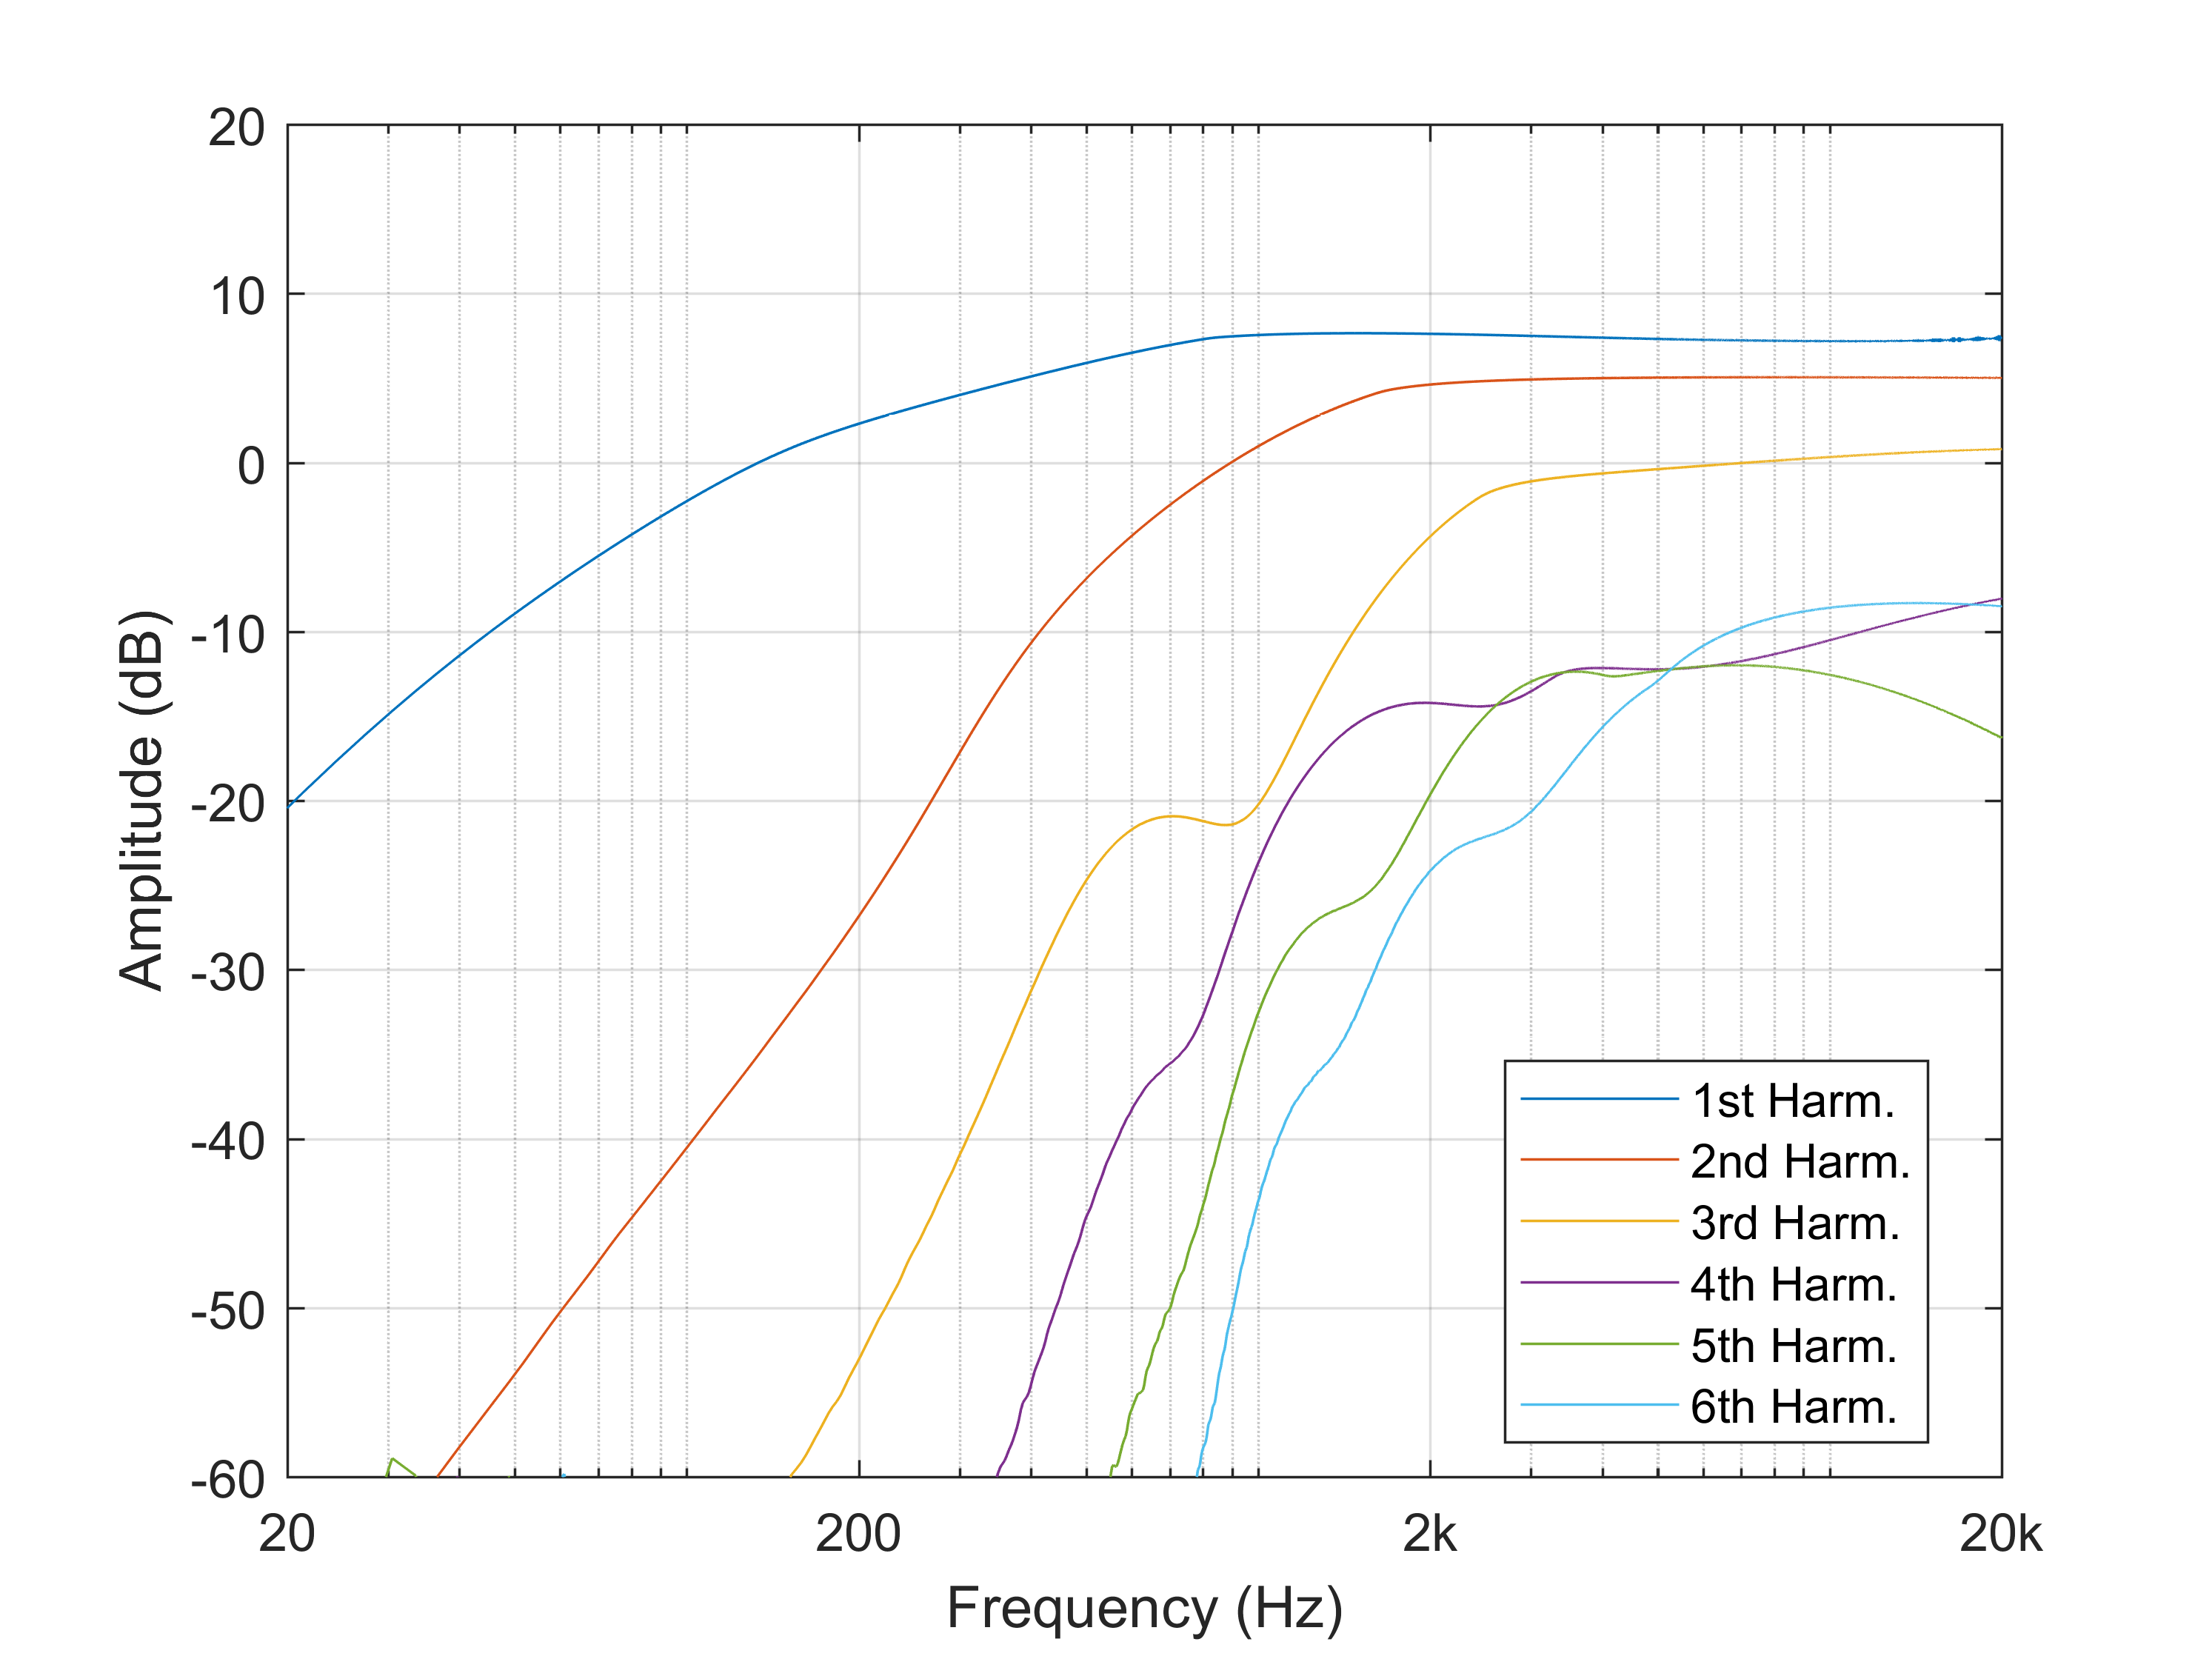
The response is clearly quite different, and again I don't know which sound will be preferred. What's cool about this representation is that once I've found "that" sound which users love, I can characterise it and calibrate the following pedals to match it. Sure you could do it by ear but why not get some data behind it.
Discussions
Become a Hackaday.io Member
Create an account to leave a comment. Already have an account? Log In.