 Max-Felix Müller
...and I can't quite explain it.
During my testing I finally managed to have the broad spectrum from earlier all as one continuous array (so the plot consists of one line only, so to speak). Running it over a range from 50MHz to 1Ghz I expedcted to see a range where my antenna picks up better signals since it iss in tune, but instead it all looks the same:
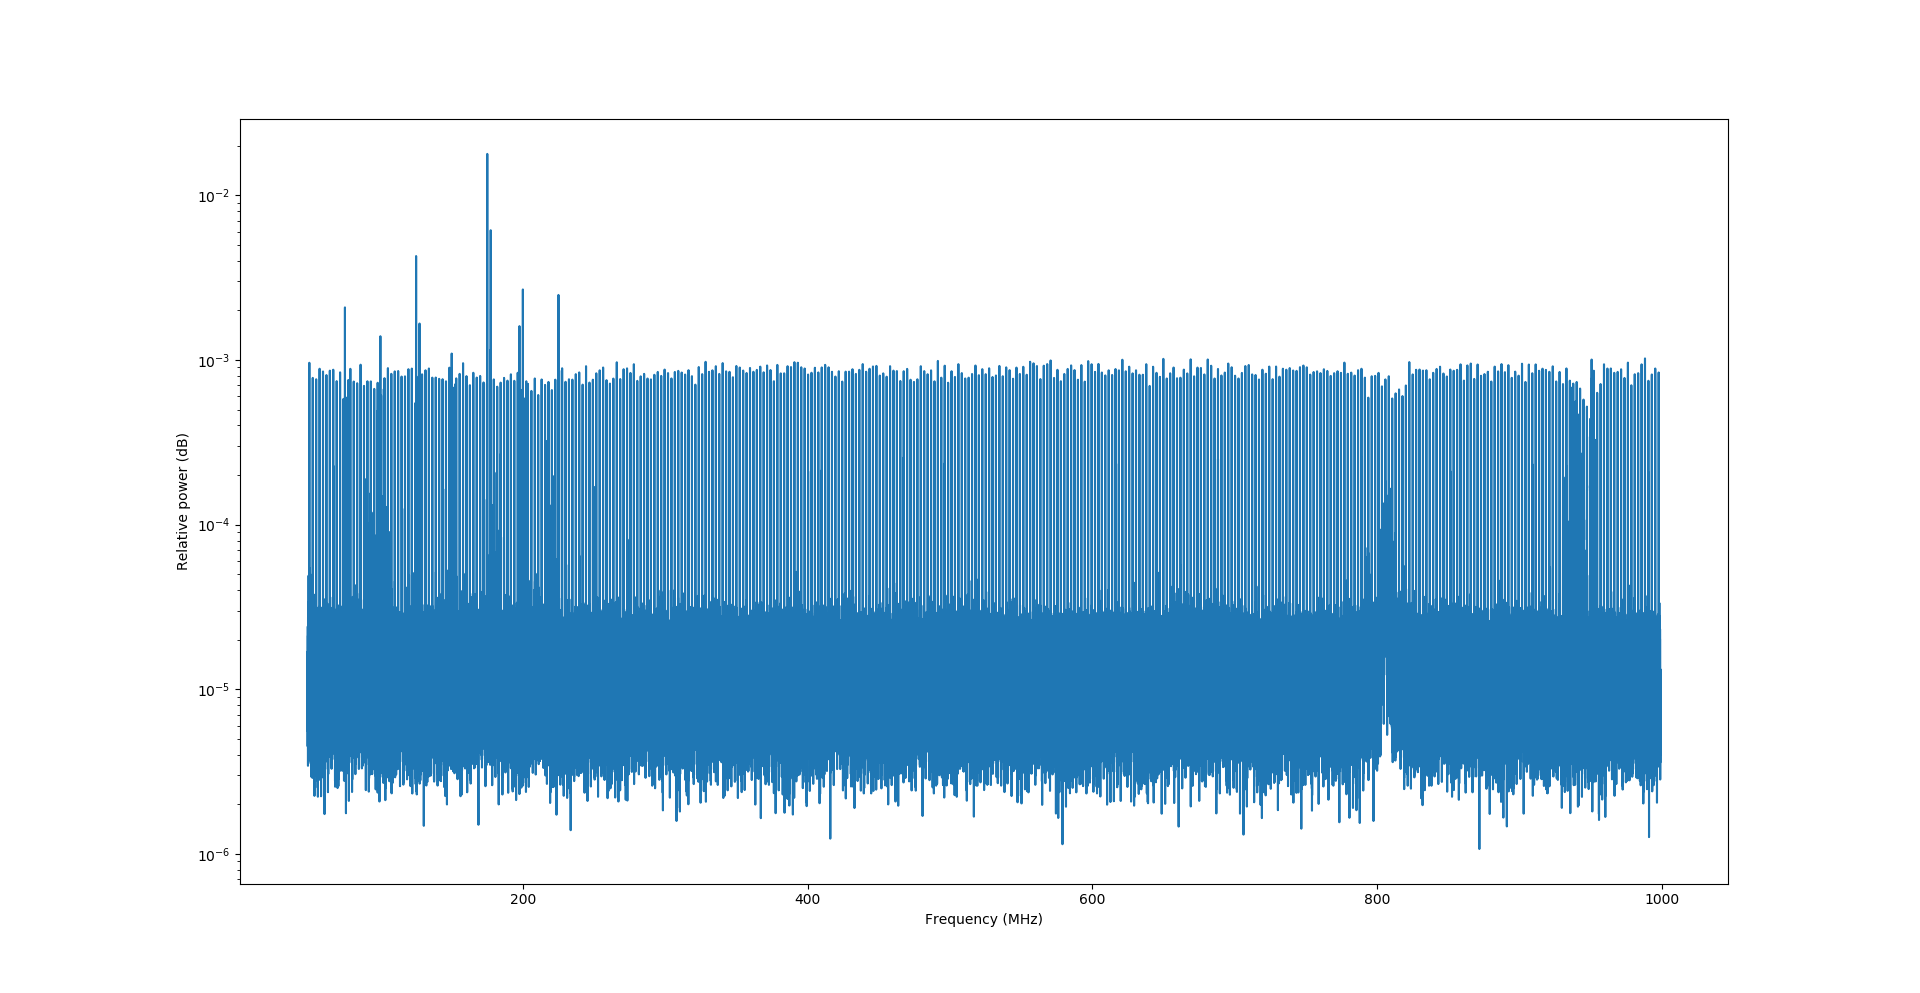
That's the full range I recorded.
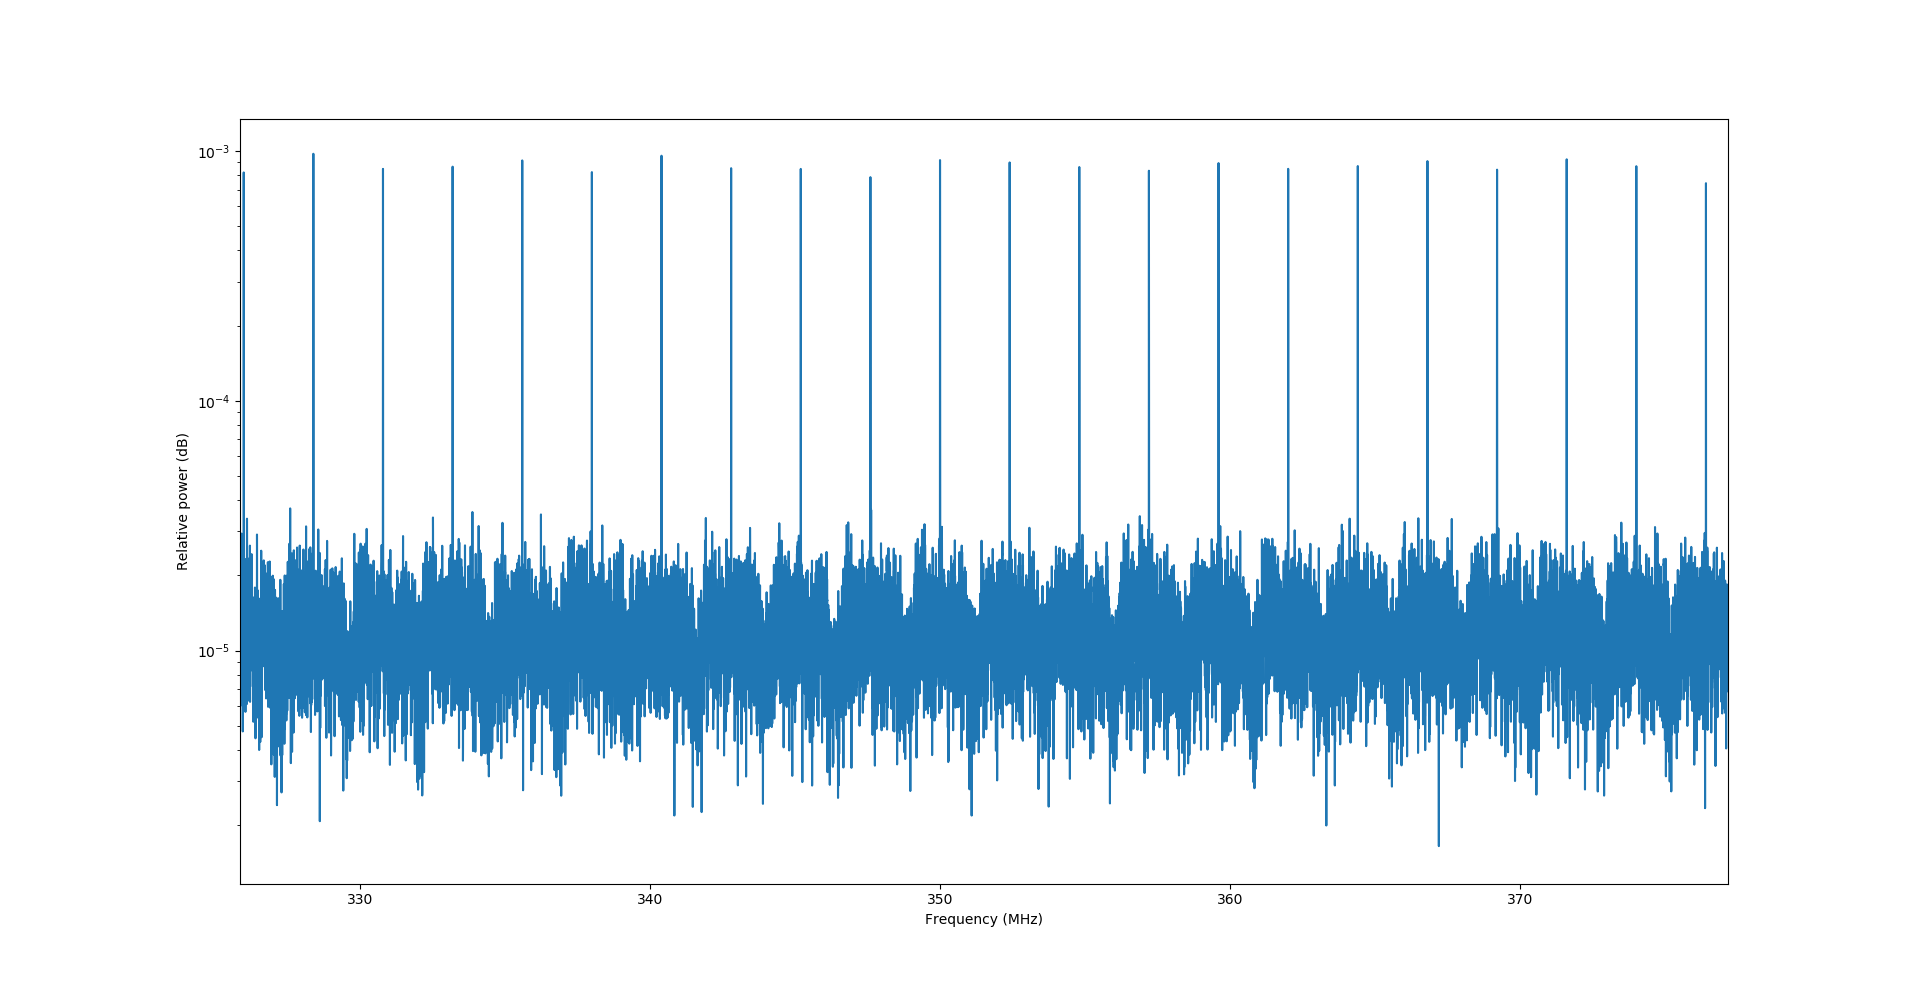
And here it is zoomed in at a random position.
Notice the repeating pattern?
My first suspicion was, that the center frequency is alwayys at the peak (which is actually true here). But when I ran the "live plot" code and moved the center frequency there the peaks stayed at their frequencies.
Here's another picture of that:
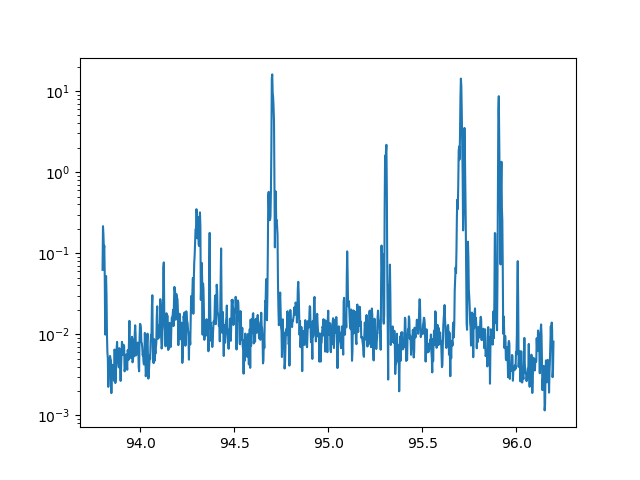
Notice that in this case, it is not the center frequency having the peak value.
Here the code I used to put the measurements in one array. Maybe there's a mistake I'm not aware of?
powe = np.ndarray(0)
freq = np.ndarray(0)

for i in np.arange(50, 1000, sdr.sample_rate/1e6):
    sdr.center_freq = i*1e6  # Hz
    samples = sdr.read_samples(8*1024)
    # use matplotlib to estimate and plot the PSD
    power, psd_freq = mlab.psd(samples, NFFT=1024, Fs=sdr.sample_rate /
                               1e6)
    psd_freq = psd_freq + sdr.center_freq/1e6
    powe = np.concatenate((powe, np.array(power)))
    freq = np.concatenate((freq, np.array(psd_freq)))
During my testing I also figured out what the sample rate I can set is actually about. It is the frequency span which is sampled. As an example setting it to 2.4Mhz (standard) and the center frequency to 94Mhz, the recorded data will be in the range 94Mhz +/- 1.2MHz. The limits I can set the sampling rate to are 1Mhz up to 3.2Mhz.
Discussions
Become a Hackaday.io Member
Create an account to leave a comment. Already have an account? Log In.