 Paul Schulz
Muon Detection Rate Data
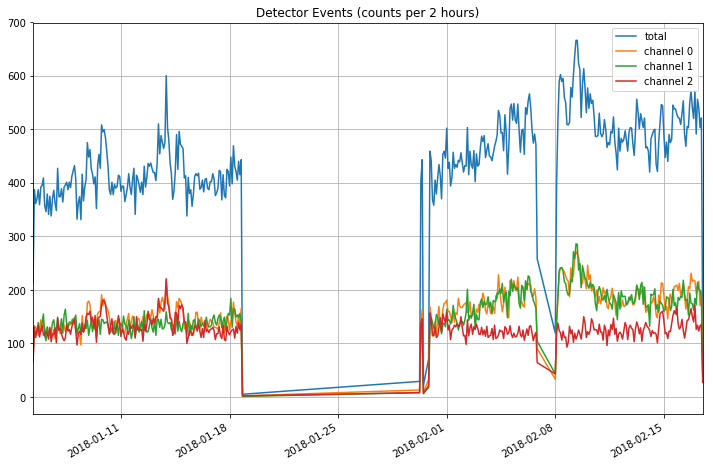
One of the muon detectors (cosmic-array-2-3) has been turned on and left running for an extended period of time and the event data collected, and is displayed in the graph below. (Click on the image to see all the details as the axes don't show up on black with the transparent background.)
Notes:
- The large break in the data was when I was at Linux.Conf.Au., doing a presentation on the project (and at the embedded miniconf). The other break was when I had to unplug the detector because it was stopping someone in the family going to sleep.
- The detector has been aligned oriented North-South with the power lead pointing North.
- In this detector, the Red(0), Green(1), Blue(2) channels have been wired into the RaspberryPi in the order Red,Blue,Green, which doesn't match the other detectors. Blue and green channels have been swapped.
- The colours in the graph do not match the channel colours.
Observations on the data:
- Channel 2 has a consistent rate of about 130 counts per 2 hours (120 sec) over the entire period.
- Channels 0 and 1 start at the same rate, but increase together to almost double in the second half of the graph before falling back to around 50% higher than channel 2.
- A daily cycle of minimums and maximums can almost inferred between 2018-02-01 and 2018-02-08 (if you squint a little bit).
Data Processing
This data was collected directly on RaspberryPi Zero W in the Cosmic Array muon detector (cosmic-array-2-3) and logged to a file in the form of 'timestamp channel', where the timestamp is a Unix timestamp (seconds since 1 Jan 1970) with microseconds.
1516084564.897229 1
1516084600.713800 2
1516084615.300136 1
1516084617.992265 0
1516084673.840925 0
1516084676.053668 0
1516084686.885977 1
...
Using interactive python workbook software, Jupyter, this data was read and processed with the Pandas library and plotted with matplotlib.
All scripts and data are available in the Github repository - PaulSchulz/cosmic-array-science
Discussions
Become a Hackaday.io Member
Create an account to leave a comment. Already have an account? Log In.