 Rajbir Singh
Things used in this project:
Hardware components
National Control Devices IoT Long Range Wireless Temperature Humidity Sensor
National Control Devices Long Range Wireless Mesh Modem with USB Interface
Software apps
Story
Introducing NCD’s long-range wireless temperature-humidity sensor, boasting up to a 28 Mile range using a wireless mesh networking architecture. Incorporating the Honeywell HIH9130 temperature-humidity sensor transmits highly accurate temperature and humidity samples at user-defined intervals.
The onboard temperature sensor is rated for -25°C to 85°C or -13°F to 185°F and the humidity sensor is rated for 0 to 100% RH. It can be powered by just 2 AA batteries and an operational lifetime of 500, 000 wireless transmissions. Battery life can be extended up to 10 years depending on environmental conditions and the data transmission interval. Optionally, this sensor may be externally powered.
With an open communication protocol, this IoT wireless temperature humidity product can be integrated with just about any control system or gateway. Data can be transmitted to a PC, a Raspberry Pi, to Microsoft Azure® IoT, or Arduino. Sensor parameters and wireless transmission settings can be changed on the go using the open communication protocol providing maximum configurability depending on the intended application. The long range, price, accuracy, battery life and security features of Long Range Wireless Temperature Humidity Sensor makes it an affordable choice which exceeds the requirements for most of the industrial as well as consumer market applications.
Steps to Send Data to LabView Utility
- At first, To visualize the data, we need a Labview utility application.
- To use this UI, you will need to install the following drivers:
- Install run time engine from here for 64-bit driver and 32-bit driver.
- Install NI Visa Driver.
- Install Labview Run time serial driver and LabVIEW Run-Time Engine.
- Getting started guide for this product.
Setting Up Node-Red.
Now that you have sensors running, we need a way to do something useful with that data.
- First of all, you’ll have to install Node-Red.
- Once that’s done, you’ll need to enter your command line, or Power Shell for Windows users, navigate to the directory Node-RED is installed in.
- Now type “npm I ncd-red-wireless node-red-dashboard“. This will install the nodes required to receive data from your wireless sensors and you can start Node-RED once this is done.
- To start node server write node-red in the command prompt or terminal and press enter.
Steps to Build the Flow:
Step 1: At this point, you’ll be viewing a large blank flow with a long list of nodes on the left-hand side, this sidebar is called the palette.
Step 2: Go ahead and drag a Wireless Gateway node over to your flow canvas to get started.
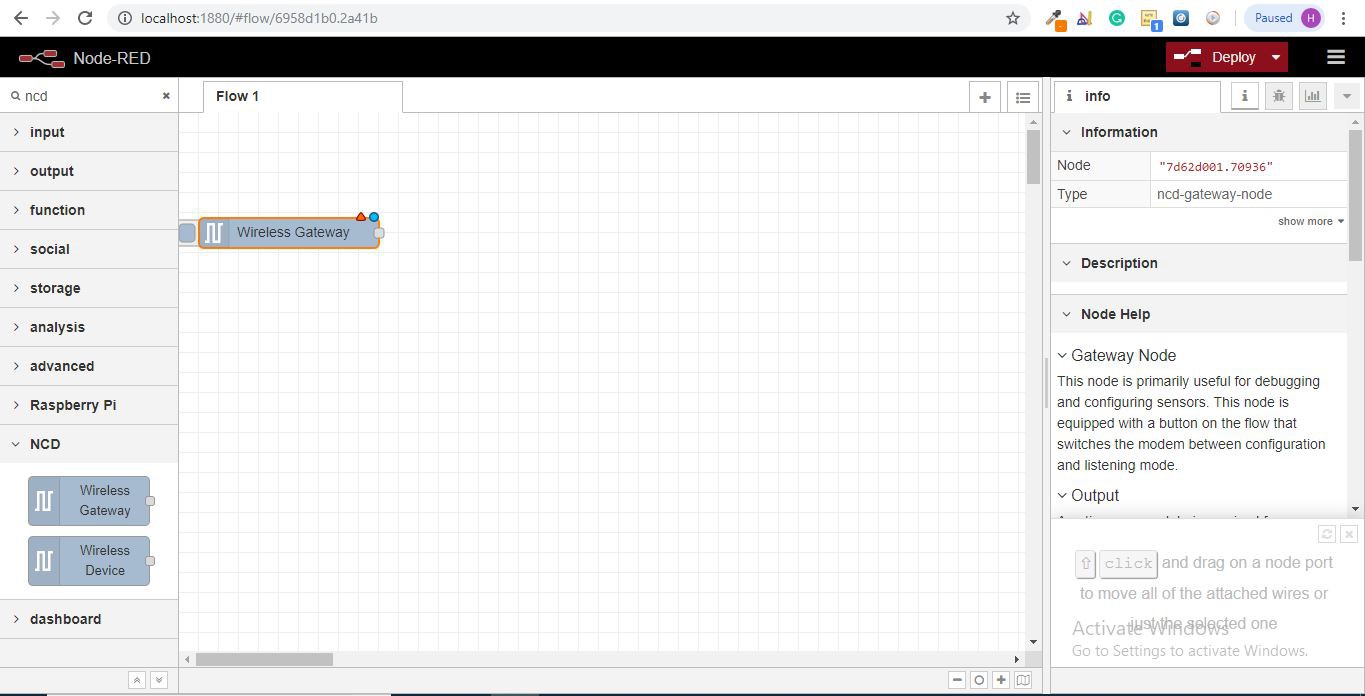
NCD-red-wireless Provides the nodes that manage the serial connection, parse incoming sensor data, filter it by specific parameters, and allow you to configure the wireless sensors.
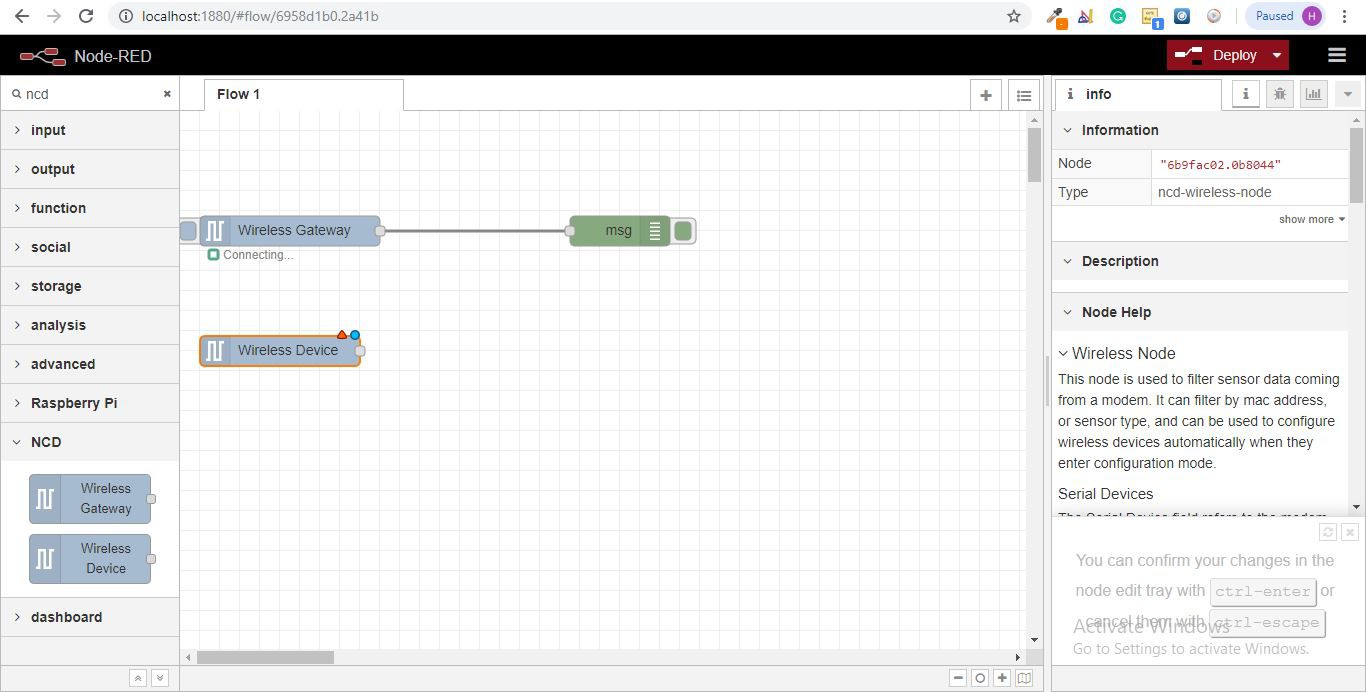
Step 3: Finding Your Wireless Sensors:
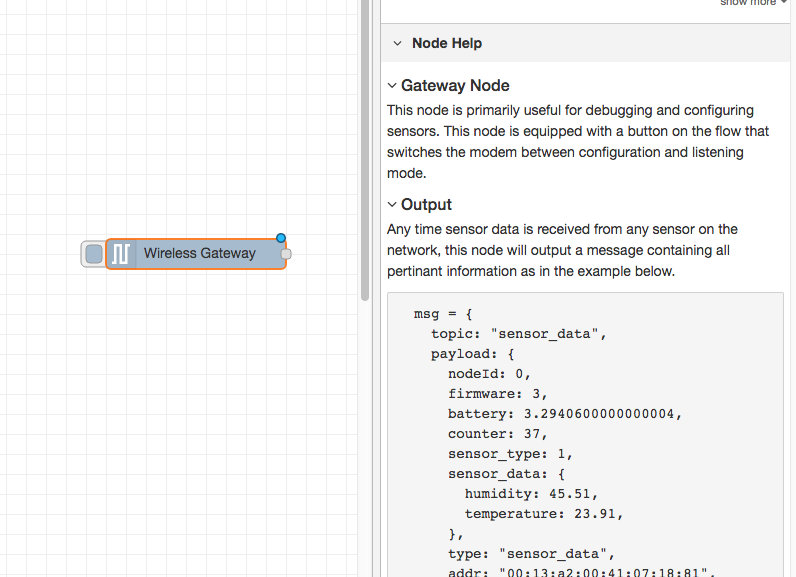
When you’ve delivered the node you’ll be able to view the info tab, which contains records about the node’s capability, this tab is well populated for maximum node-red packages and consists of treasured statistics, often you will now not want to view any other documentation outdoor of the info tab, so hold it in thoughts even as you’re building your flows when you have a question approximately how a node works. The next element we want to do is configure the node, when you first add it you’ll note that there is a small triangle at the top right corner next to a blue dot, the triangle indicates that the node wishes extra configuration, the blue dot indicates that the node has no longer but been deployed as part of the flow.
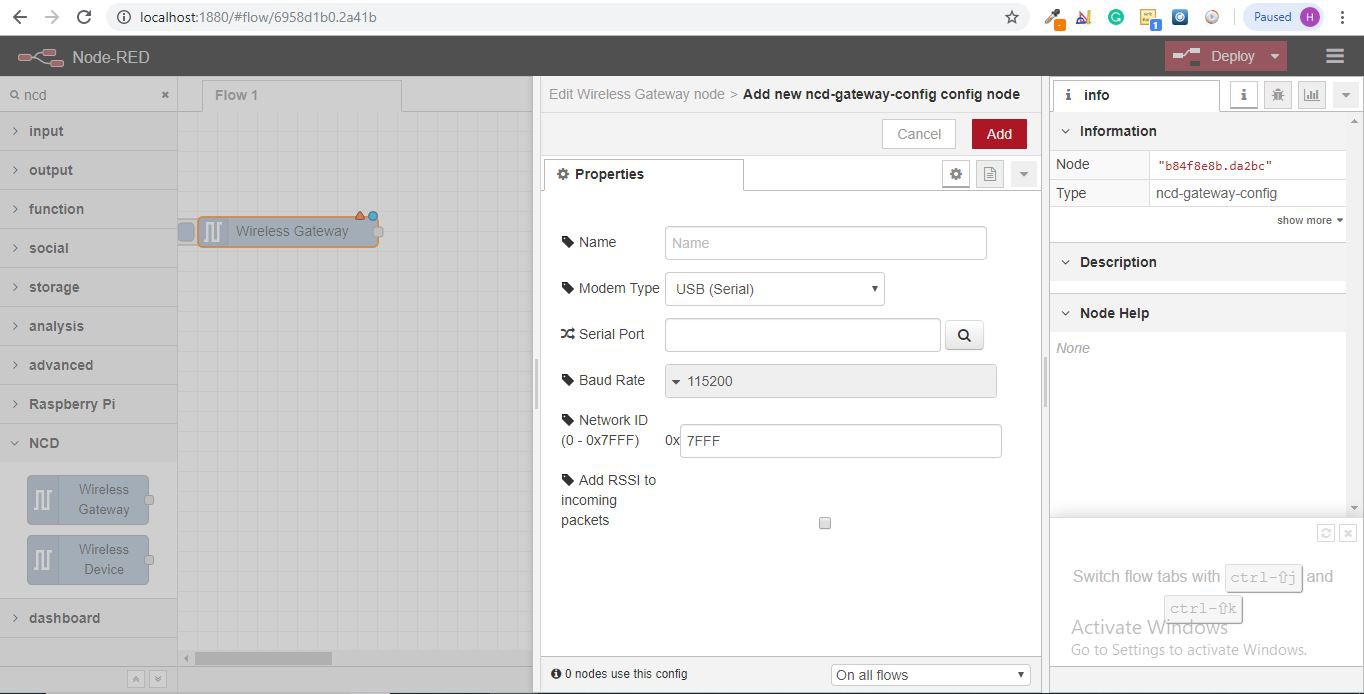
- Double click on the node to open up the configuration options.
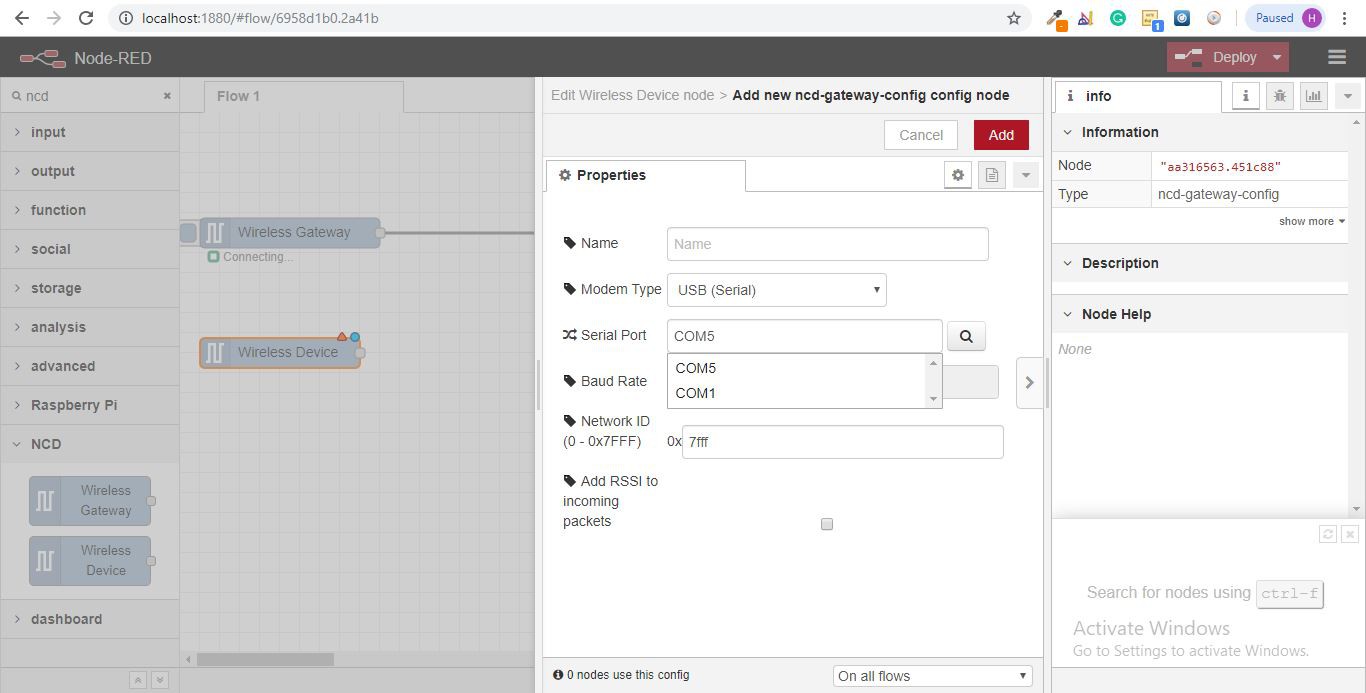
- Click on the pencil icon next to the Serial Device field to configure your USB router, this will open a second configuration panel that only has a few options.

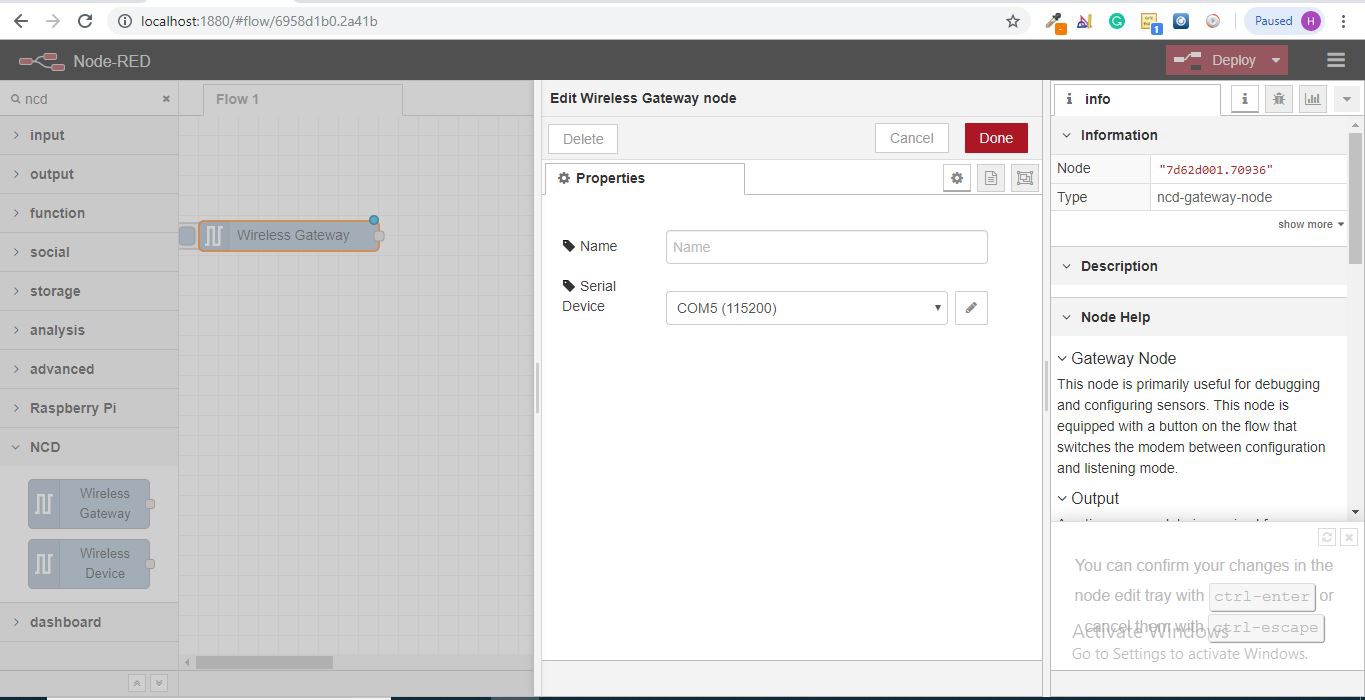
Step 4: Click on the magnifying glass next to the Serial Port field and select the port that corresponds with your router, then click the “Add” button on top.
Step 5: The Serial Device field will now be populated based on that selection, and you can click “Done”, you now have direct access to your wireless sensors! To view the data coming in.
Step 6: Now Go Back to Your Palette and Type “debug” Into the Search Field at the Top, Grab One of These Nodes and Drag It to the Right of Your Wireless Gateway.
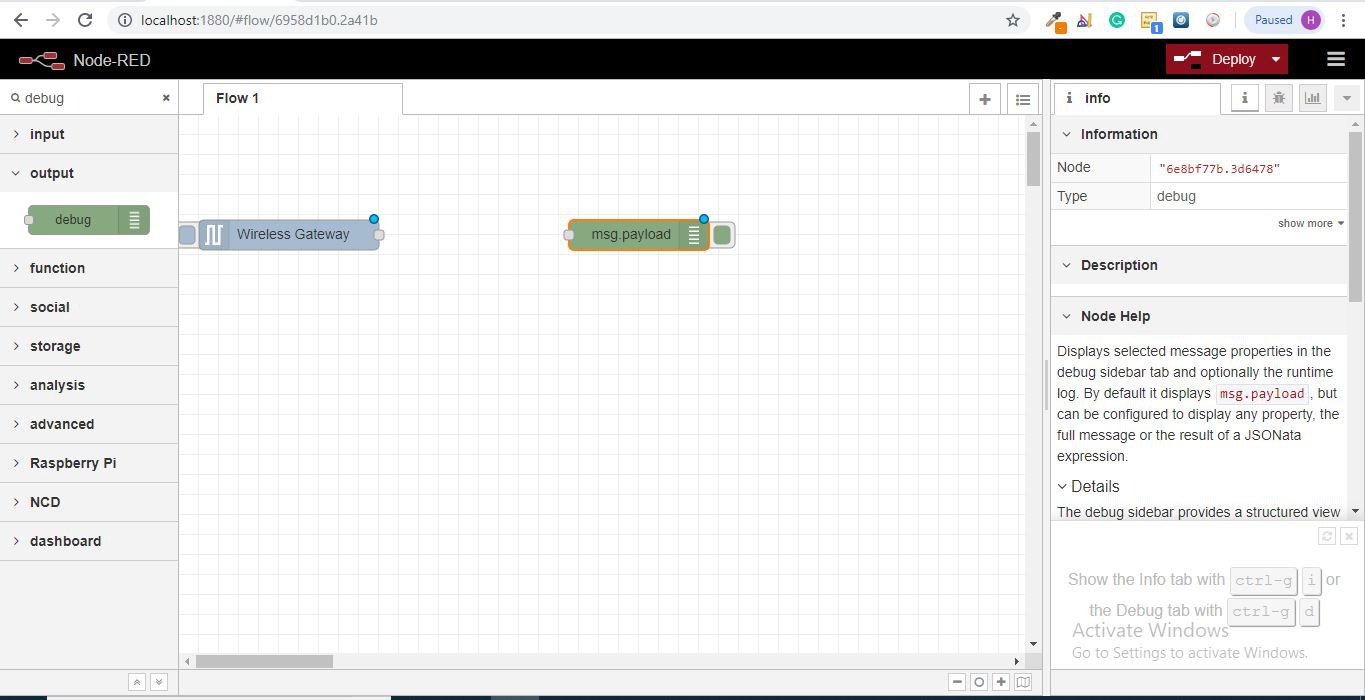
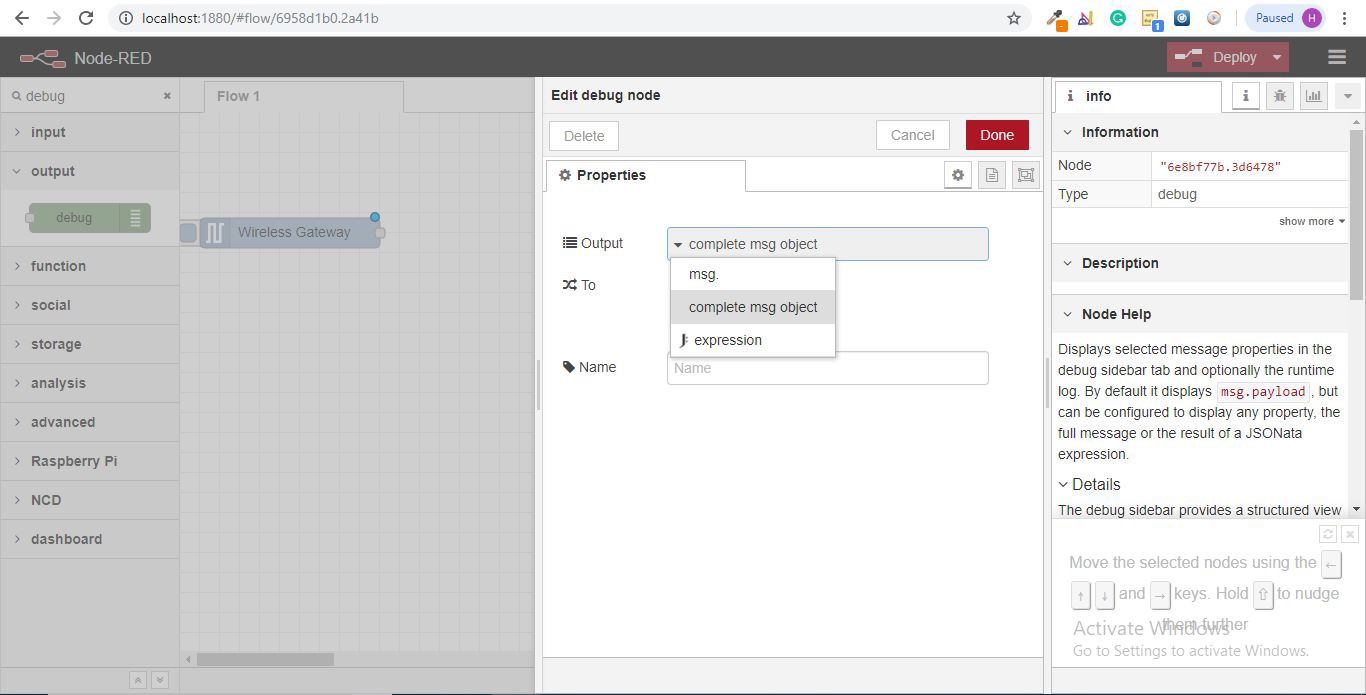
Step 7: Double Click on It and Change “msg.” to “complete Msg Object” Click Done.
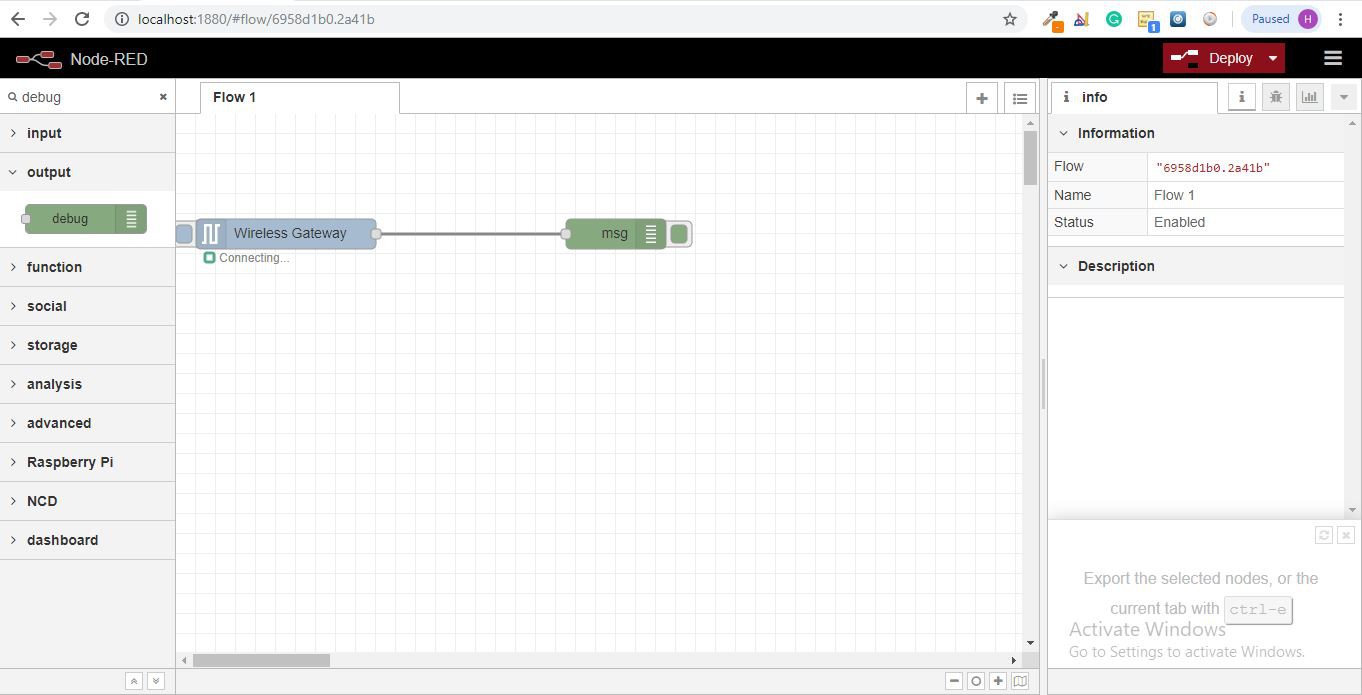
Step 8: Now draw a line between the two nodes, and click “Deploy” on the top right of the window..
Step 9: Working with the data
Now out of your wireless sensors data is gathered and it is output to the “debug” tab, this “debug tab” is placed within the right sidebar subsequent to the information tab. To see the information is available to hit the reset button. In node-red records is surpassed among nodes in a json packet. When the msg object comes into the debug tab you may make bigger it to view the overall list of information that comes with it. This is extraordinarily useful in case you need to quickly see which sensors are checking in. The other issue this node gives is an easy way to interchange your router to the network identity that devices in configuration mode document on, simply hit the button on the left of the node and the tool will switch to the configuration network, hit it once more to return it to listening mode. Once we get the wi-fi tool nodes set up, they may be set to routinely configure a sensor whilst it enters configuration mode, so it’s always available to maintain such gateway nodes present at the flow for speedy configuring a device.
Step 10: Adding the wireless sensors
we need to separate wireless sensor records domestically in order that we are able to display it, we could use a switch node to split out the messages from the gateway based totally on the mac address with or sensor type, but as I referred to, the wireless nodes truly incorporate extra functionality for configuring the sensors, so we’ll start with them to give you an extra entire image of how those structures can work. In case you haven’t already seen packets coming in from both of your sensors, cross in advance and hit the reset button on the only that hasn’t started. While a sensor assessment in through any serial device configuration node, the mac address and kind of sensor is cached in a pool so we are able to quickly find it for the duration of this next step.
- Grab a Wireless Node from the palette and drag it onto the flow, double click on it to get it configured.
![]()
Step 11: select the serial device from the drop-down that you used for the Wireless Gateway, now click the magnifying glass next to “Mac Address” and select one of the available options.
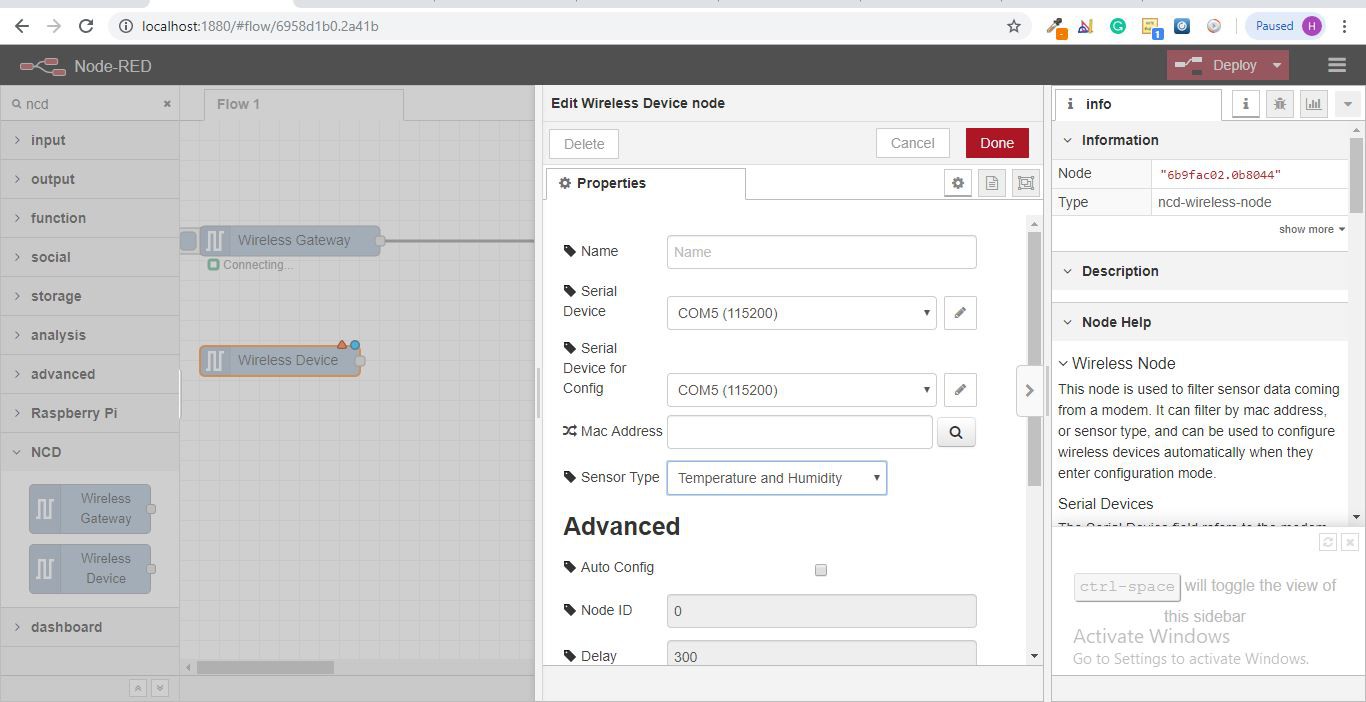
You’ll notice this automatically sets the sensor type for you, you can also give it a name to make it easier to identify. As noted in the info tab, the Serial Device for Config field is optional, and we won’t worry about it right now. The node you have just added effectively works as a filter on incoming sensor data, only passing through data for the mac address, or sensor type if no mac address is present.
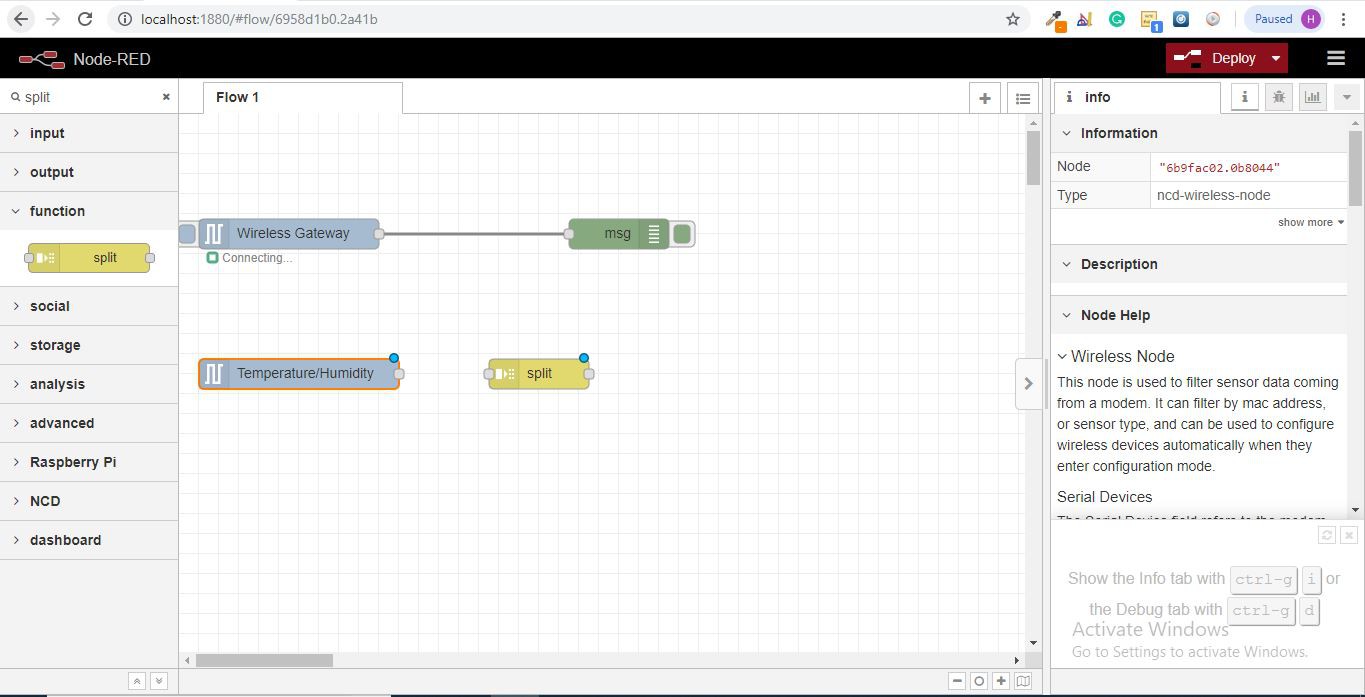
Step 12: Displaying Up the Temperature/Humidity:
These nodes for the wireless sensors output a msg object with all of the same information as the Wireless Gateway node, just in a slightly different format, the Sensor Data itself is sent in the msg.payload, which is what most nodes use to interact with the msg itself.
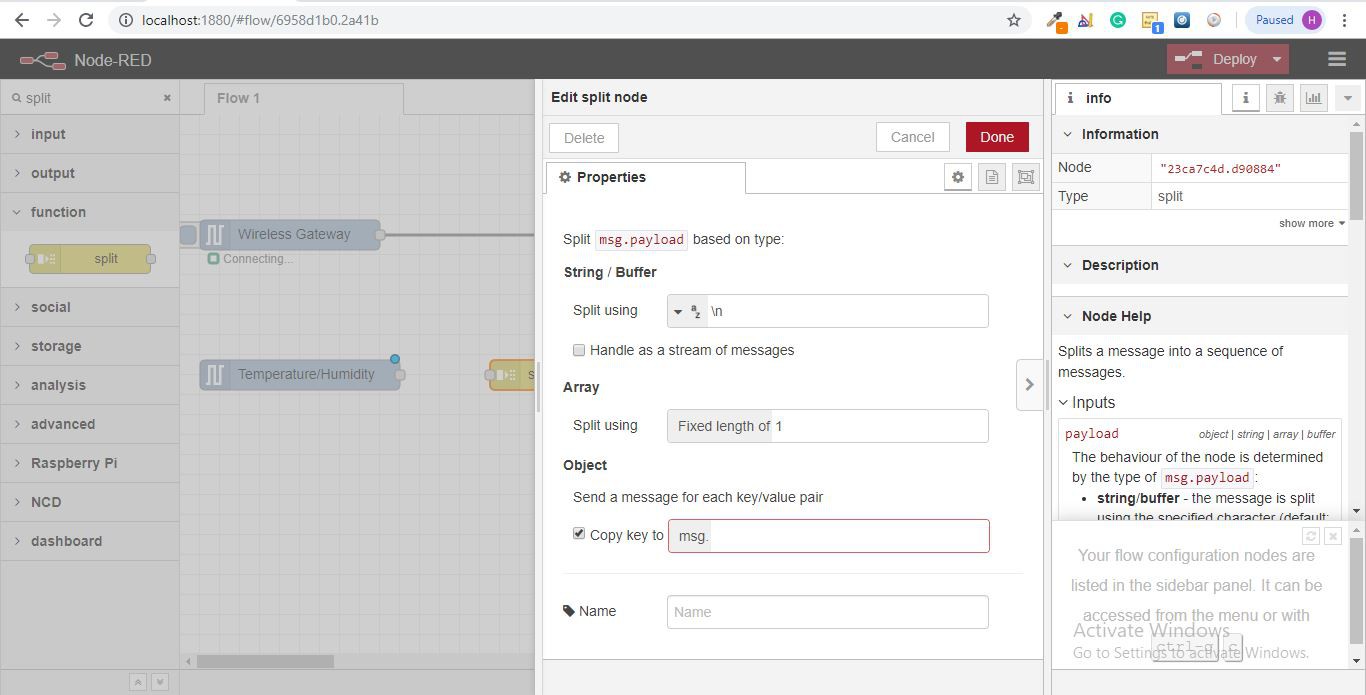
- Grab a “split” node from the palette, and place it to the right of the Temp/Hum node.
![]()
Step 13: double click and check the box under Object that says “Copy key to”, this will split the msg into multiple objects, one for each property in the payload, and set the topics for those new msgs to the property names.
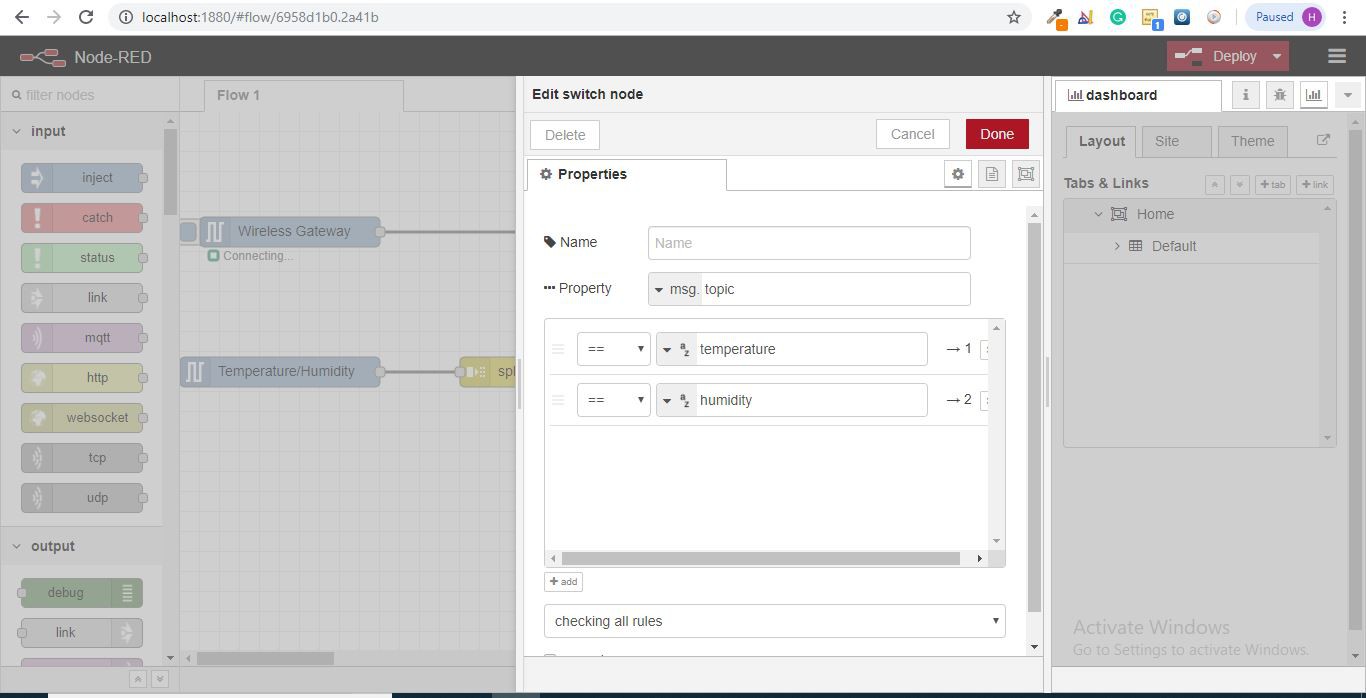
Step 14: Now Add a “switch” Node, This Will Allow Us to Send Each Msg to a Specific Part of the Flow, One to Handle Temperature, and One Humidity. in the First Field Change “payload” to “topic”, Next to the “==”, Type “temperature”.
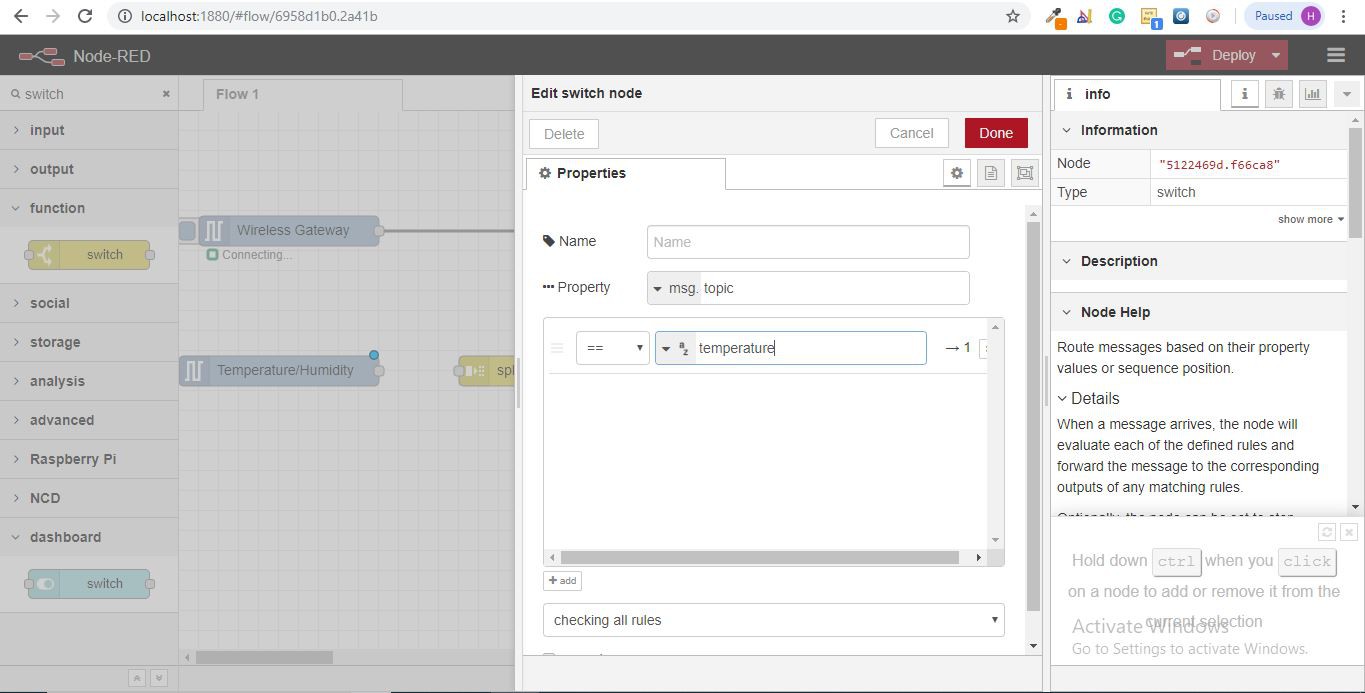
Step 15: Then click the “+add” button at the bottom left, in the new field type “humidity”. As you can see each of these has a unique number to the right, this number indicates which output the msg will be sent to when it matches the condition.
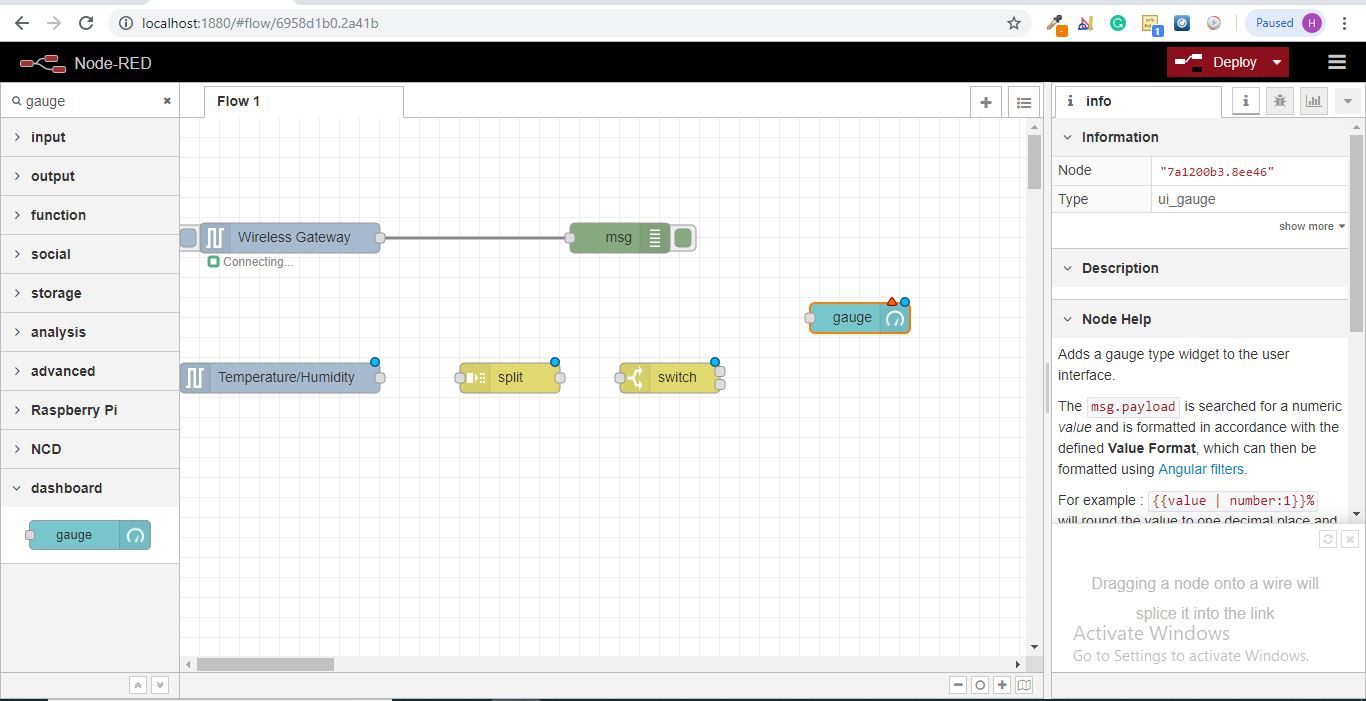
Step 16: Next let’s add a “gauge” from the palette.
Step 17: set the Label to “Temperature”, and the Value format to “{{value | number:2}}”, and the Units to “Celsius” you can alter the range to the minimum and maximum expected temperature, I’m using 0 and 50.
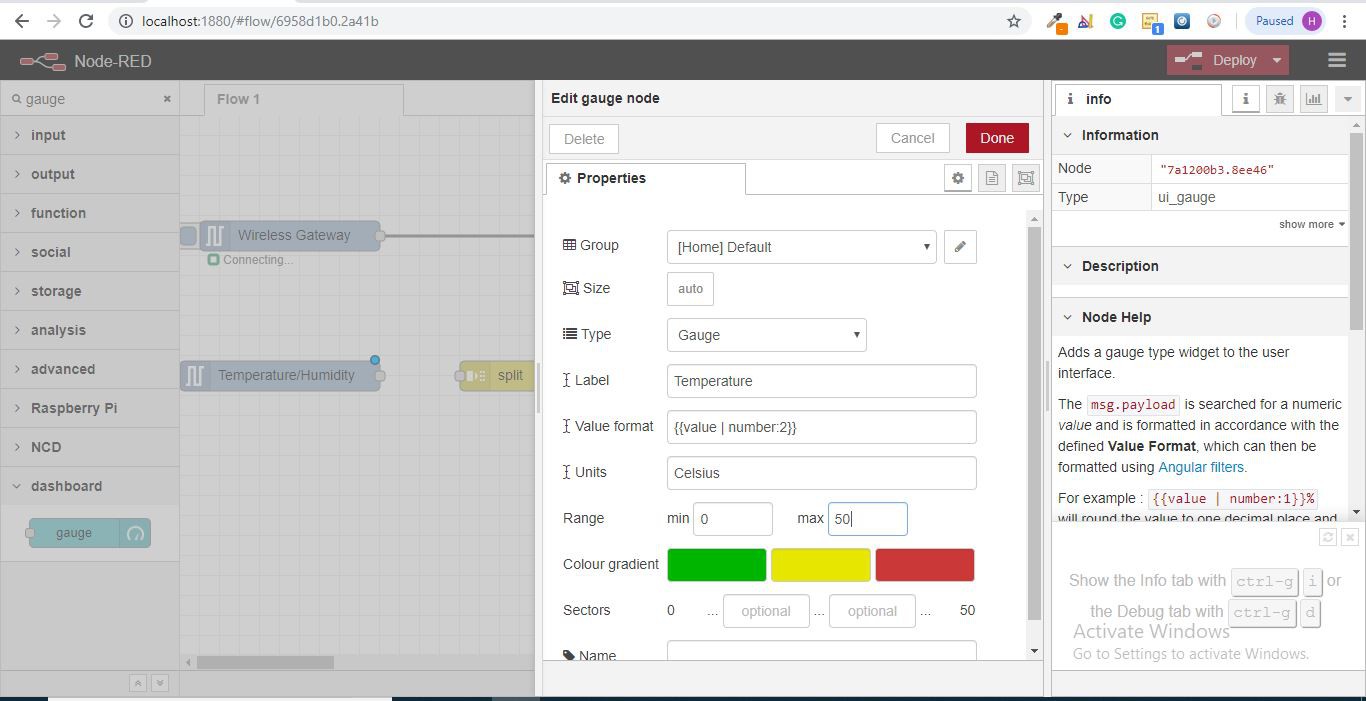
- Another really cool feature of the flow builder is copy+paste, click on the gauge you just added and click ctrl+c (cmd+c on mac), then cntl+v, now you have a second gauge, double click on it to change the Label to Humidity, the Units to RH, and the range to 20 and 80.
Step 18: Now draw wires from the Temperature/Humidity node to the split node, from the split node to the switch node, and from the switch node’s first (top) output to the temperature gauge node, and from the switch node’s second output to the humidity gauge.
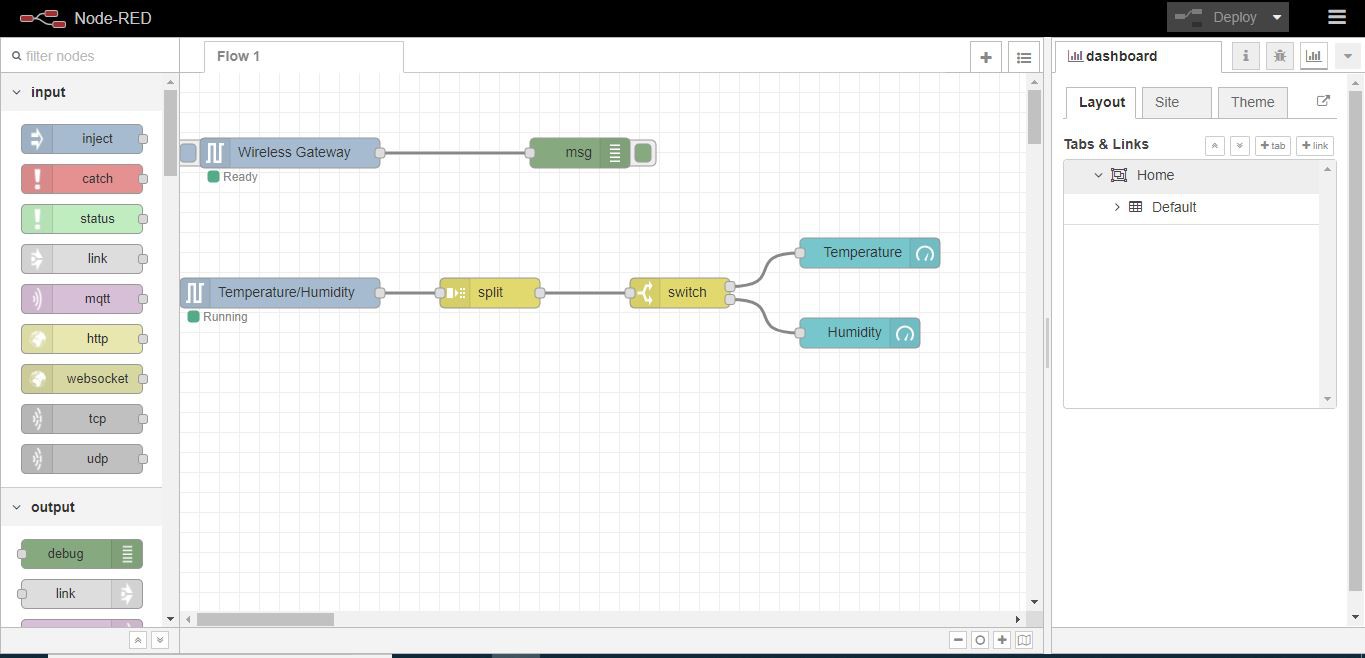
- Once that’s done click deploy.
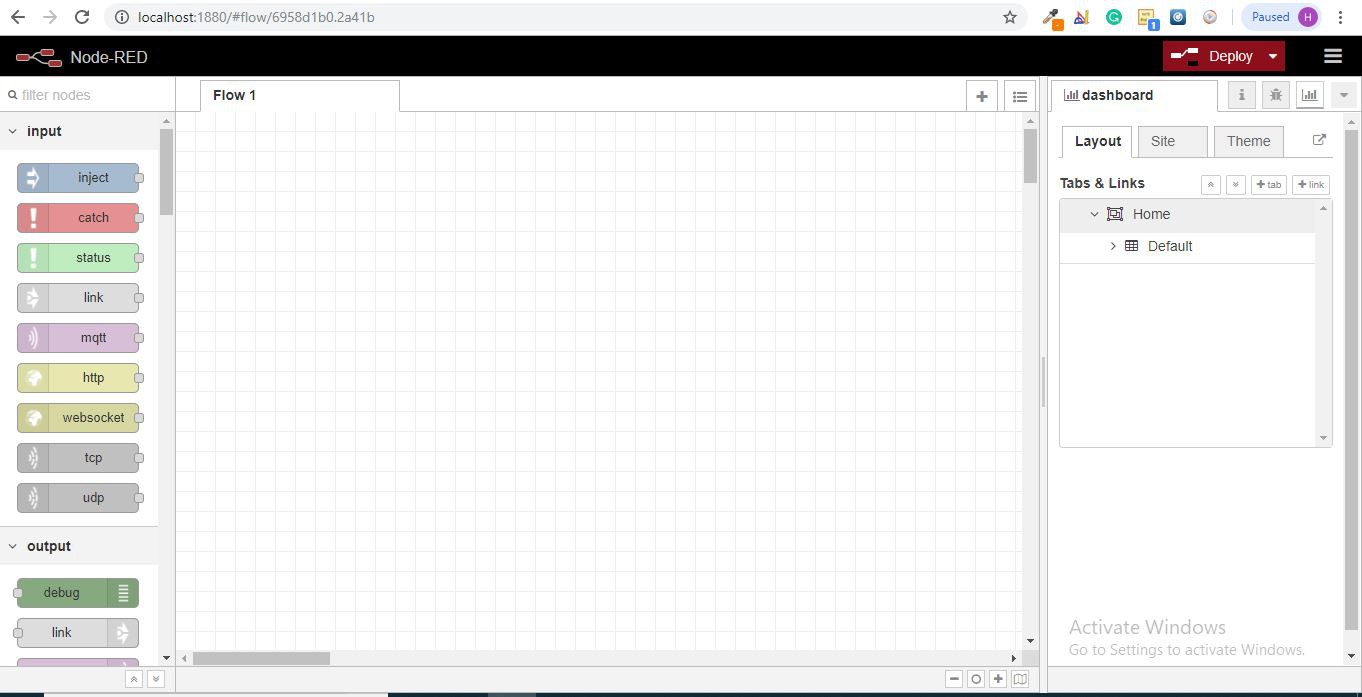
Step 19: NODE-RED DASHBOARD:
Provides the ability to create a UI using the flow builder, provides charts, graphs, and a number of other visual elements we can use to display data, along with nodes to trigger a flow using user input. We will use some of these nodes to display the telemetry from your wireless sensors.
- let’s check it out! There is a tab on the top right that says “Dashboard”.
![]()
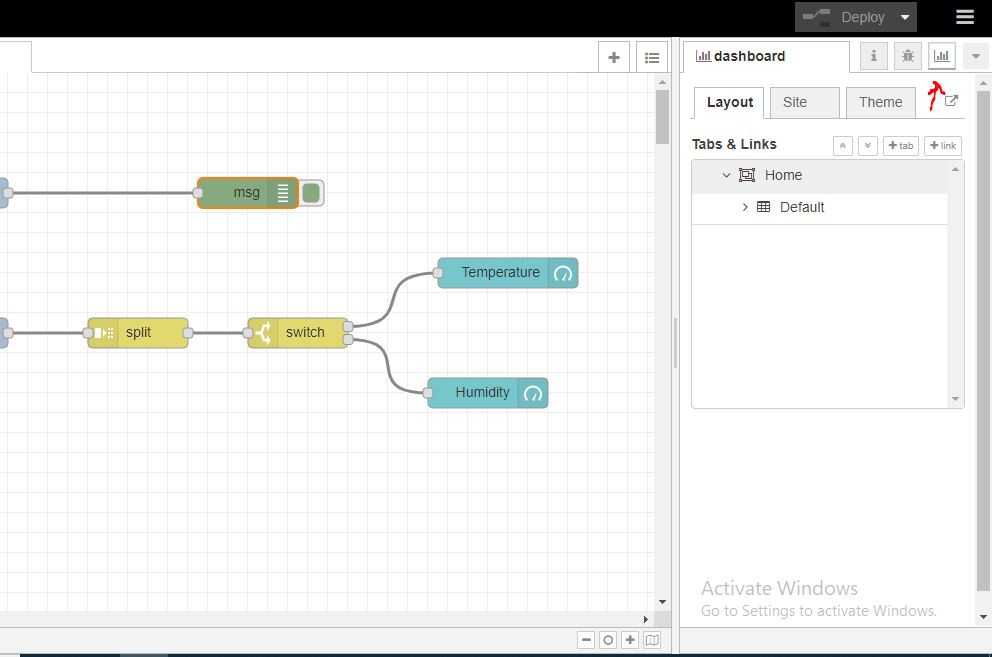
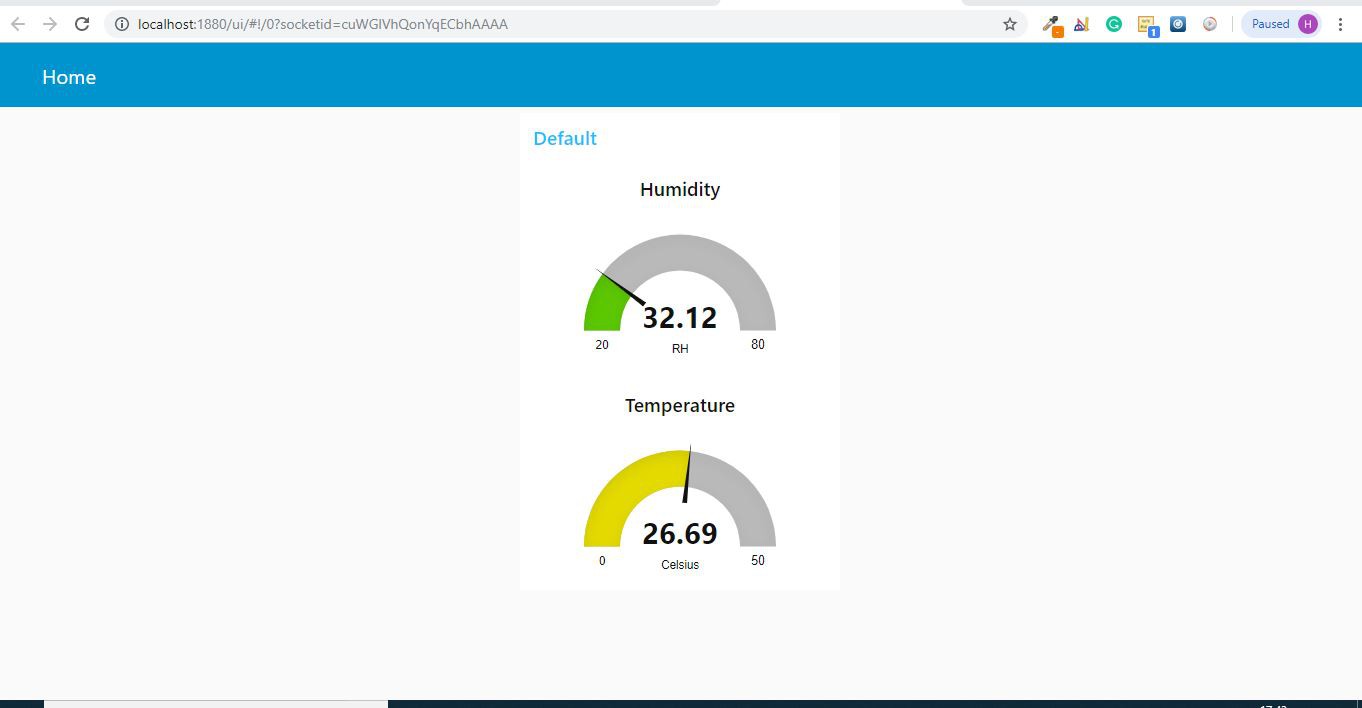
Step 20: on the top right of that tab is the little “new window” icon, click on it to view your UI.
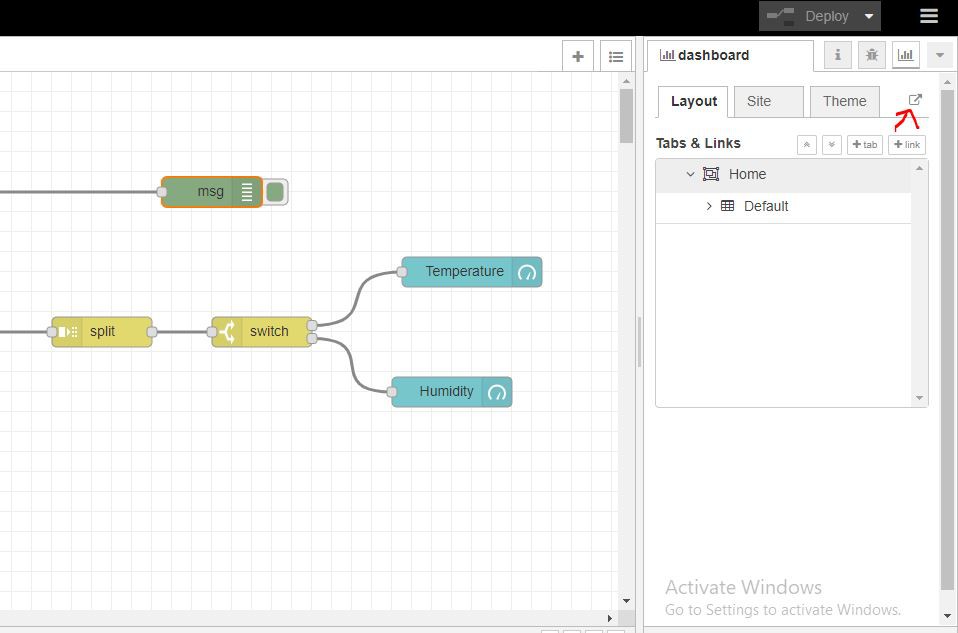
It is likely that the gauges aren’t displaying any information, because no sensor data has been reported since you deployed the flow, click the reset button on your temperature/humidity sensor to force it to check in and your gauges should jump up. You should now have real-time data displaying!
Step 21: NODE-RED DASHBOARD OUTPUT:
Now as the temperature and humidity increases and decreases new data available inside the various variable.
Node_red_flow
Below is an export of the complete dashboard setup I built for these wireless sensors.
[{"id":"6958d1b0.2a41b","type":"tab","label":"Flow 1","disabled":false,"info":""},{"id":"7d62d001.70936","type":"ncd-gateway-node","z":"6958d1b0.2a41b","name":"","connection":"b84f8e8b.da2bc","x":110,"y":120,"wires":[["6e8bf77b.3d6478"]]},{"id":"6e8bf77b.3d6478","type":"debug","z":"6958d1b0.2a41b","name":"","active":true,"tosidebar":true,"console":false,"tostatus":false,"complete":"true","targetType":"full","x":440,"y":120,"wires":[]},{"id":"6b9fac02.0b8044","type":"ncd-wireless-node","z":"6958d1b0.2a41b","name":"","connection":"aa316563.451c88","config_comm":"e9aac20f.1ba27","addr":"","sensor_type":"1","auto_config":"","node_id":0,"delay":300,"destination":"0000FFFF","power":4,"retries":10,"pan_id":"7FFF","change_enabled":"","change_pr":"0","change_interval":"0","cm_calibration":"60.6","bp_altitude":"0","bp_pressure":"0","bp_temp_prec":"0","bp_press_prec":"0","amgt_accel":"0","amgt_mag":"0","amgt_gyro":"0","impact_accel":"0","impact_data_rate":"4","impact_threshold":25,"impact_duration":1,"activ_interr_x":1,"activ_interr_y":2,"activ_interr_z":4,"activ_interr_op":8,"filtering":0,"data_rate":5,"time_series":0,"reading_type":1,"x":100,"y":260,"wires":[["23ca7c4d.d90884"]]},{"id":"23ca7c4d.d90884","type":"split","z":"6958d1b0.2a41b","name":"","splt":"\\n","spltType":"str","arraySplt":1,"arraySpltType":"len","stream":false,"addname":"topic","x":330,"y":260,"wires":[["5122469d.f66ca8"]]},{"id":"5122469d.f66ca8","type":"switch","z":"6958d1b0.2a41b","name":"","property":"topic","propertyType":"msg","rules":[{"t":"eq","v":"temperature","vt":"str"},{"t":"eq","v":"humidity","vt":"str"}],"checkall":"true","repair":false,"outputs":2,"x":490,"y":260,"wires":[["7a1200b3.8ee46"],["258cd10b.ba2c9e"]]},{"id":"7a1200b3.8ee46","type":"ui_gauge","z":"6958d1b0.2a41b","name":"","group":"63c58175.4b078","order":0,"width":0,"height":0,"gtype":"gage","title":"Temperature","label":"Celsius","format":"{{value | number:2}}","min":0,"max":"50","colors":["#00b500","#e6e600","#ca3838"],"seg1":"","seg2":"","x":700,"y":200,"wires":[]},{"id":"258cd10b.ba2c9e","type":"ui_gauge","z":"6958d1b0.2a41b","name":"","group":"63c58175.4b078","order":0,"width":0,"height":0,"gtype":"gage","title":"Humidity","label":"RH","format":"{{value | number:2}}","min":"20","max":"80","colors":["#00b500","#e6e600","#ca3838"],"seg1":"","seg2":"","x":680,"y":320,"wires":[]},{"id":"b84f8e8b.da2bc","type":"ncd-gateway-config","z":"","name":"","comm_type":"serial","ip_address":"","tcp_port":"2101","port":"COM5","baudRate":"115200","pan_id":"7fff","rssi":false},{"id":"aa316563.451c88","type":"ncd-gateway-config","z":"","name":"","comm_type":"serial","ip_address":"","tcp_port":"2101","port":"COM5","baudRate":"115200","pan_id":"7fff","rssi":false},{"id":"e9aac20f.1ba27","type":"ncd-gateway-config","z":"","name":"","comm_type":"serial","ip_address":"","tcp_port":"2101","port":"COM5","baudRate":"115200","pan_id":"7fff","rssi":false},{"id":"63c58175.4b078","type":"ui_group","z":"","name":"Default","tab":"4c6dd3b0.cf3b6c","disp":true,"width":"6","collapse":false},{"id":"4c6dd3b0.cf3b6c","type":"ui_tab","z":"","name":"Home","icon":"dashboard","disabled":false,"hidden":false}]