 aloismbutura
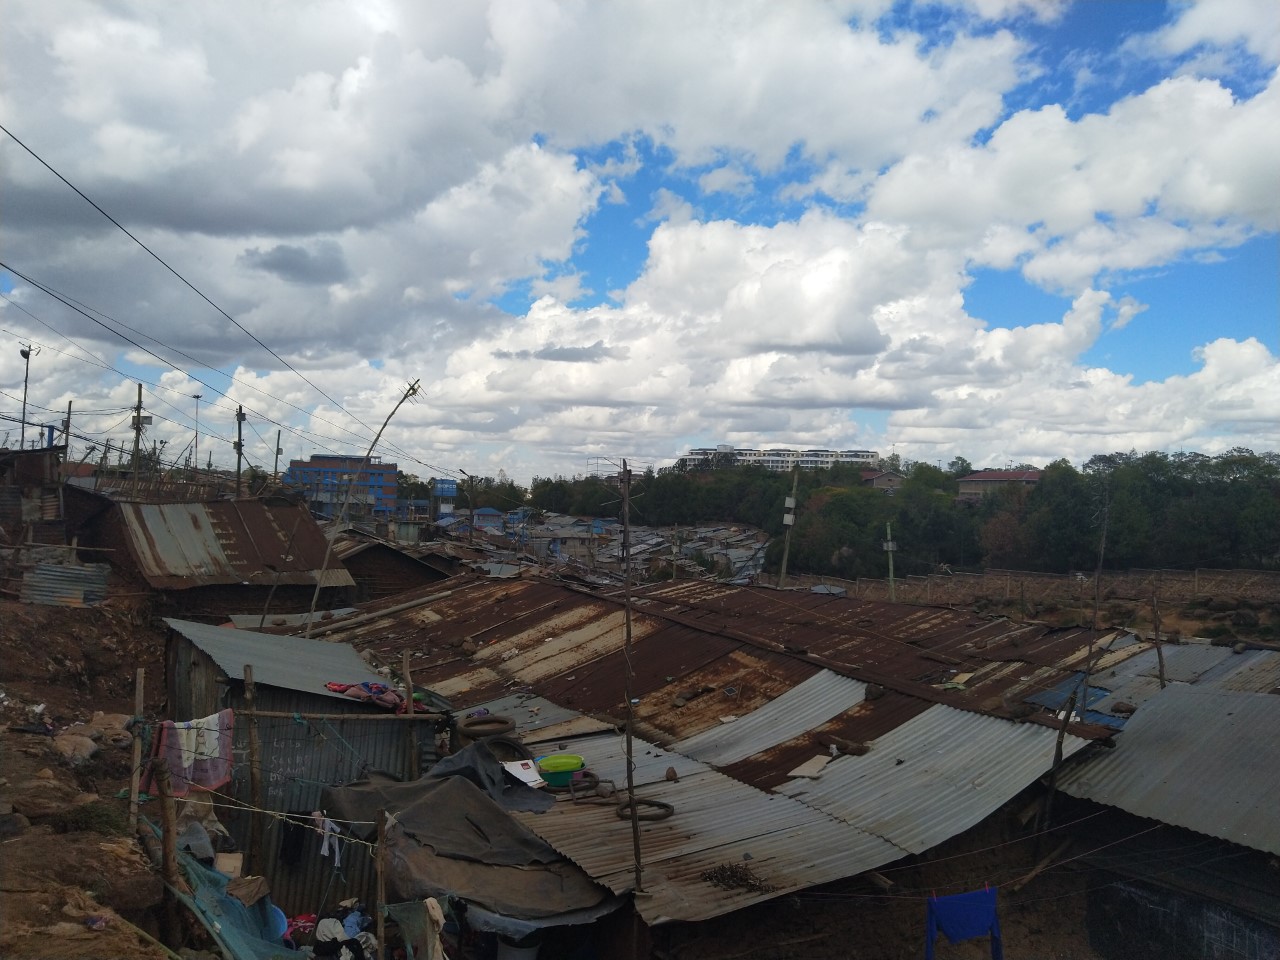

A second test was carried out within an urban single-unit household in Kibera informal settlement. Actual names have been altered in order to keep identities private. We thank them for offering us the opportunity and permission to collect and analyse their data and make it public for the sake of public awareness. Asante!
Meet the family :)
John Doe* has lived within Kibera for the past 16 years, he met his wife Jane Doe* within Kibera. They are married with 2 children: A girl aged 15 years in a local day high school and a 6 month bundle of Joy. They live in a single room made of aged iron sheets roughly measuring 2 meters(~12 feet) by 3 meters(~36 feet) that they share with their 2 children. They also cook within this single room. Amenities such as bathroom are shared. There is electricity but illegal connections causing fires in the neighborhood have made them afraid of connecting their home to the grid! They thus use candle for lighting. The household energy mix includes charcoal briquettes and kerosene. Kerosene is mainly used during the day while briquettes are used in the evening.
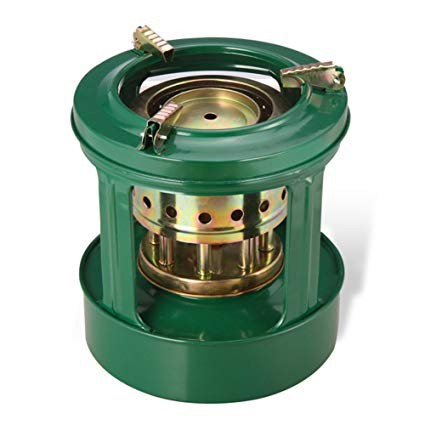
A sample kerosene stove
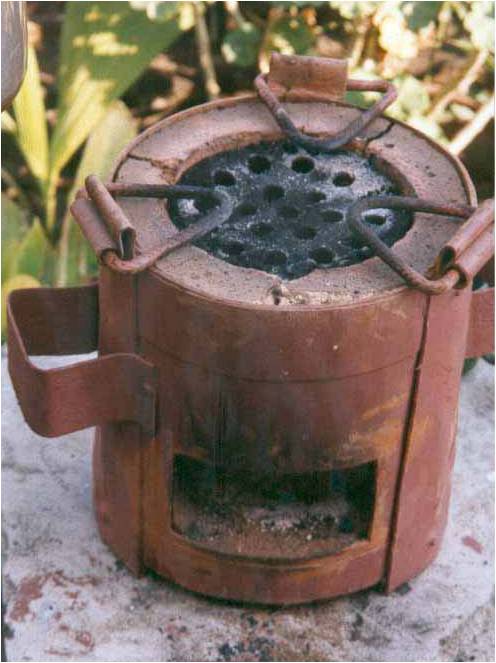 A sample briquette stove
Data analysis
Data was captured in a CSV file as below using an OpenHAP unit and analysed.
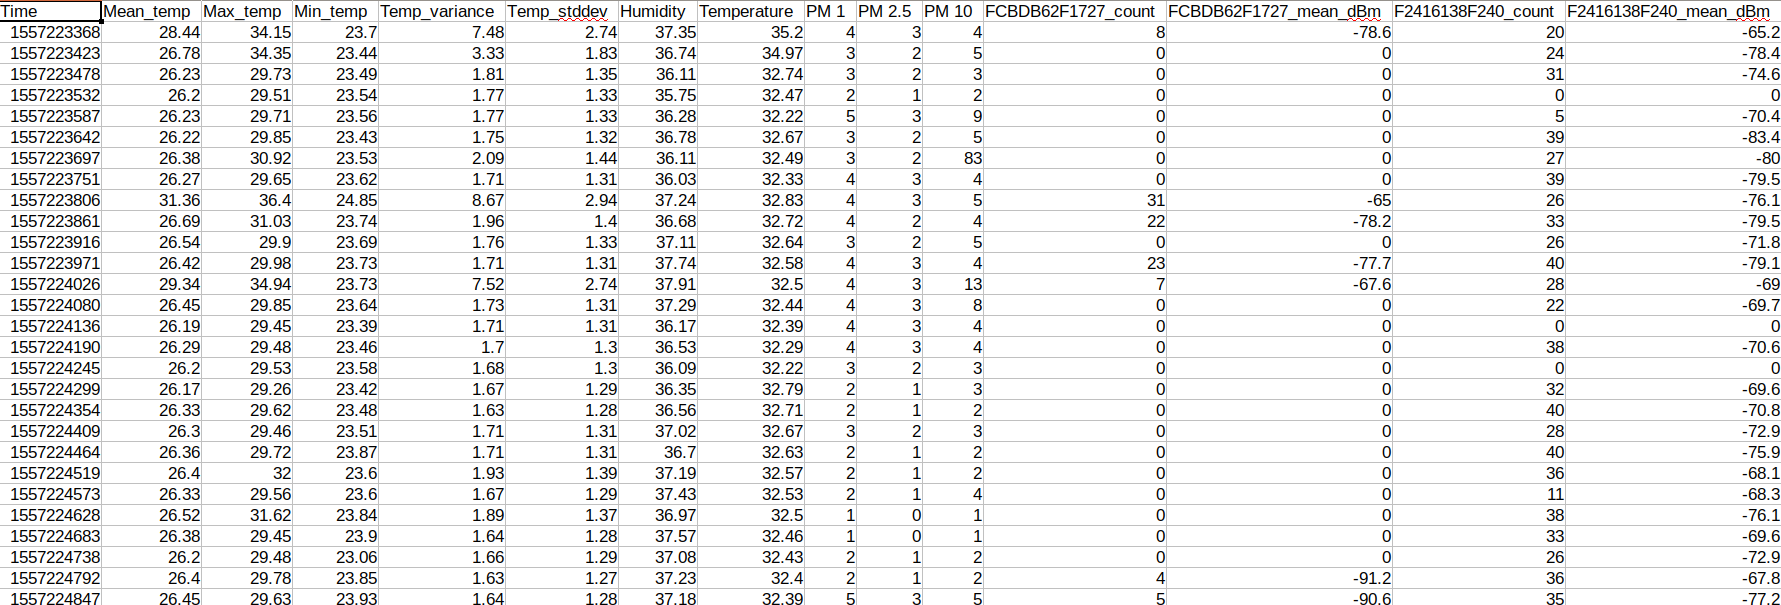
The above image shows raw data collected.
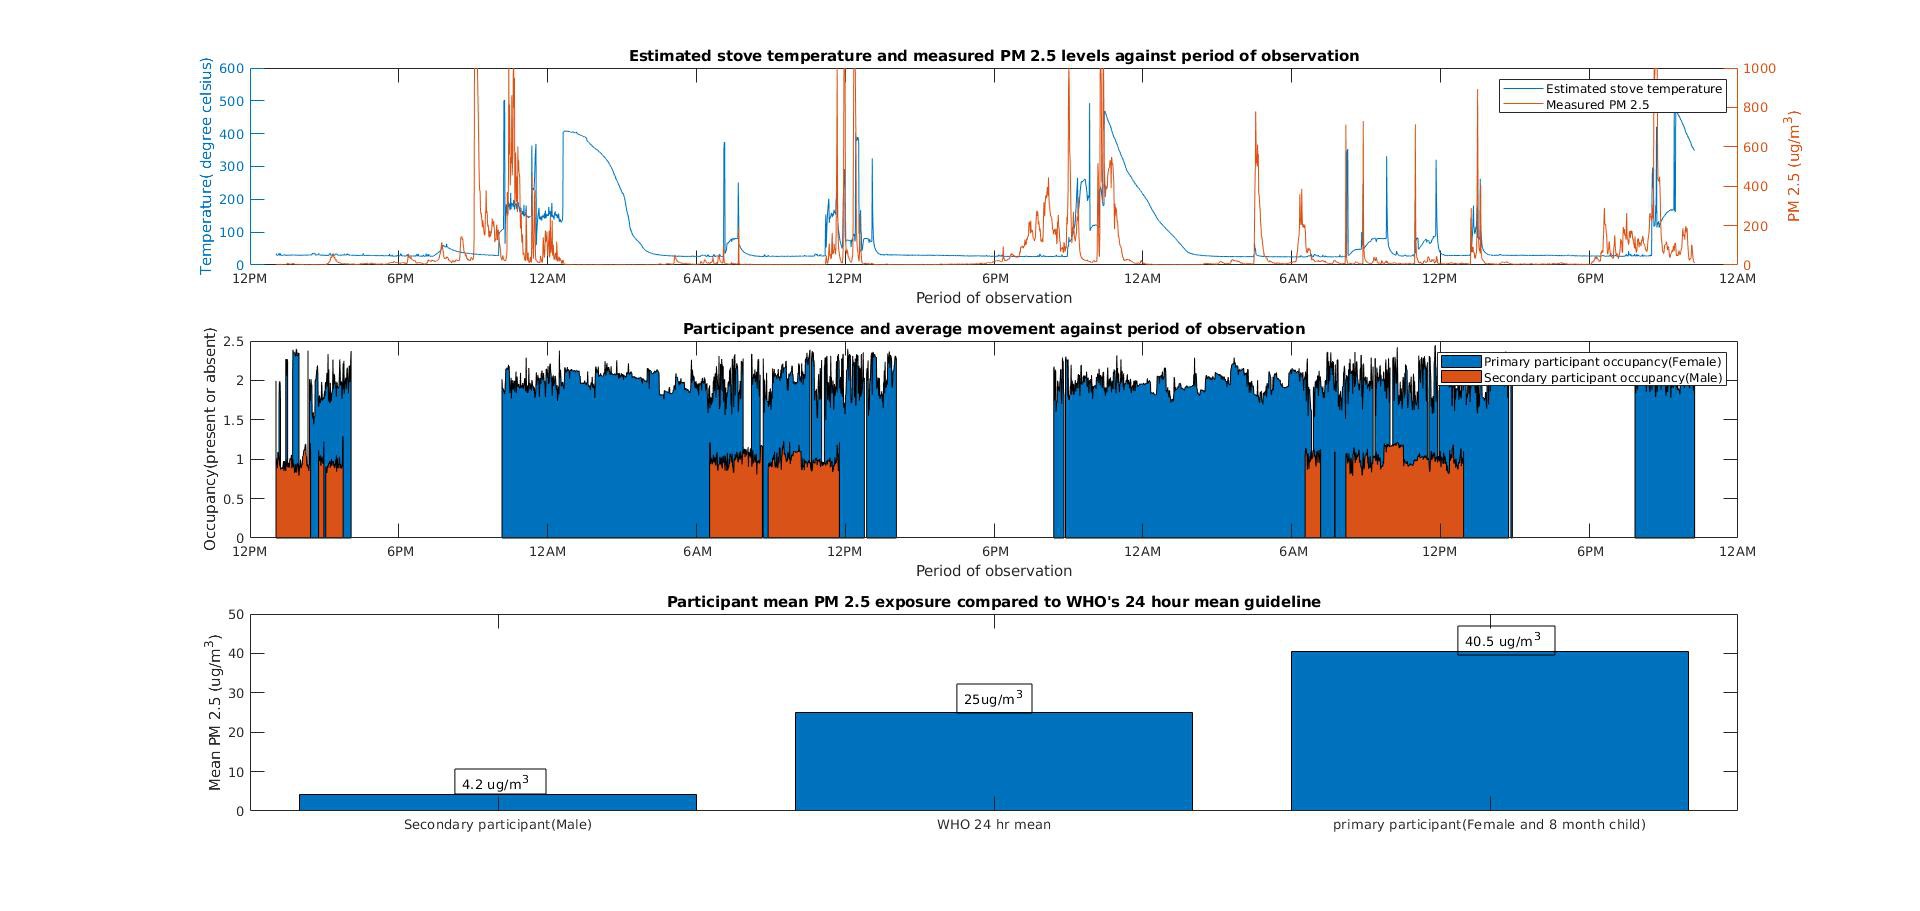
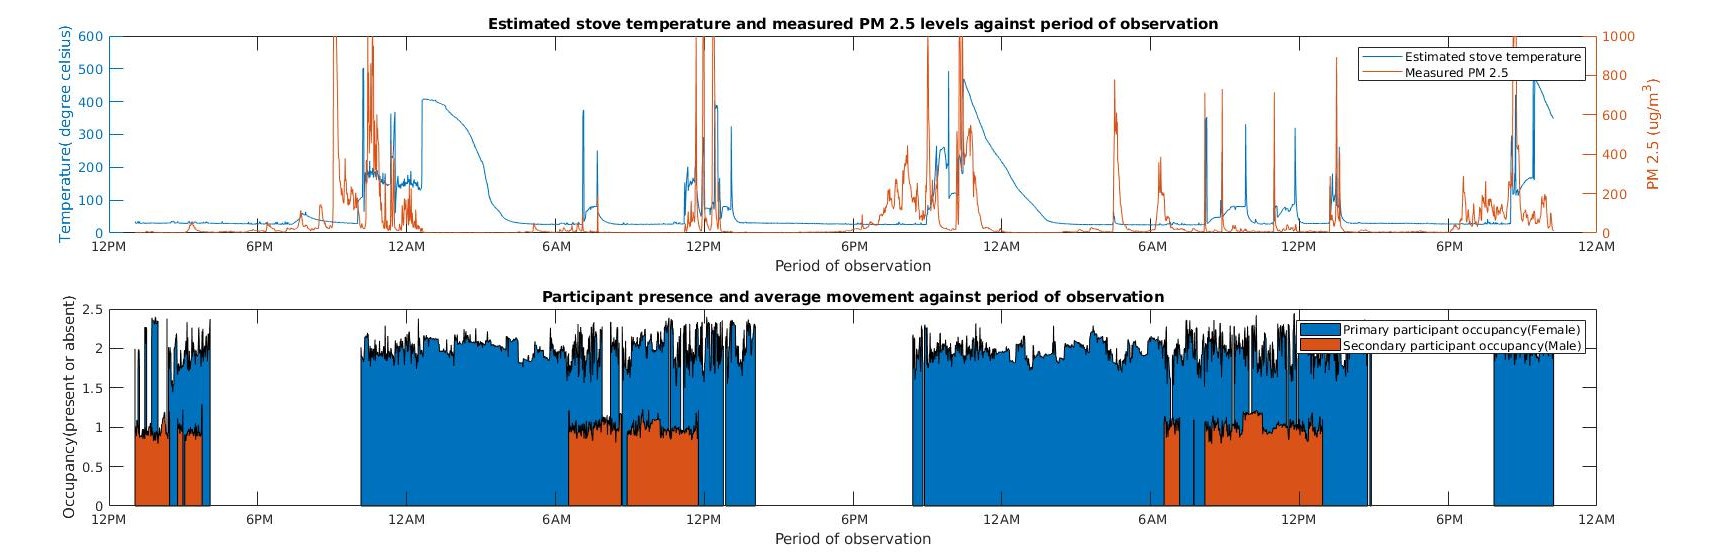
Plotting MLX90640 max temperatures, PM2.5 values against time
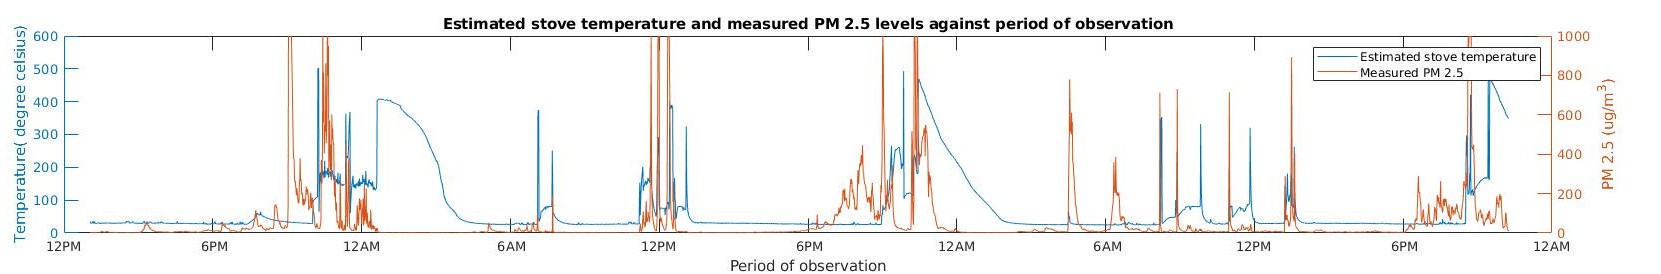
Tp obtain the plots above of stove temperature and PM2.5 against time, the unix time recorded in column 1 is converted into ISO 8601 format, the day , hour, minute, second is extracted and plotted on a continuous line. The corresponding values of PM2.5 and Max temperature(Obtained by pre-processing the MLX90640 pixel data before saving to the CSV file on the SD card) are plotted against this.
Overlaying activity information on presence information
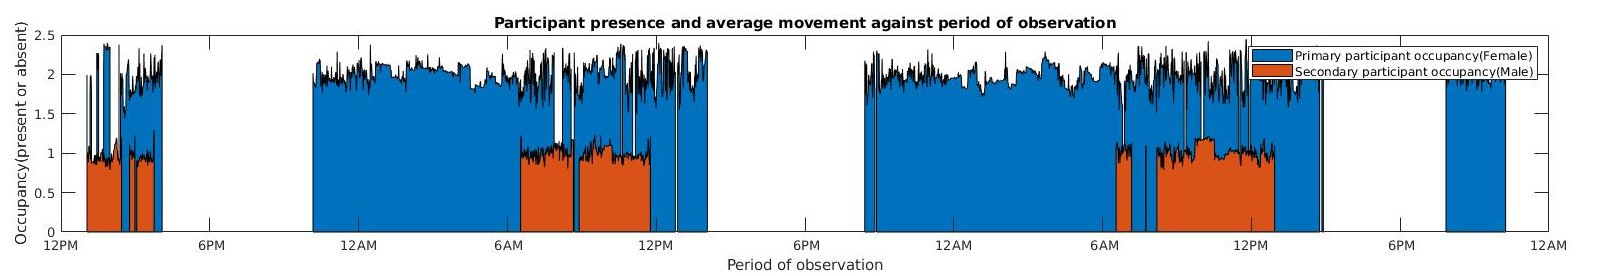
We obtain
The above plots are a superposition of two datasets:
- Presence information - Derived from "<BLE_MAC>_count" column in the CSV file. This column stores the total number of messages received in that specific data acquisition cycle from a wristband identified by its MAC address. A zero value represents absence while anything greater than zero shows presence.
- Activity information - Inferred from "<BLE_MAC>_mean_dBm" column in the CSV file. This column stores the average signal strength of the total number of messages(RSSI monitoring) received in that specific data acquisition cycle. This is because a wristband typically sends messages every 1-3 seconds whereas a typical data acquisition cycle lasts 20-40 seconds depending on settings.
The Y axis can take a universe of two values with regard to presence/absence:
- Y value > 0 -> present - In order not to have the same single level for various monitored persons, we settle for unique integer values per person with regard to presence. In the graph above:
- Value 2 represents primary participant presence.
- Value 1 represents secondary participant presence.
- Y value = 0 -> Absent
As we can only measure the activity when the participant is present, we superpose activity information on the presence information. To do this we scale the dBm information and overlay in on the presence plots above.
The more variation there is, the more active the person. This can be used to infer when one may be asleep or awake.
Analysing presence/activity information
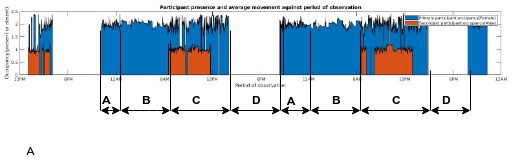
The primary participant here represents an actual mother with a six month old child. She takes care of her child as is with it 24 hours a day. A typical day is split as follows from the data - You do not even need to know the household culture to see what the data is telling you:
- A - She comes home at around 10 pm daily.
- B - She sleeps at around midnight and wakes up at around 6am before the secondary participant - her husband comes from work- We later got to find out after data collection and analysis that he works as a security guard in an upmarket estate in the capital.
- C - While she is awake, the secondary participant - her husband does some activities around the house before sleeping for around 1.5 hours and waking up again to leave at around midday.
- D - She leaves the house from around 2pm till around 10 pm - We later got to find out after data collection and analysis that she runs a grocery shop that she tends to over this period.
- Cycle continues.
Analyzing presence/activity information with pollution information
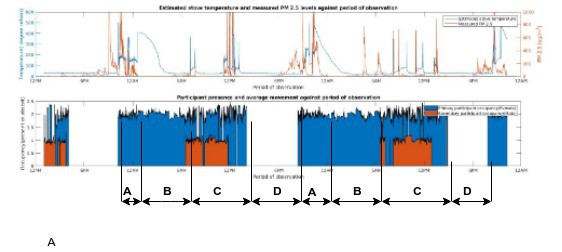
- Before A - The pollution levels are moderately high The stove is out of thermal camera view. This was actually a data gap but after enquiring on this we are told the daughter lights up the stove and warms it before the mother(Primary participant) gets home. The reason for this is because the briquette stove takes some time to get lit.
- A - She comes home at around 10 pm daily. The pollution levels peak. -After analysis, we were told that she cooks with the briquette stove as soon as she is home.
- B - She sleeps at around midnight, the temperature peaks because the stove is in view of the thermal camera. The husband comes in at around 6pm, the heat from the stove has long subsided around two hours prior- We were later told that she uses the residual heat to warm the room. This presents a danger of carbon monoxide poisoning without their knowledge, putting her life and her children at risk. The husband is not present at the moment.
- C - She now uses the kerosene stove to quickly cook breakfast, represented by the short temperature spike. Particulates are minimal! She then cooks again at around noon, sharp temperature and pollutant spikes are noted. - From information, this is still from the kerosene stove.
- Cycle continues.
Calculating pollutant exposure
The indoor pollutant exposure is calculated by getting the mean of the pollutant levels. This is calculated as below:
- When a participant is present, the pollution exposure is equal to the measured value by an OpenHAP unit.
- When a participant is absent, the pollution exposure is assumed zero! We take it this way as our scope does not extend beyond the kitchen wall perimeter.
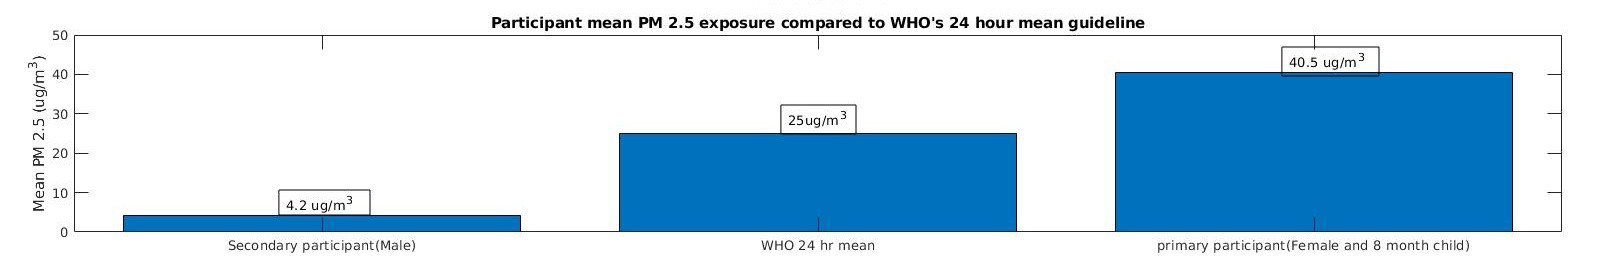
As can be seen, the husband is negligibly exposed, with his values being 5 times below the WHO limits. The wife and the 6 month child receive majority of the exposure and are around 1.5 times the recommended limit. In addition, this does not consider the carbon monoxide poisoning leading to slow suffocation! We did enquire about this but they did not know the effects of CO poisoning given they have not had the priviledge of education and I would not blame them but it is important that they now know the effects and have changed to cooking in open spaces outside!
Discussions
Become a Hackaday.io Member
Create an account to leave a comment. Already have an account? Log In.