-
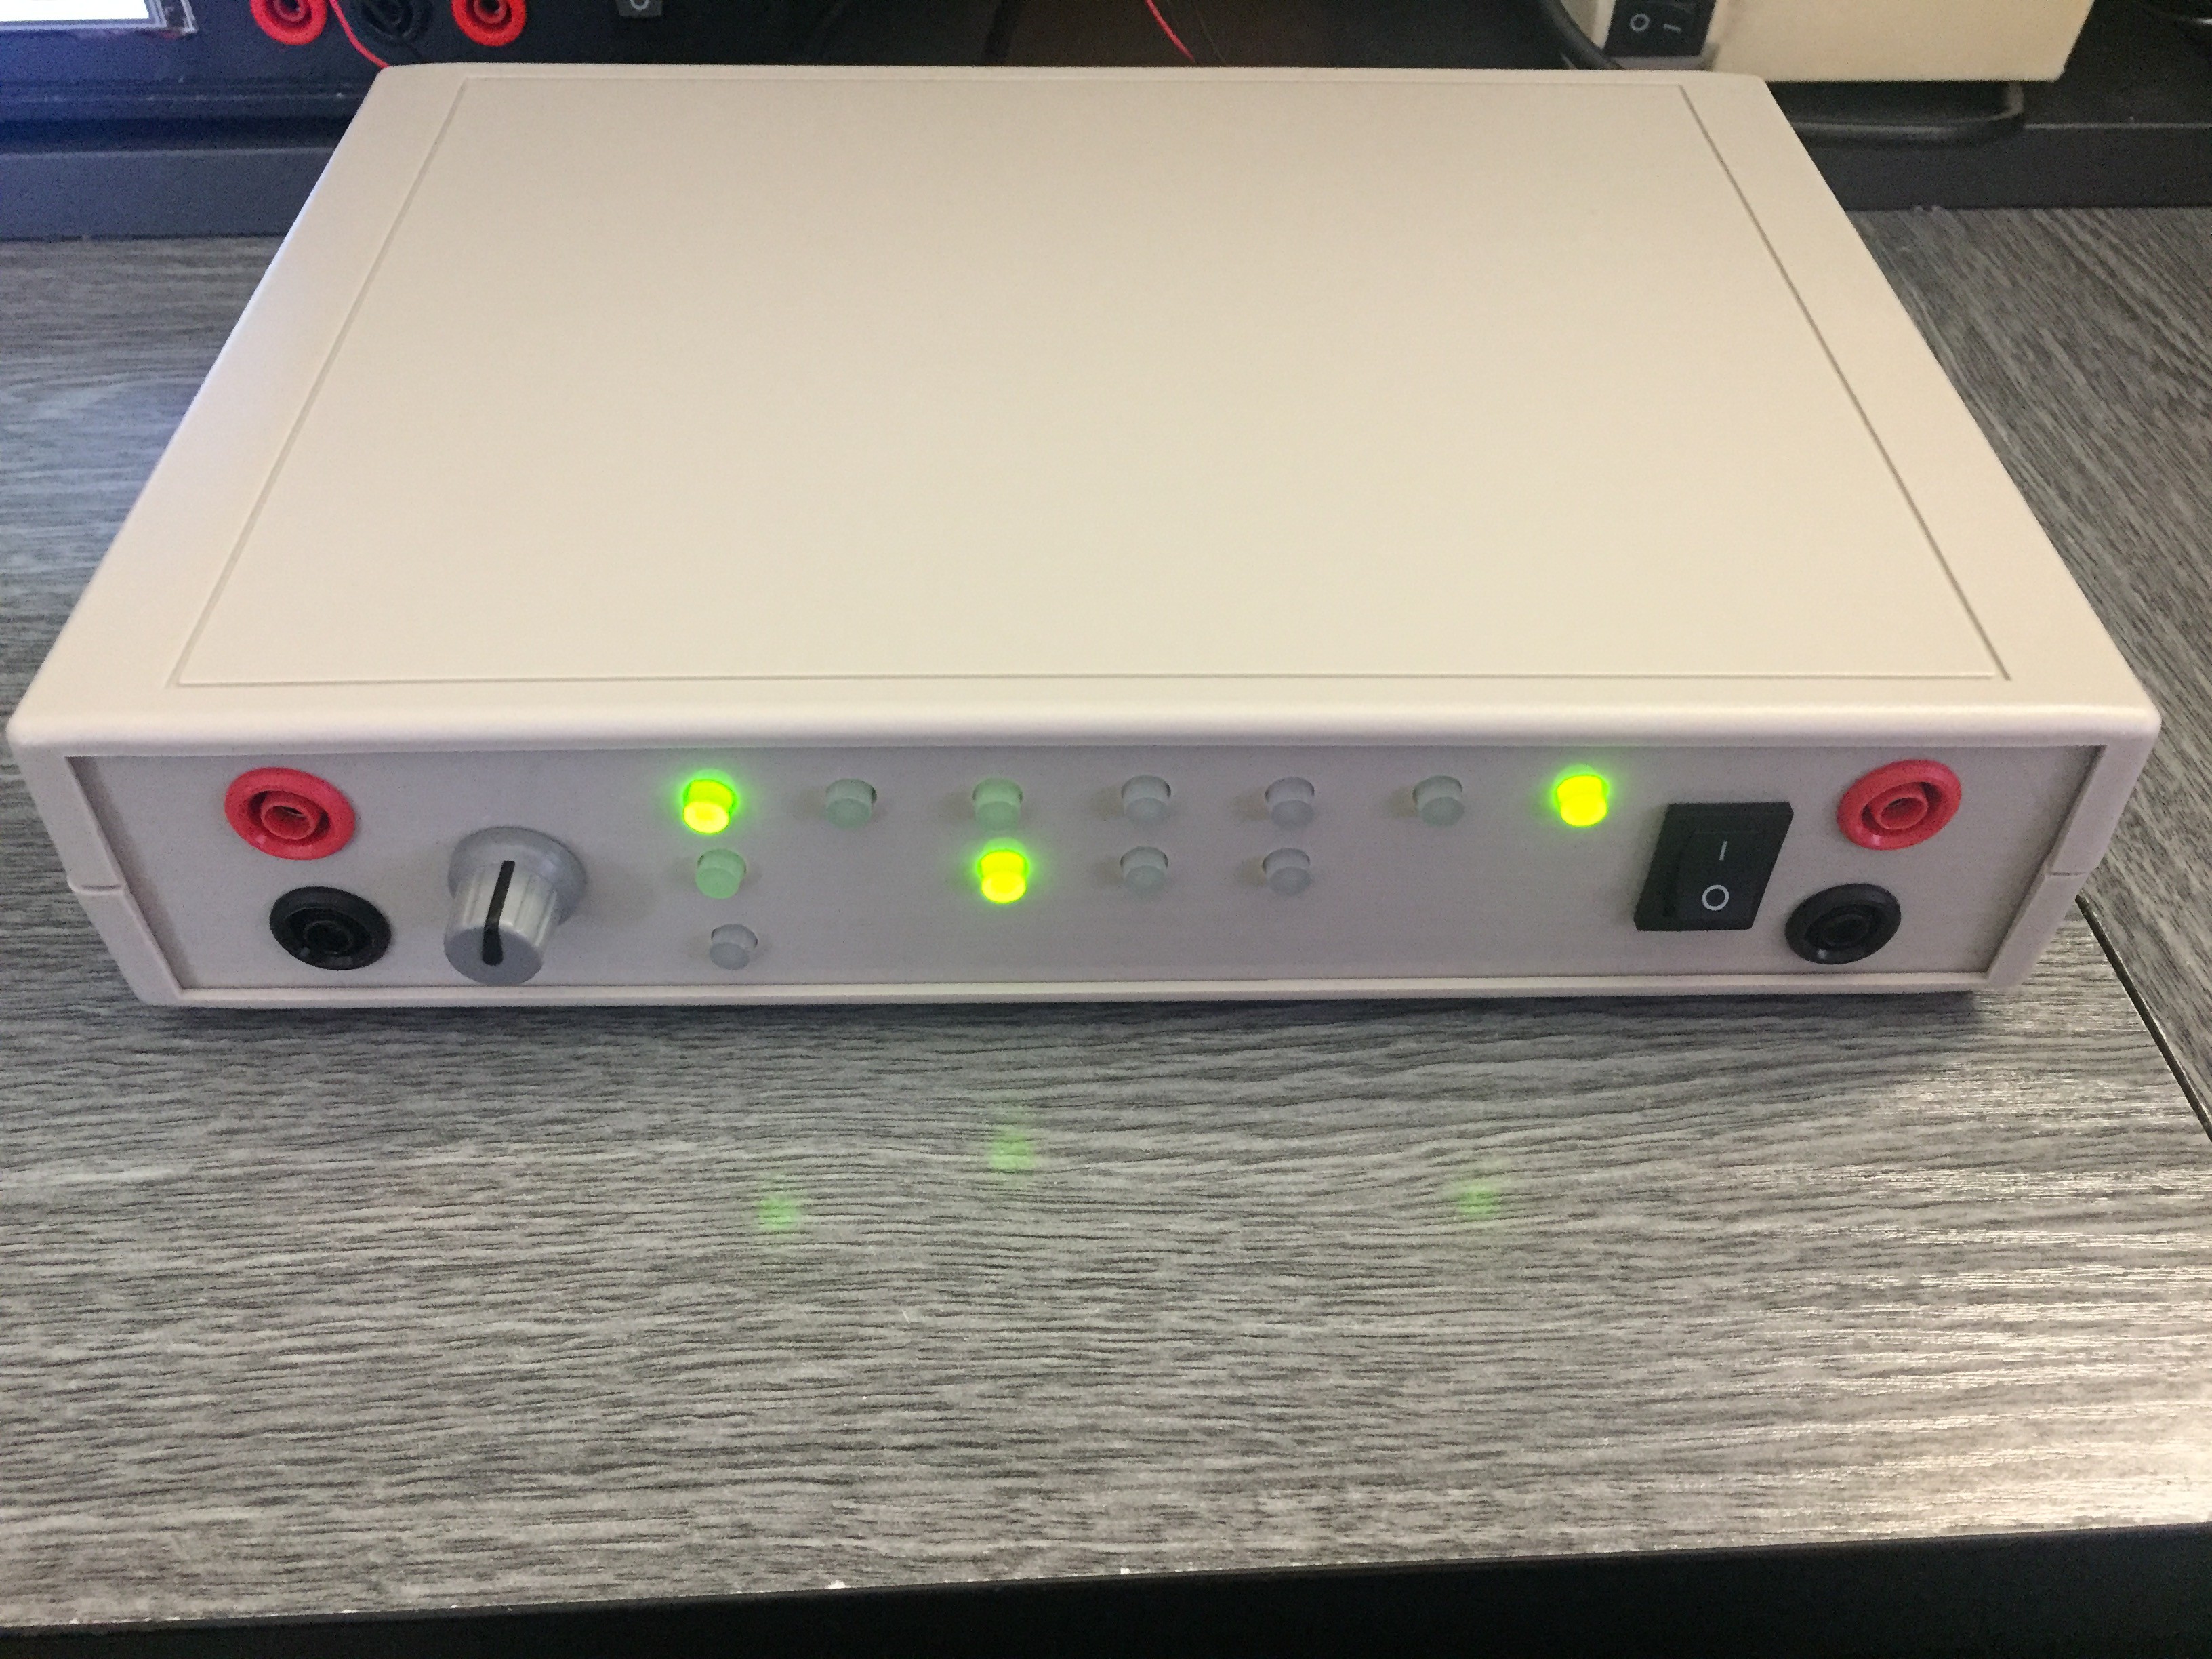
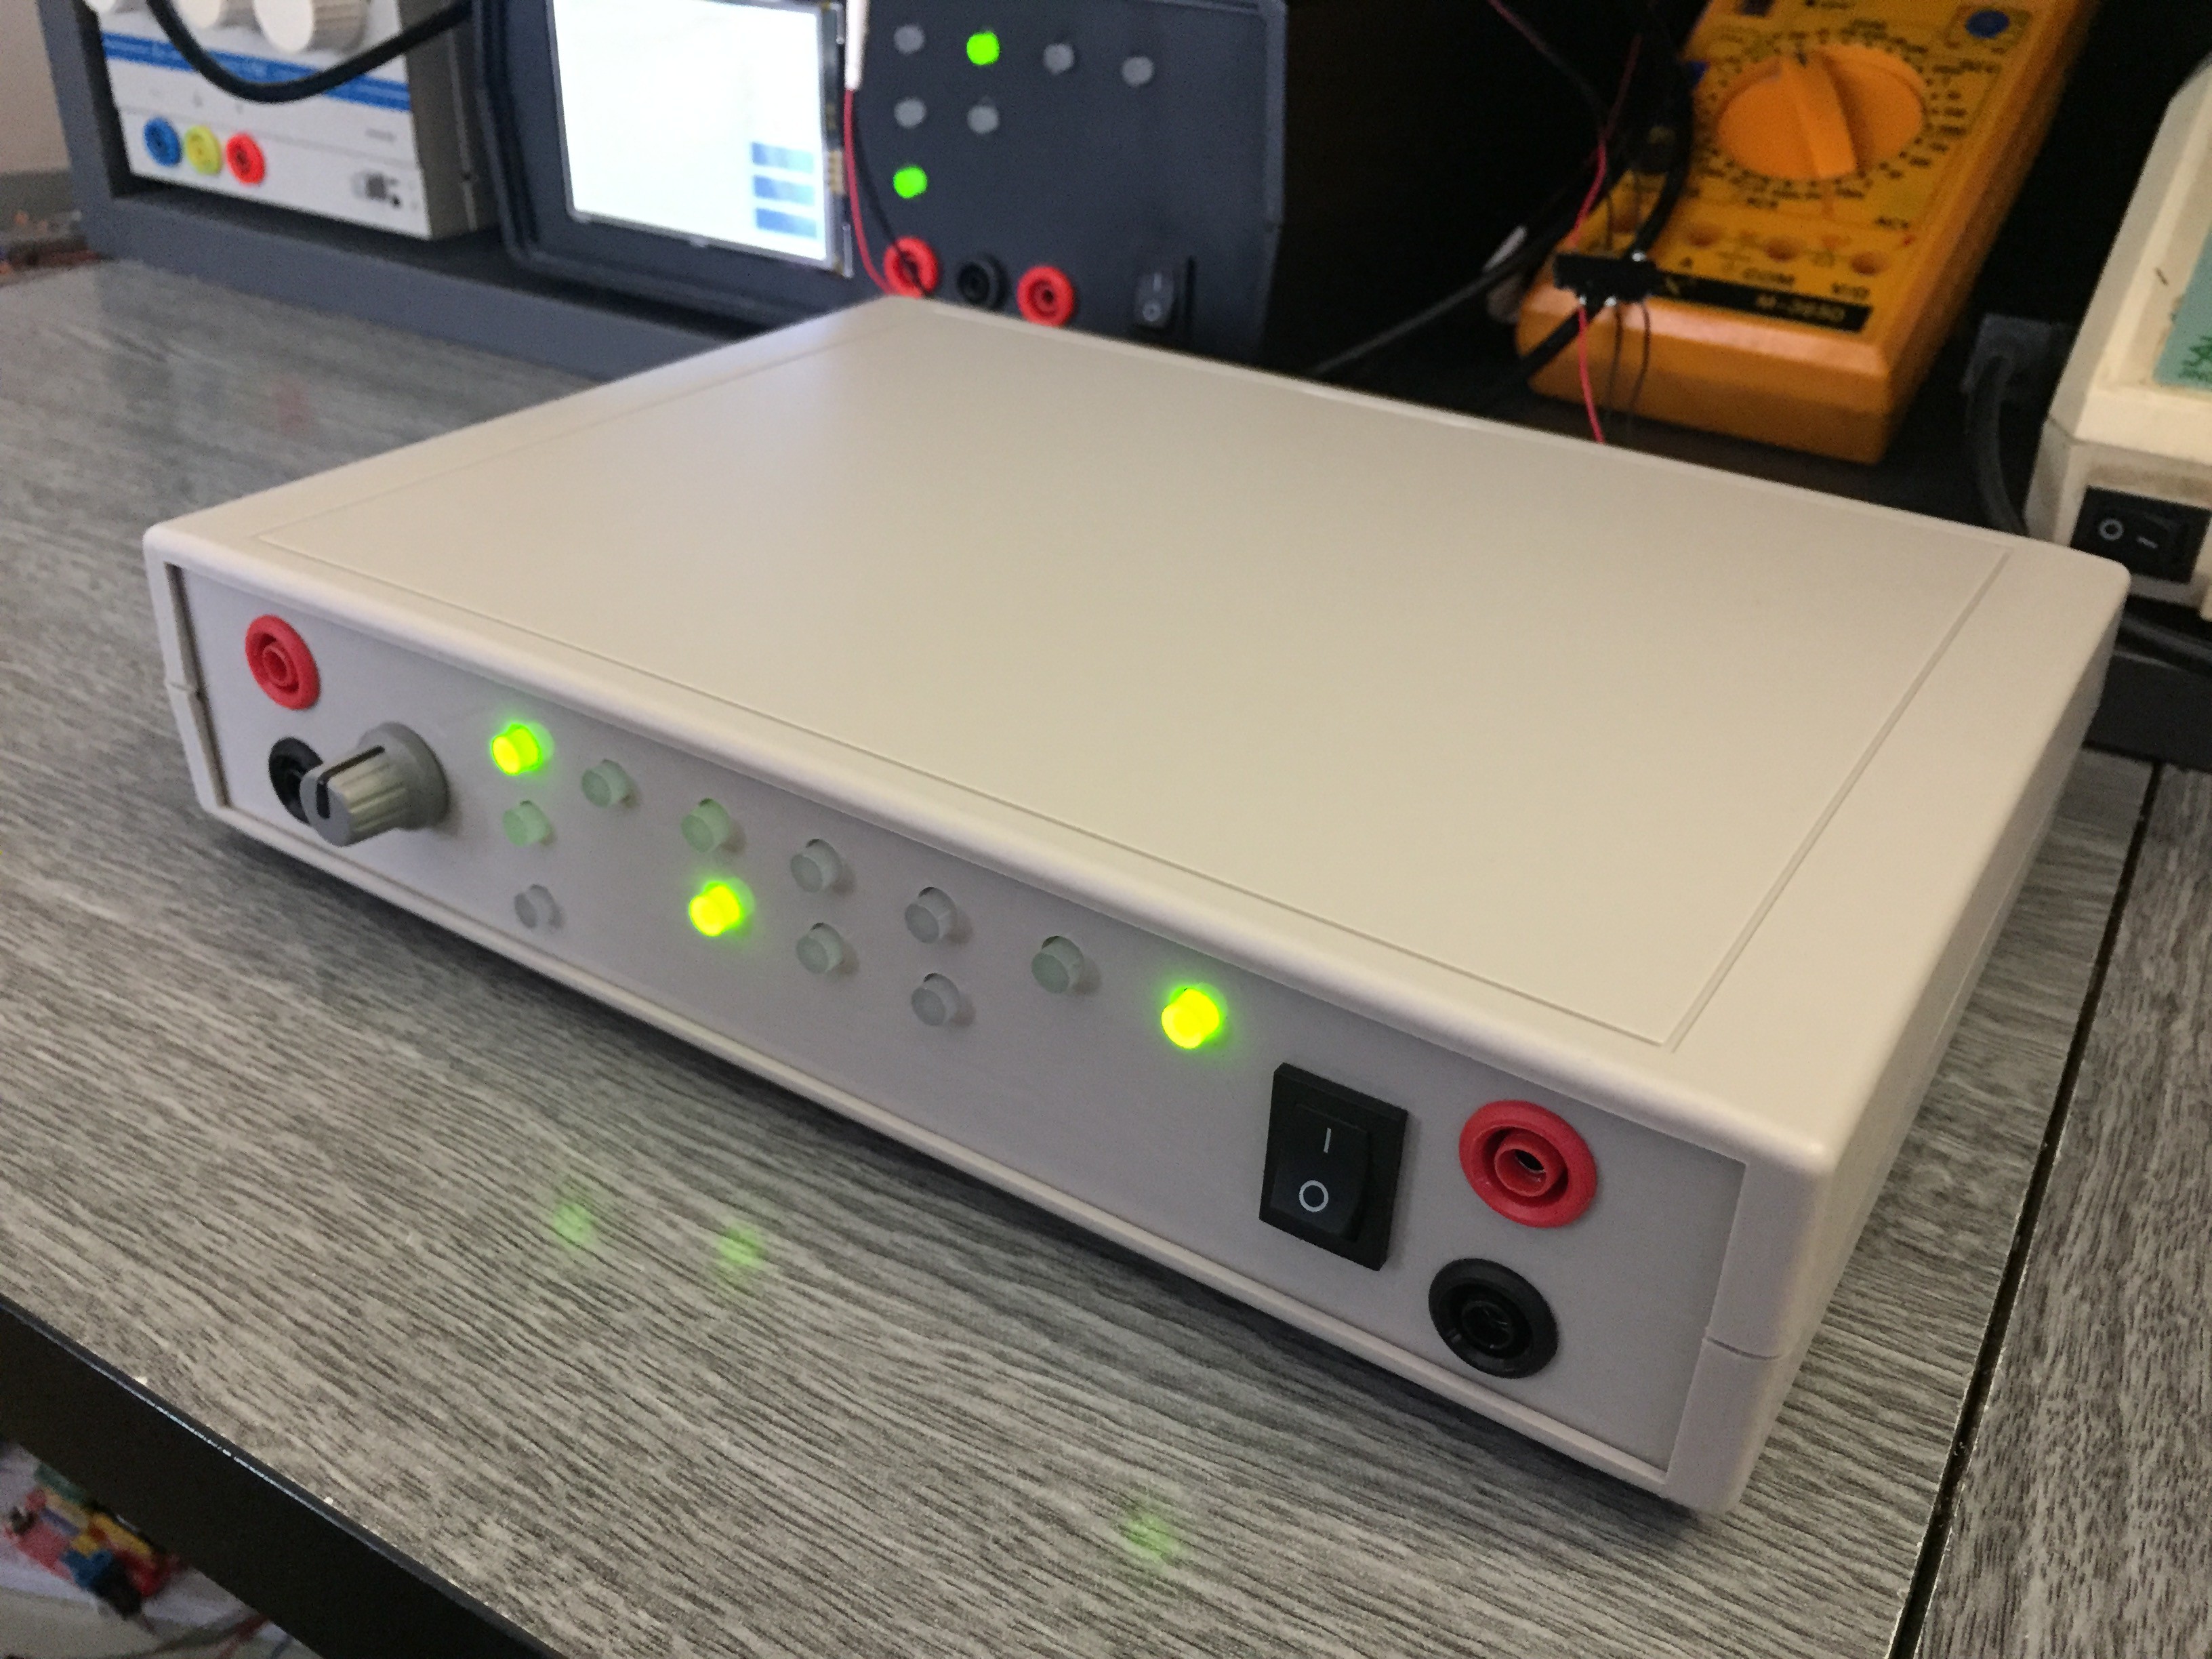
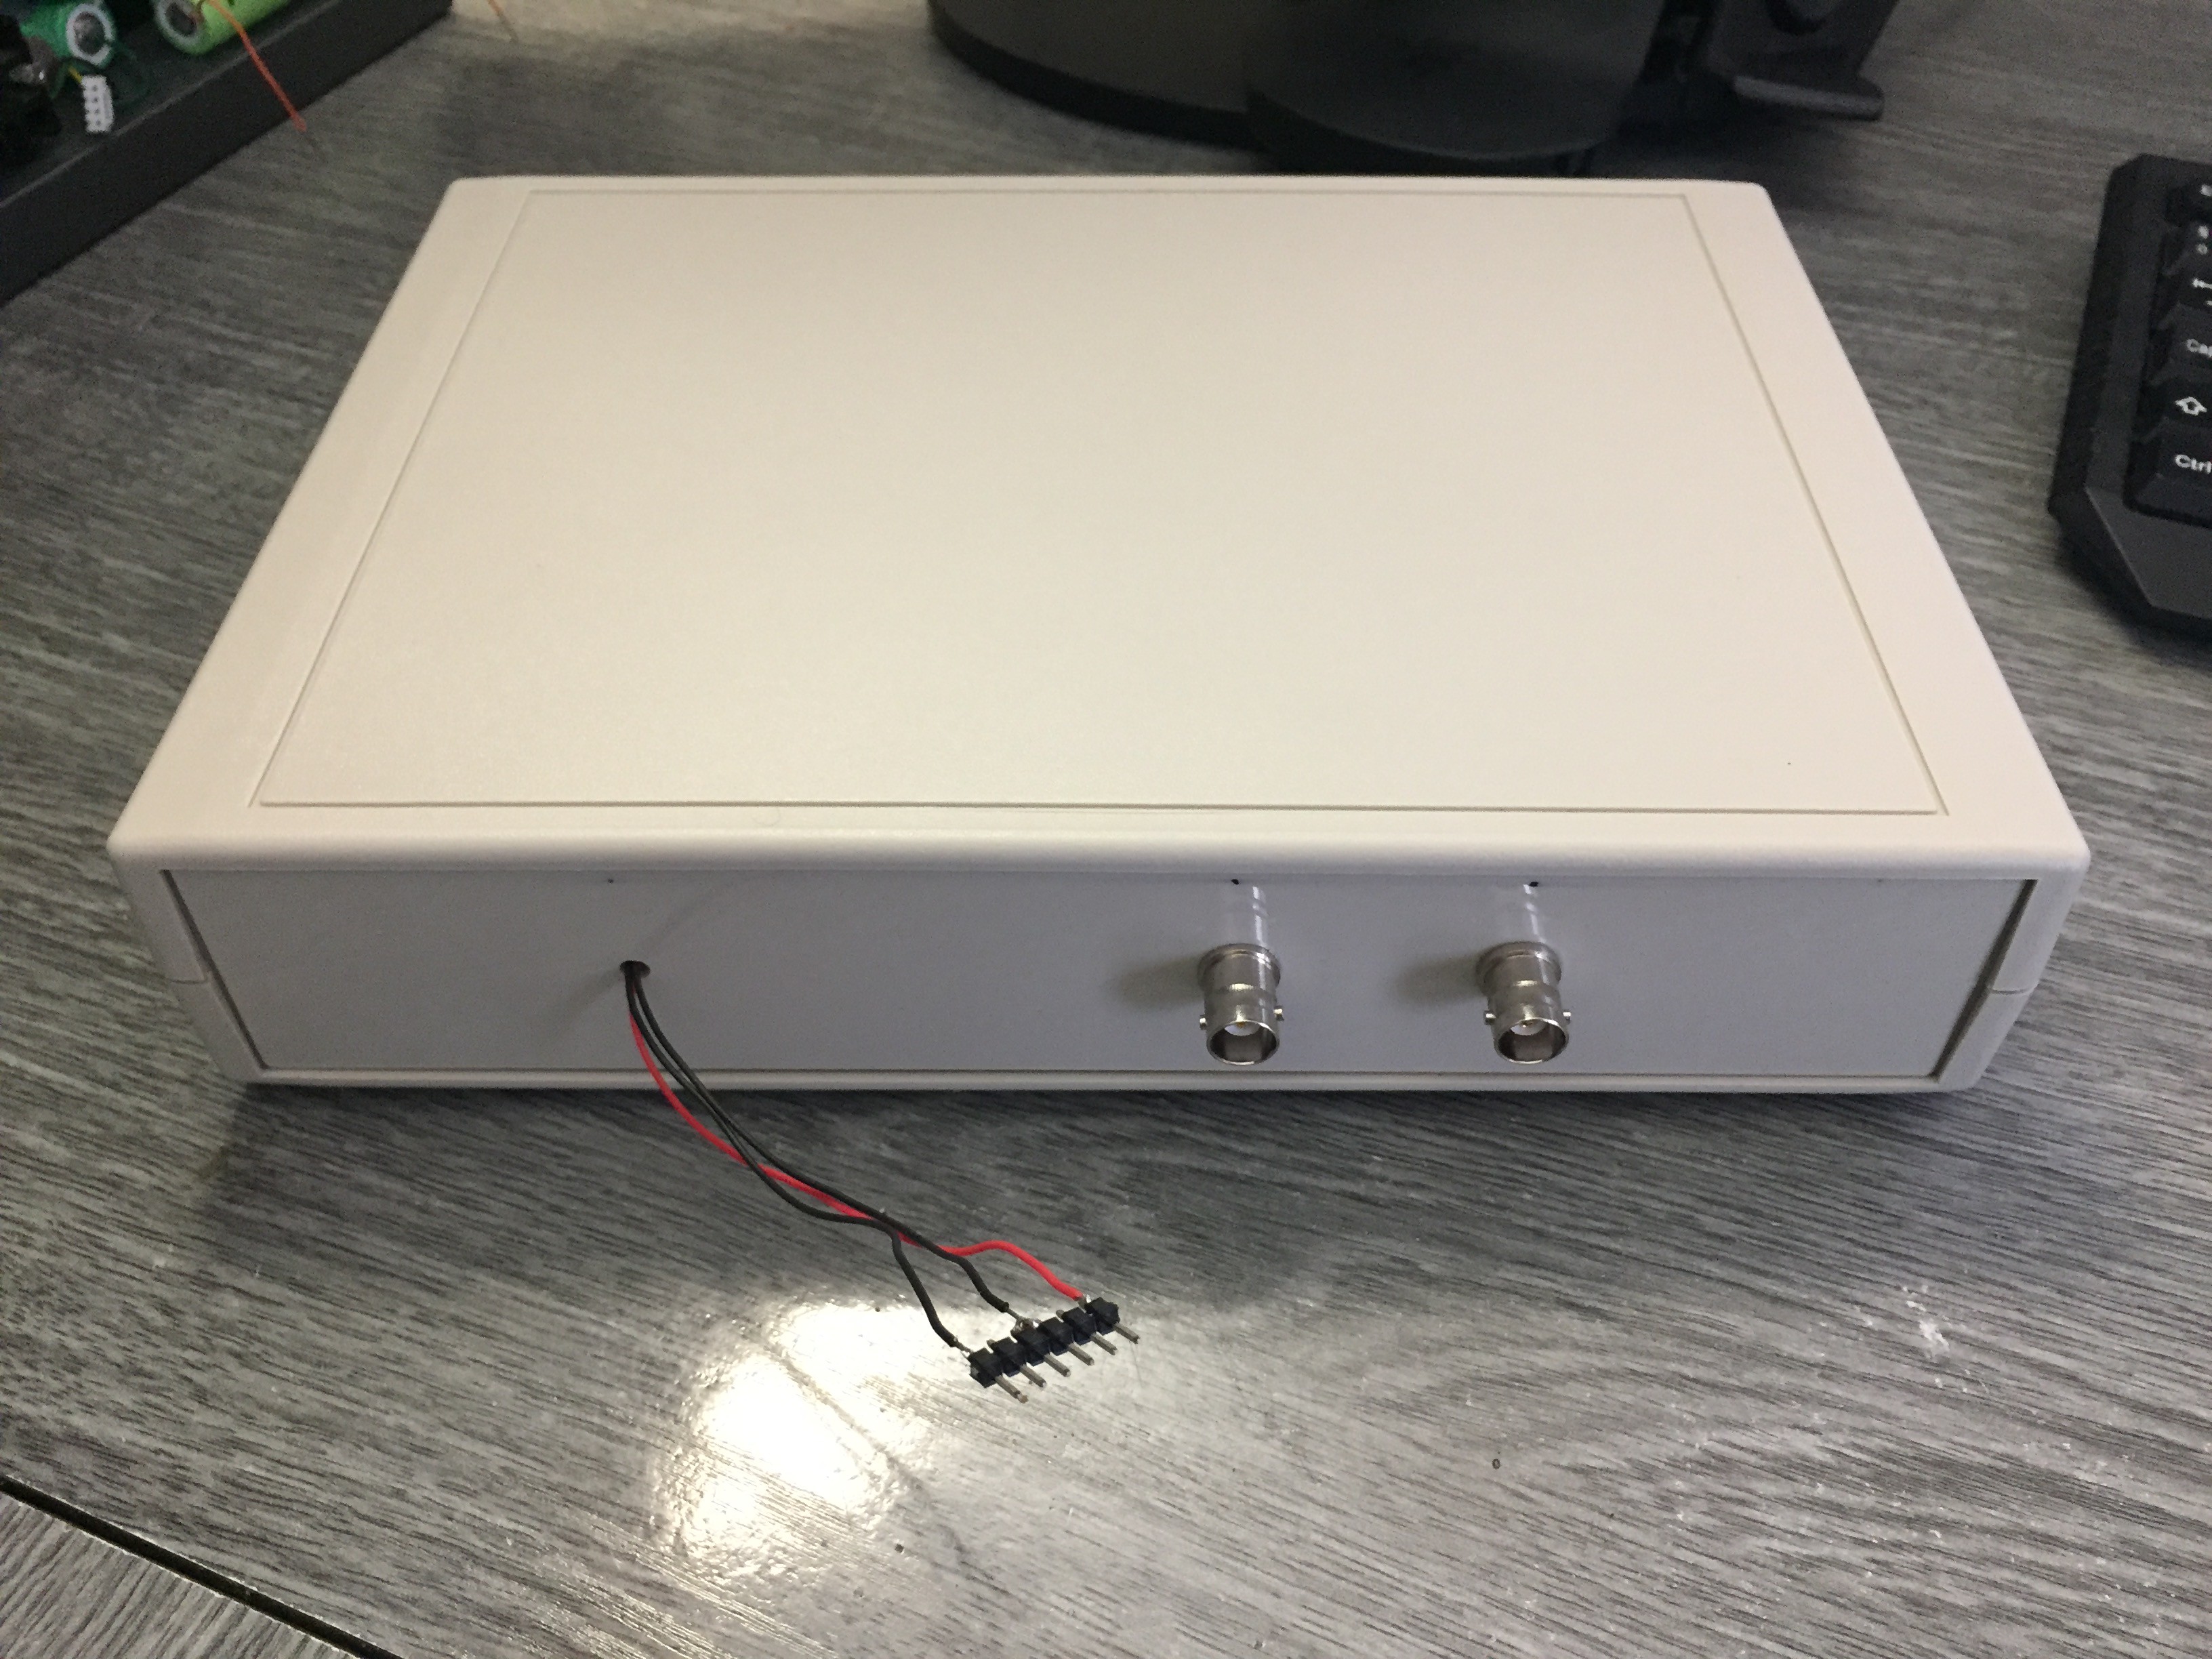
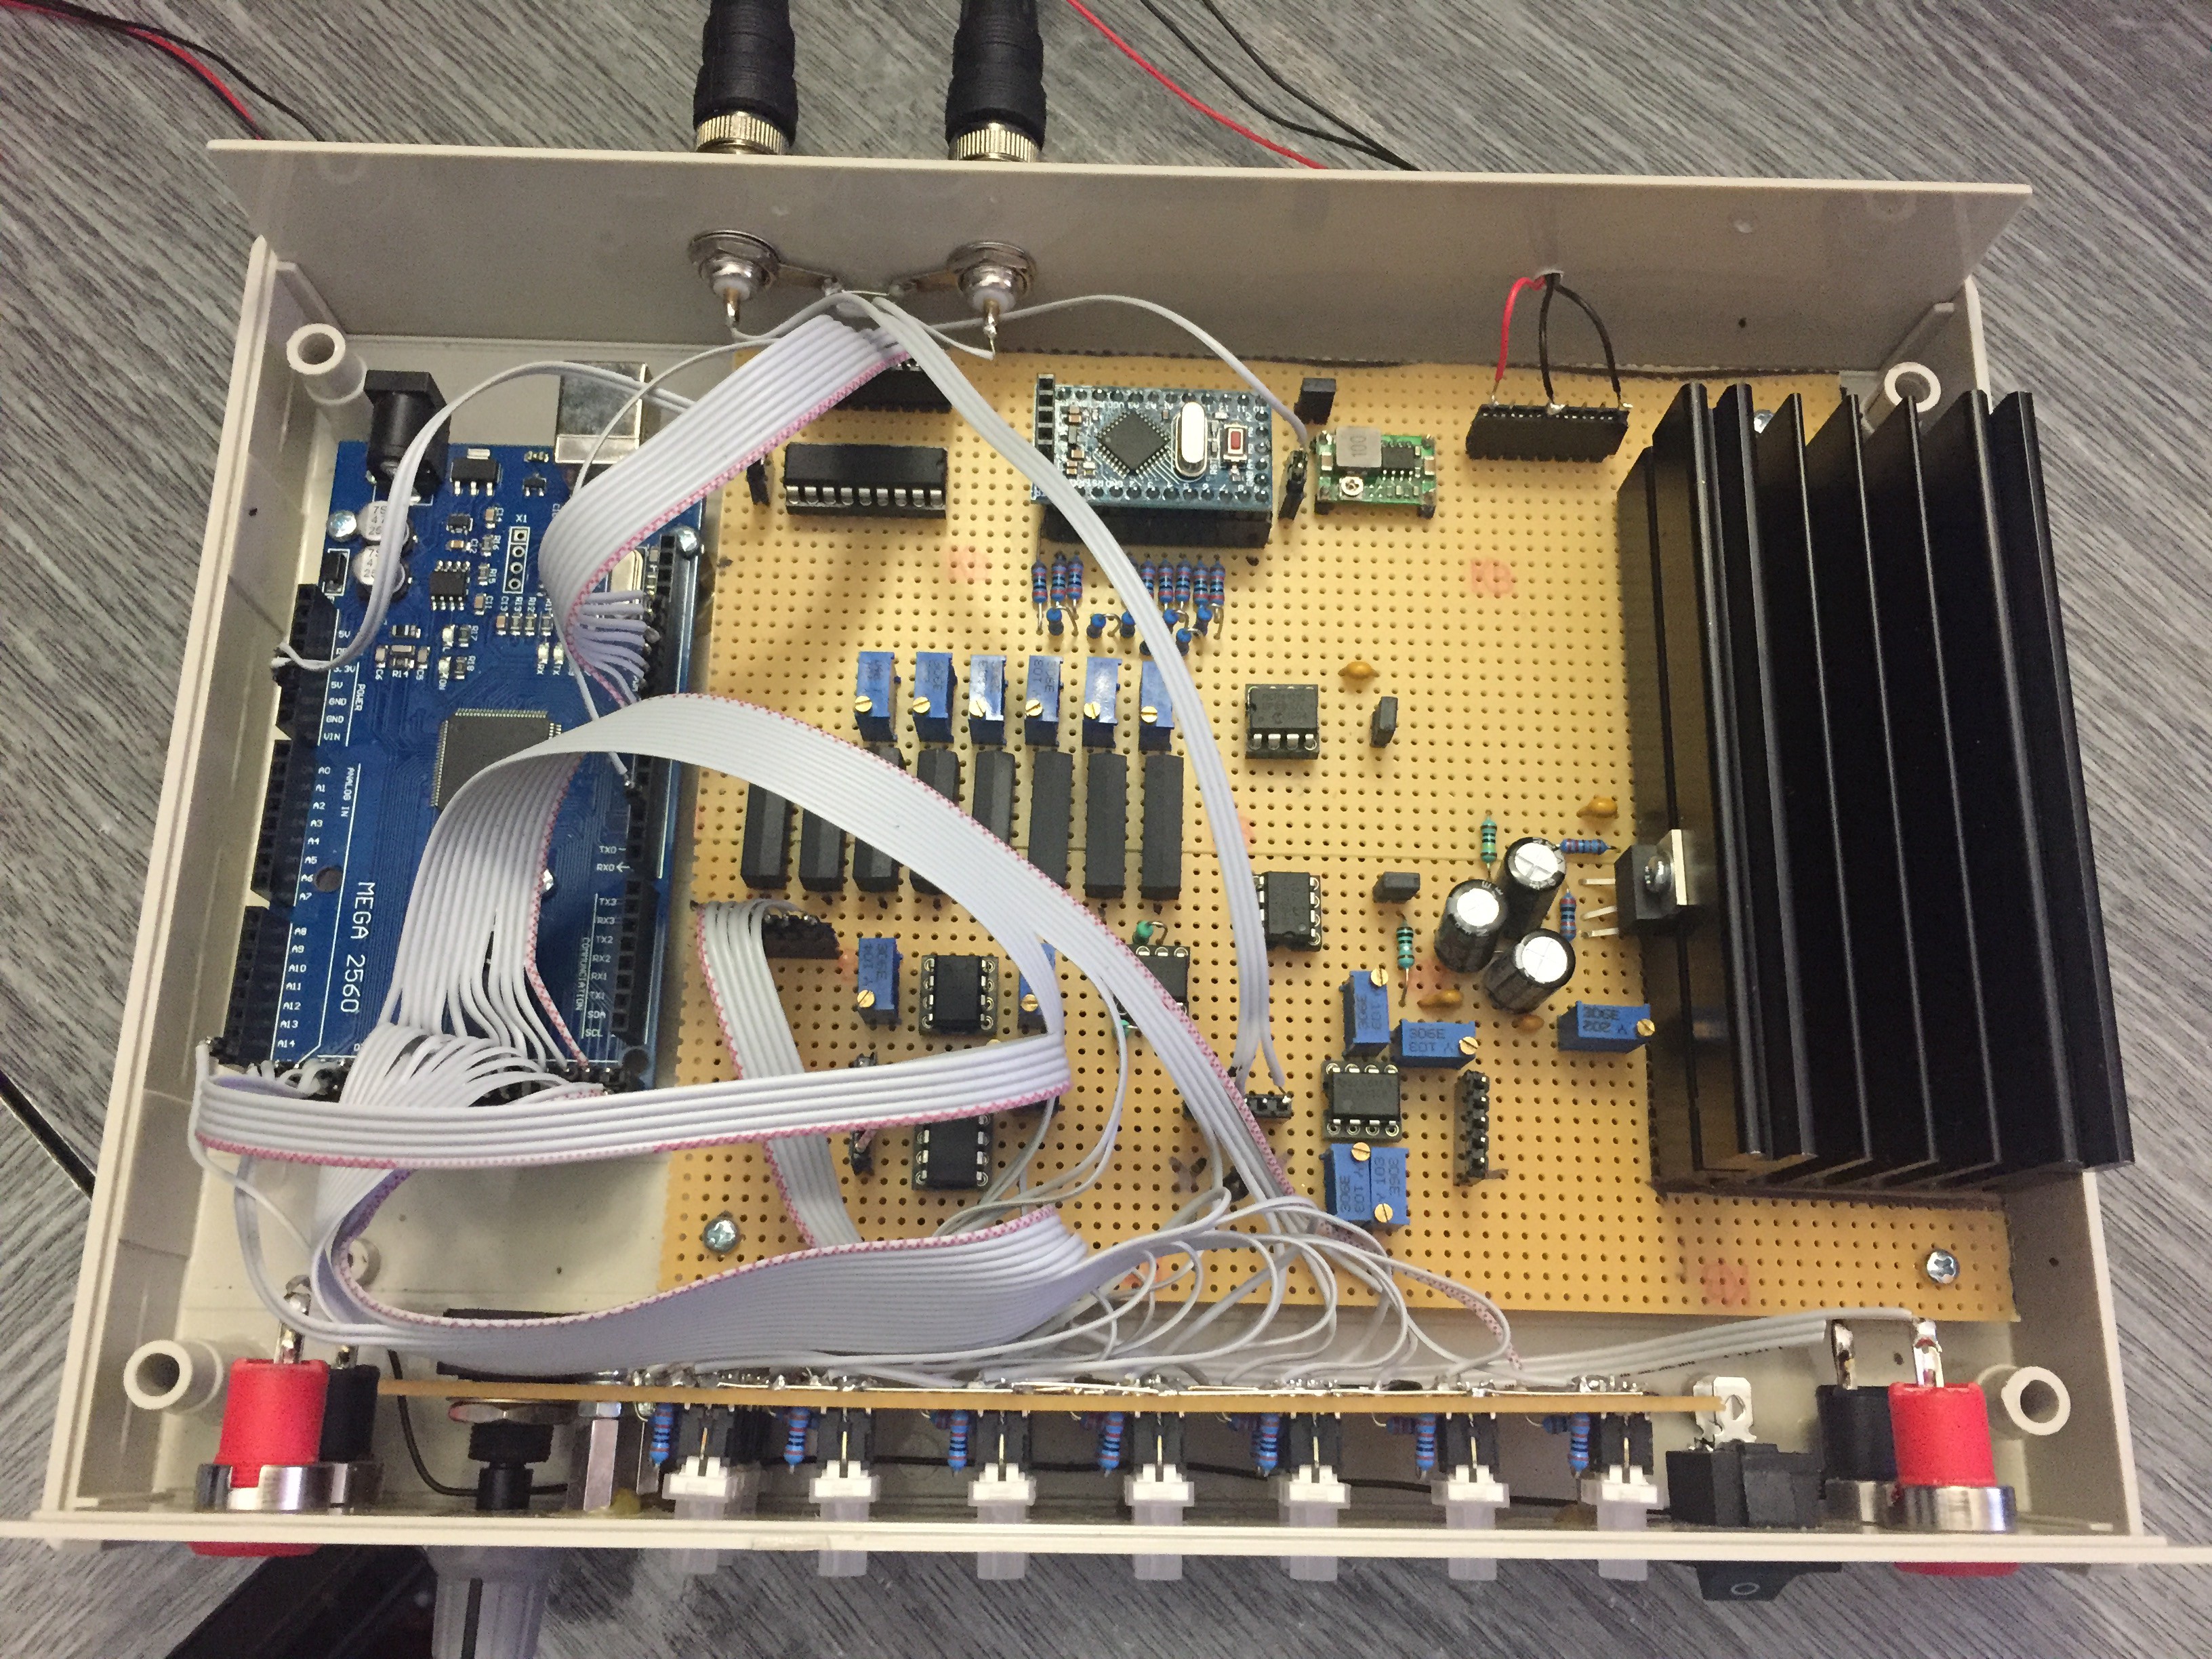
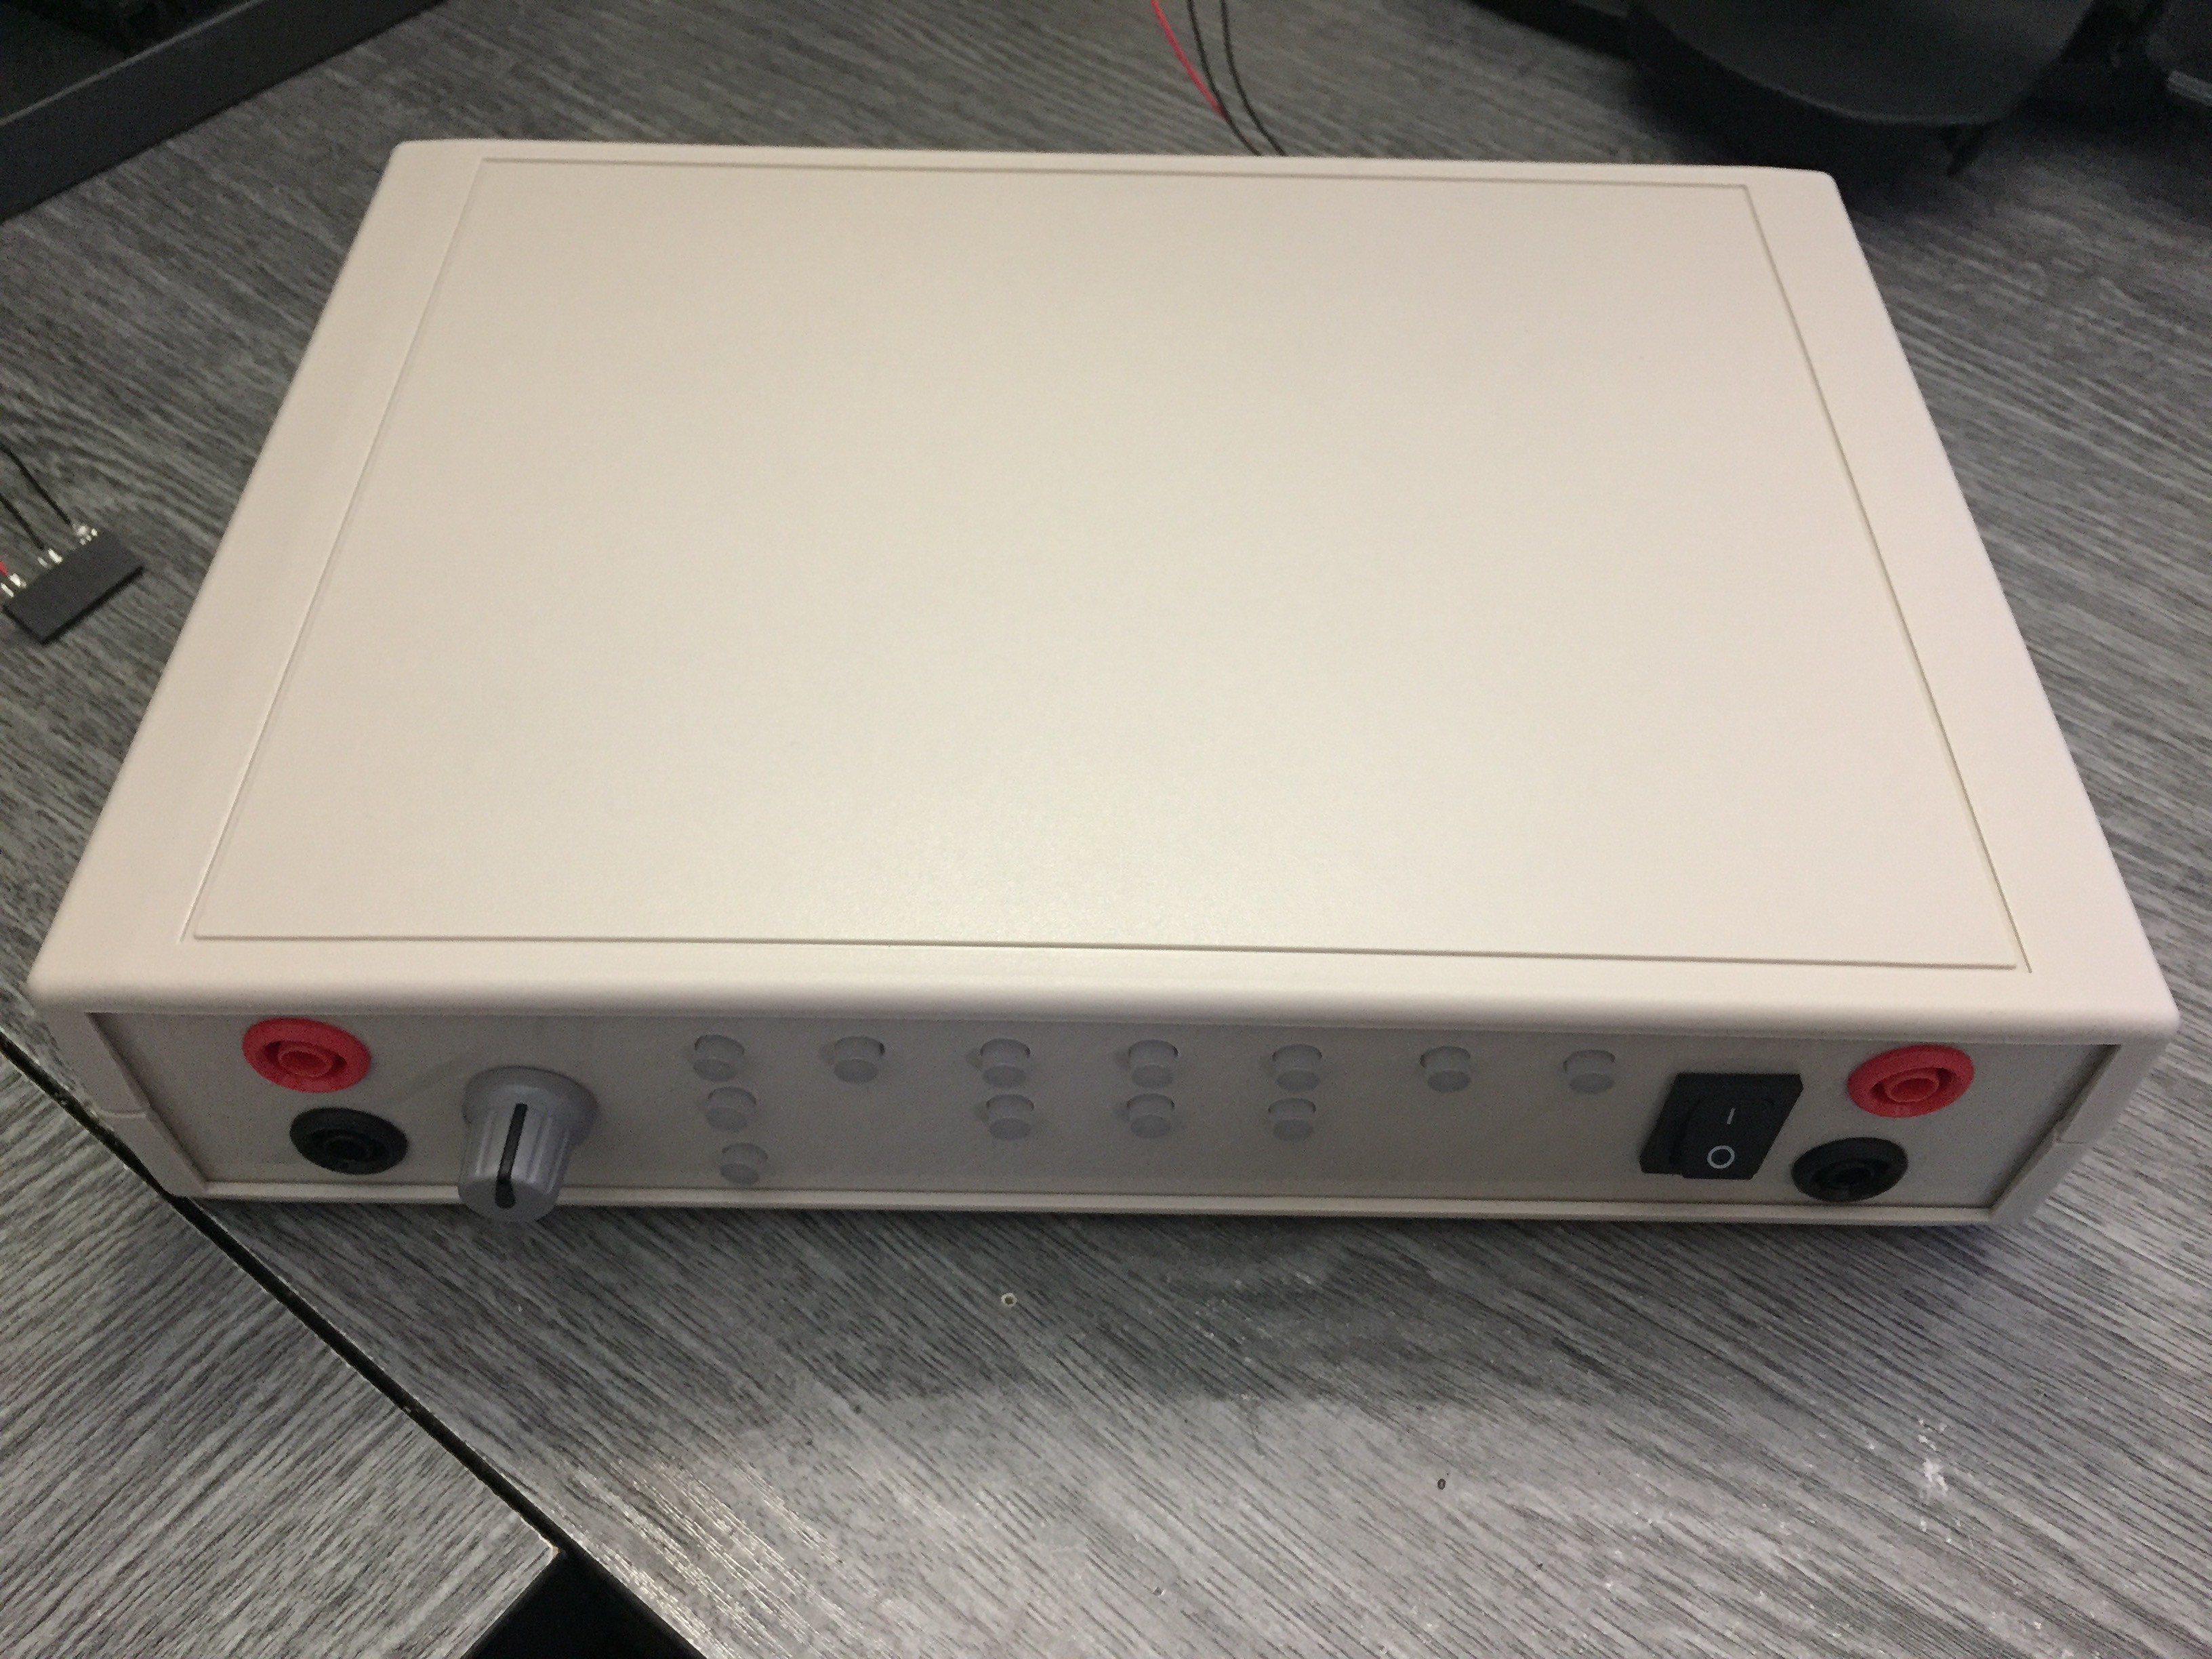
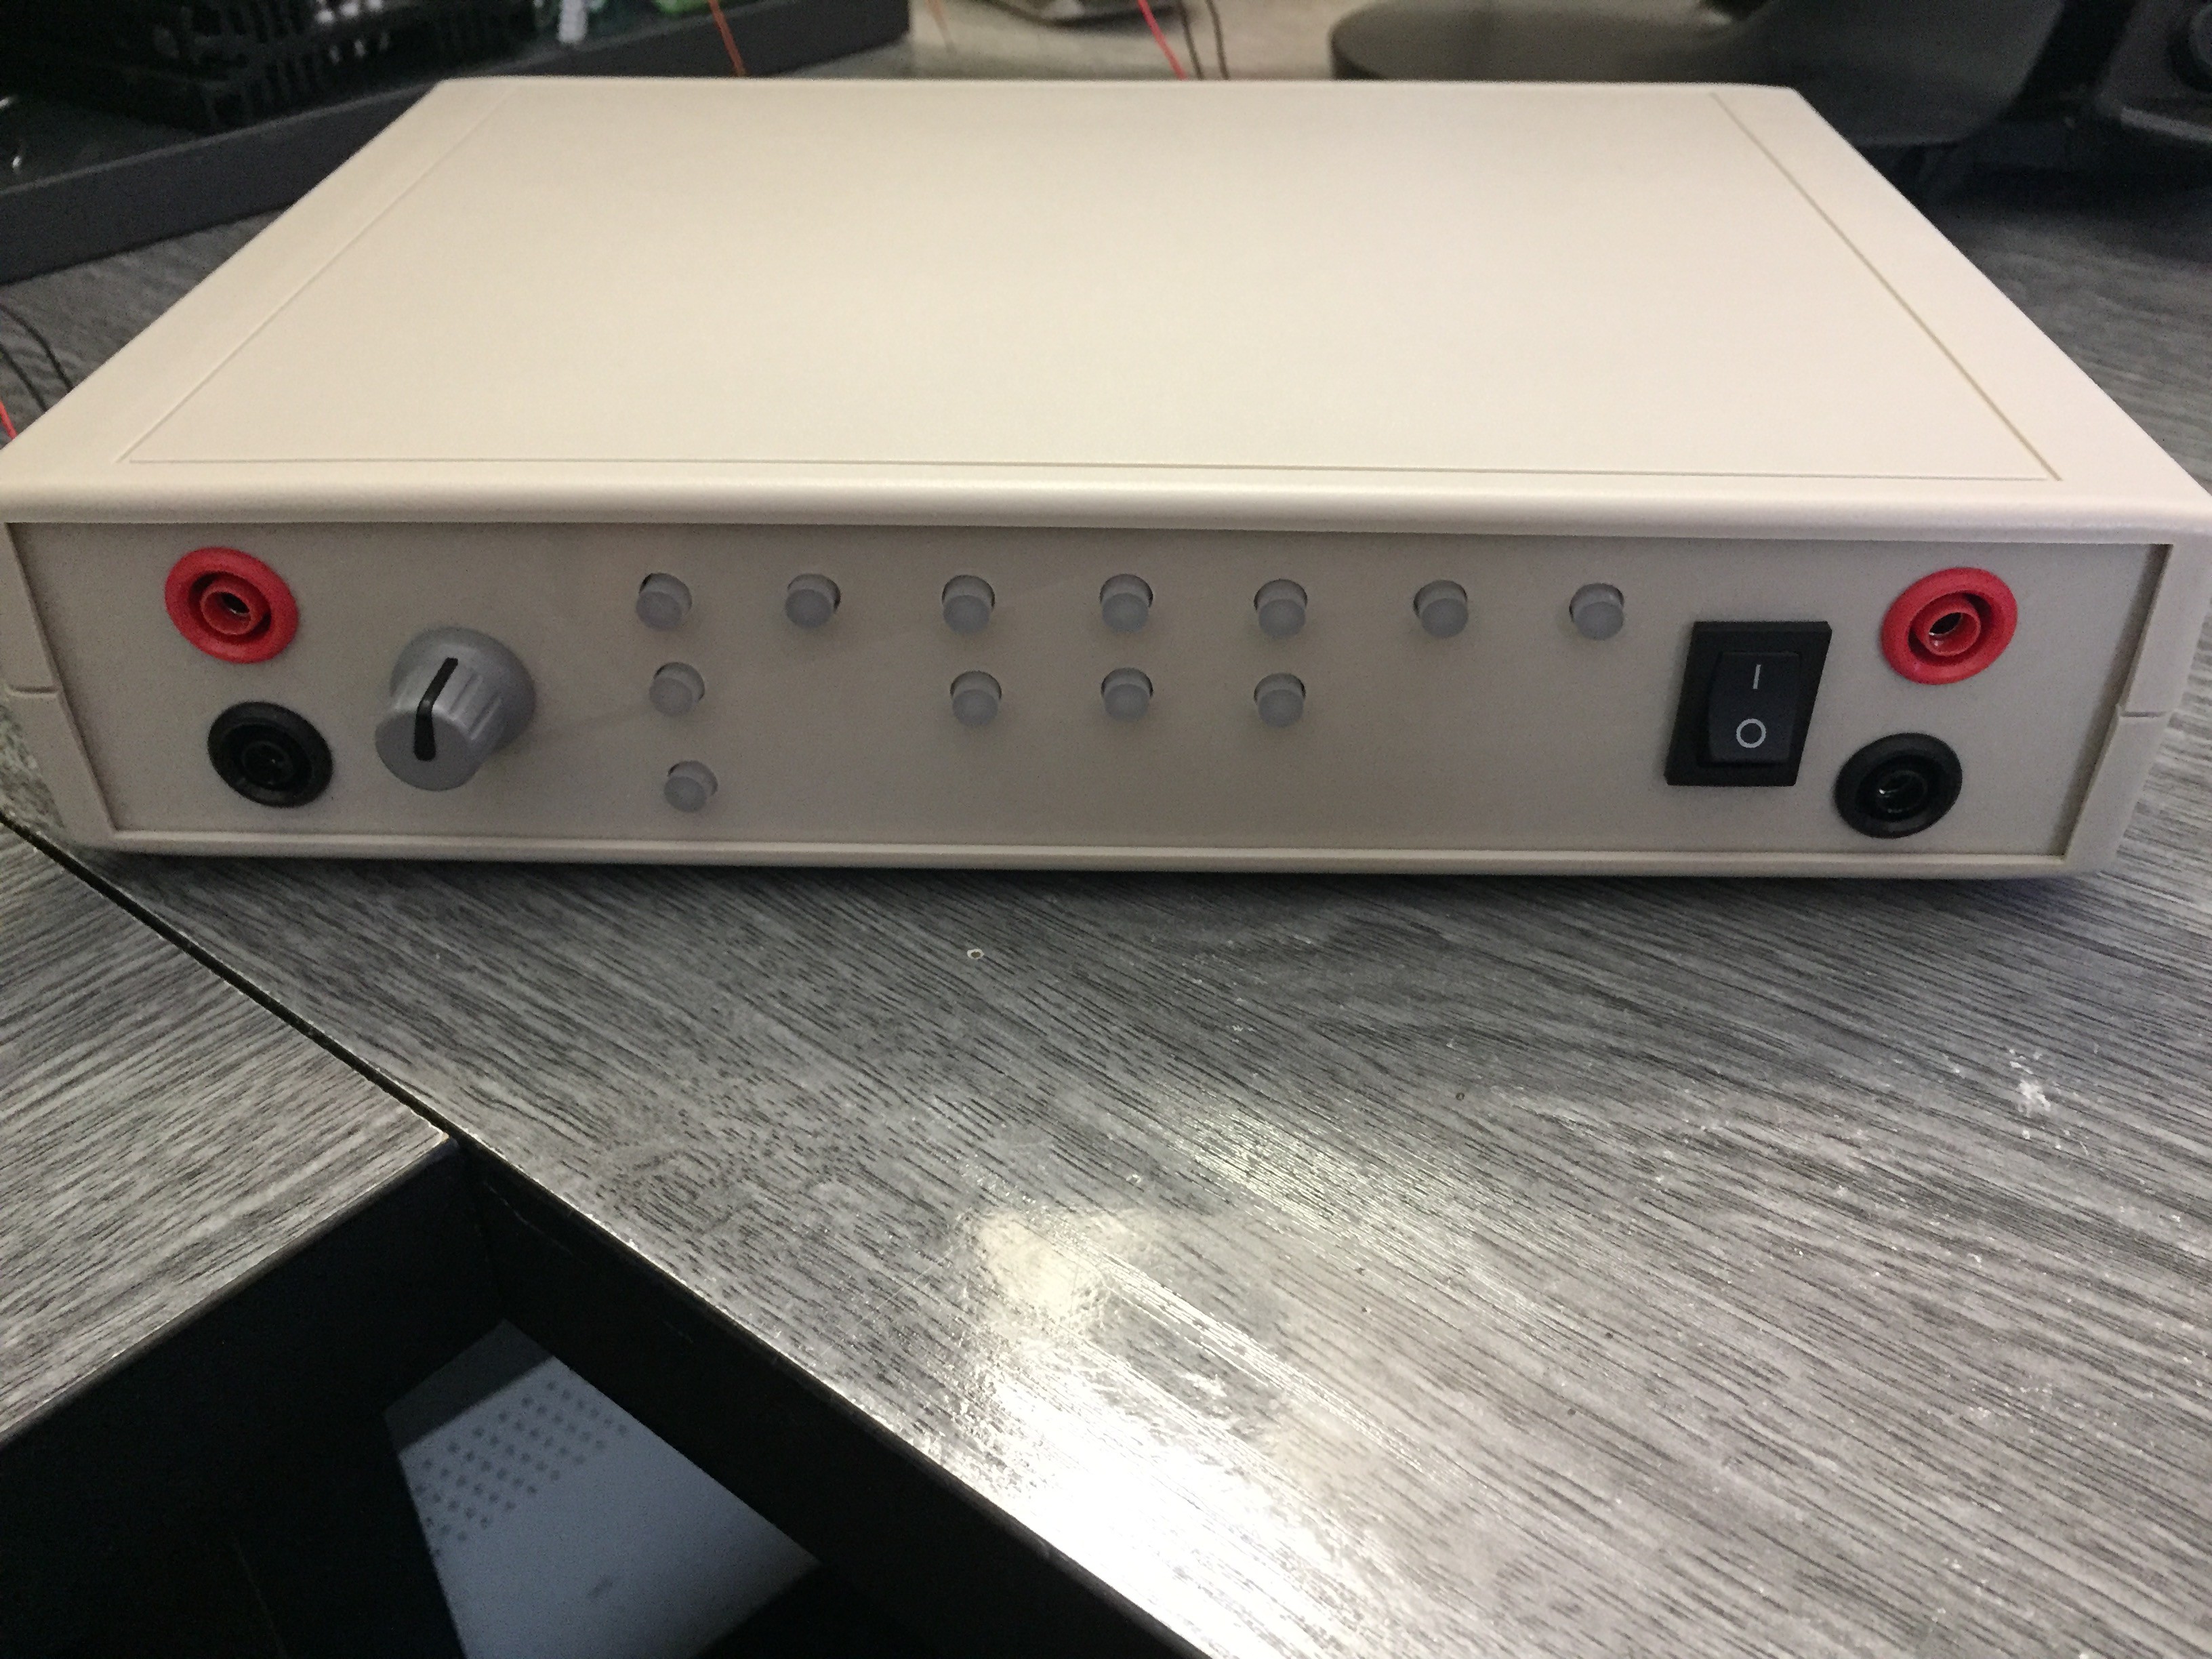
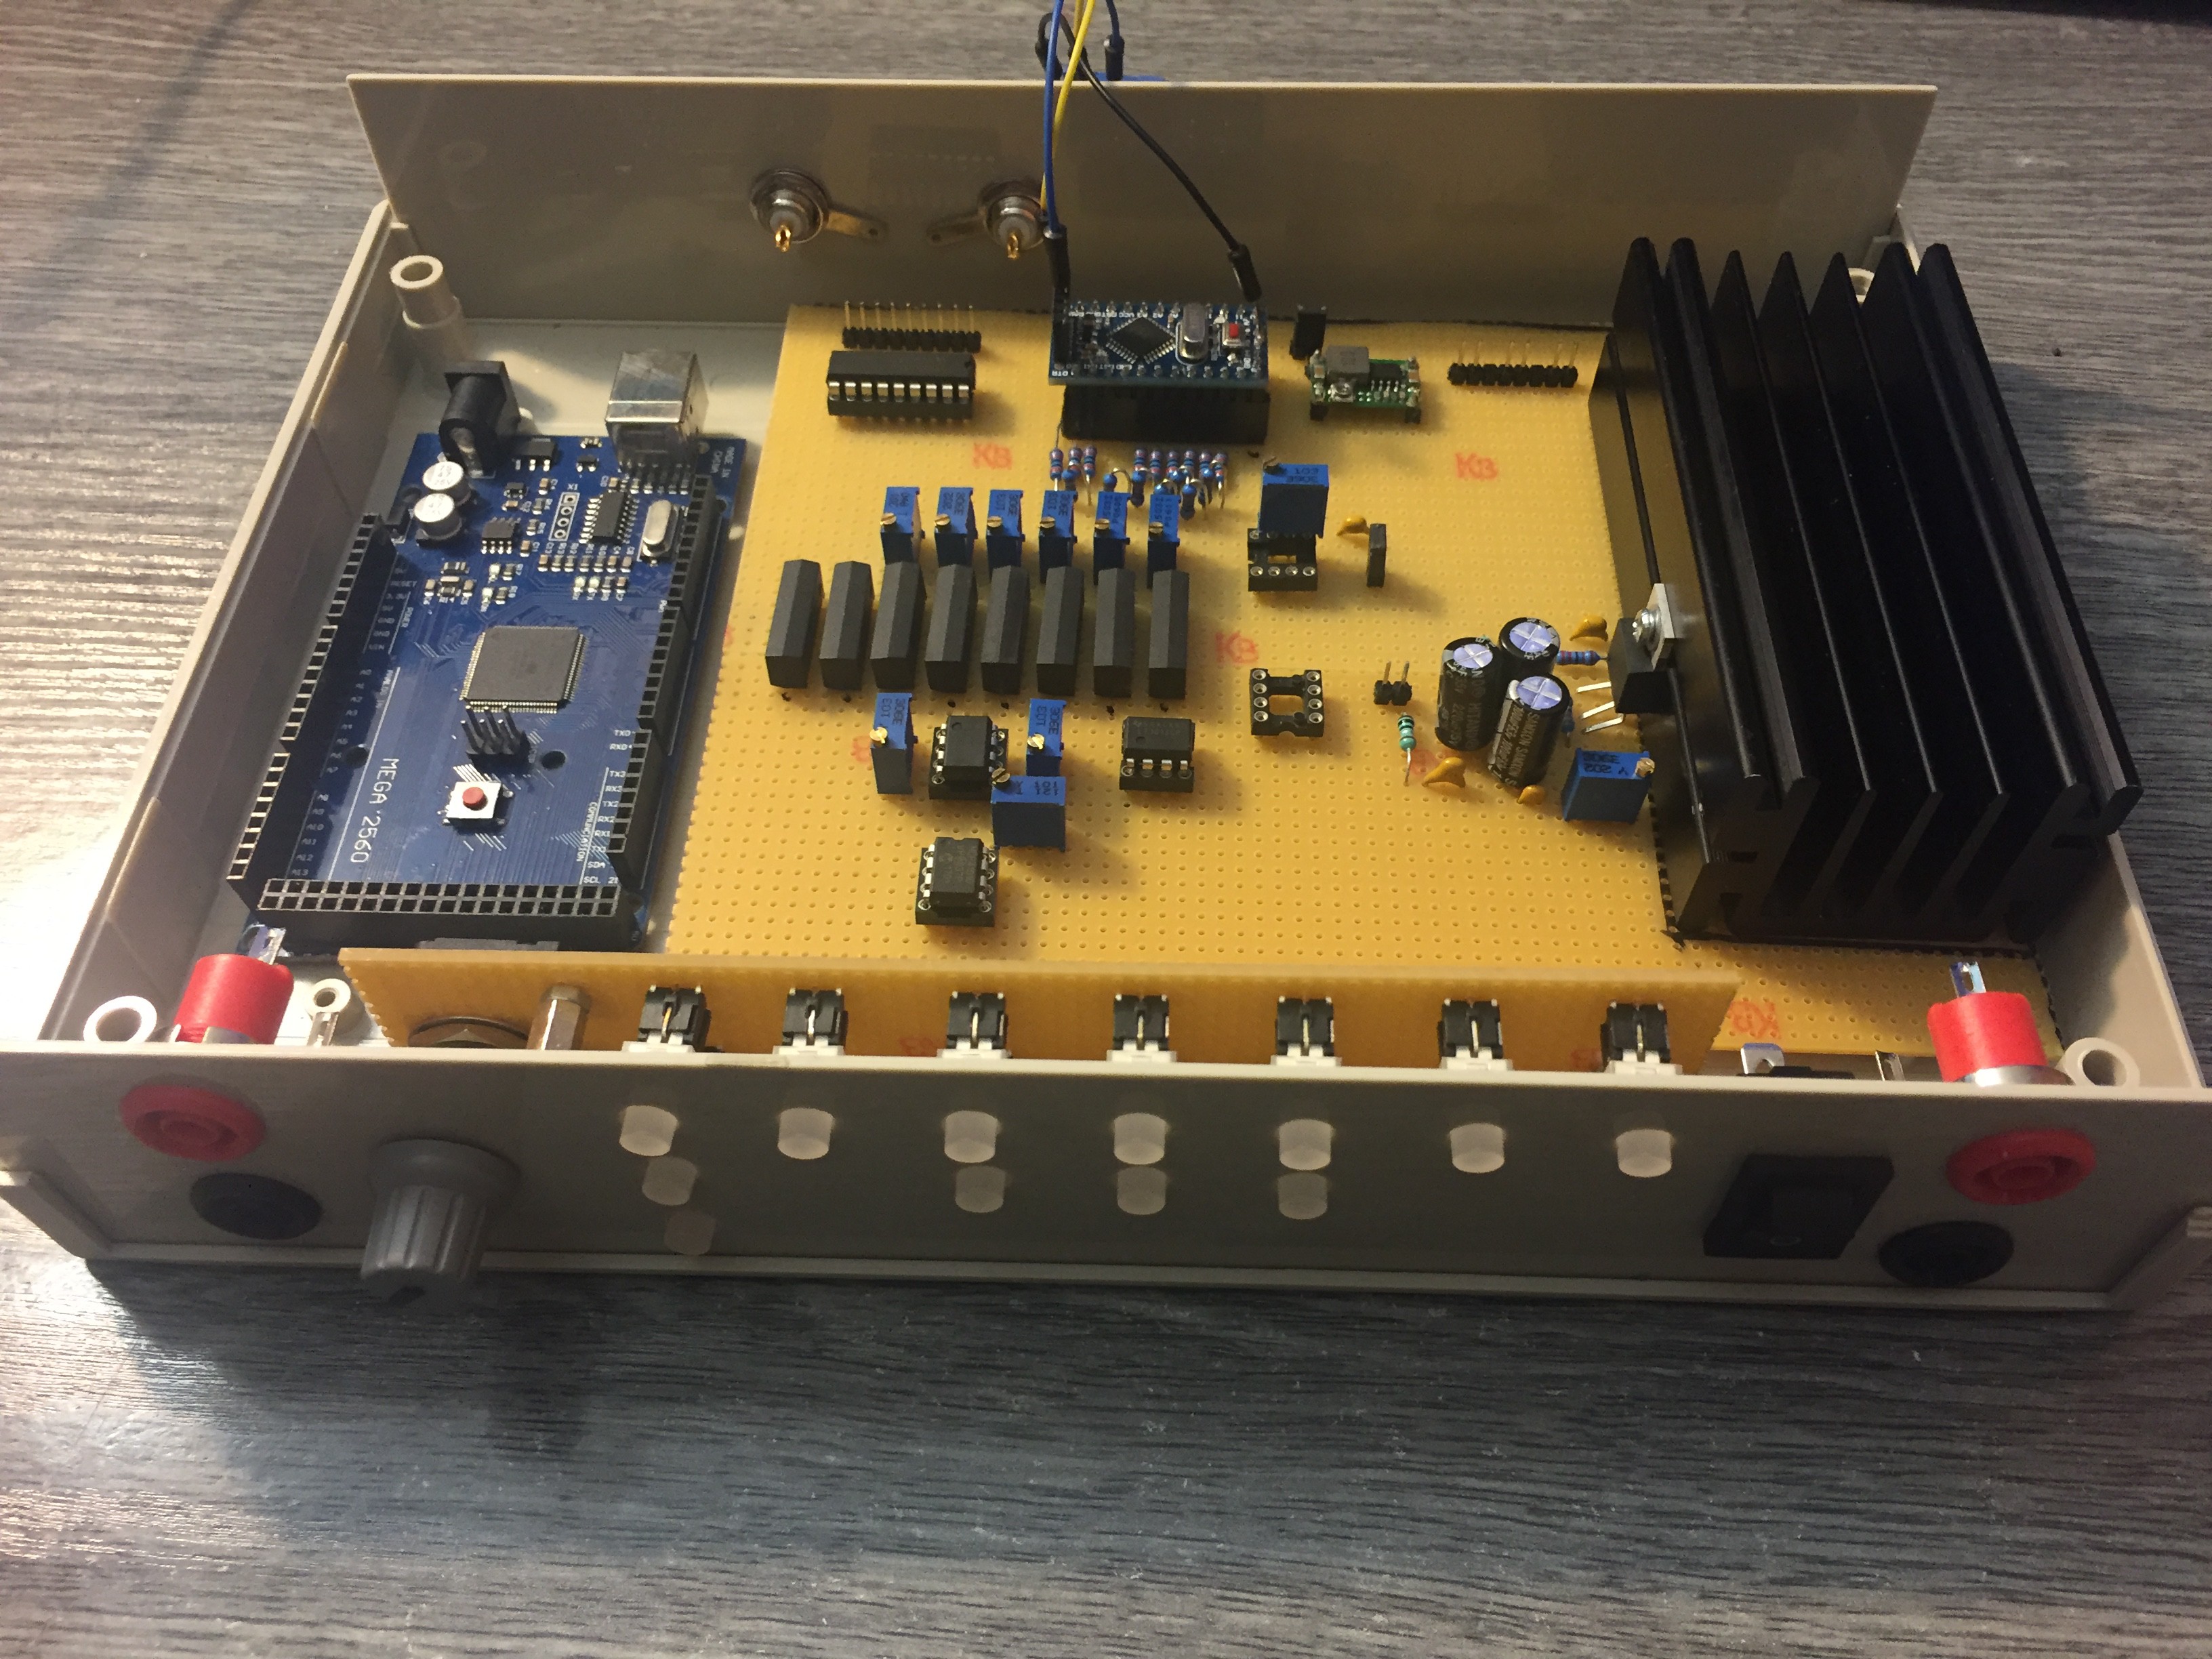
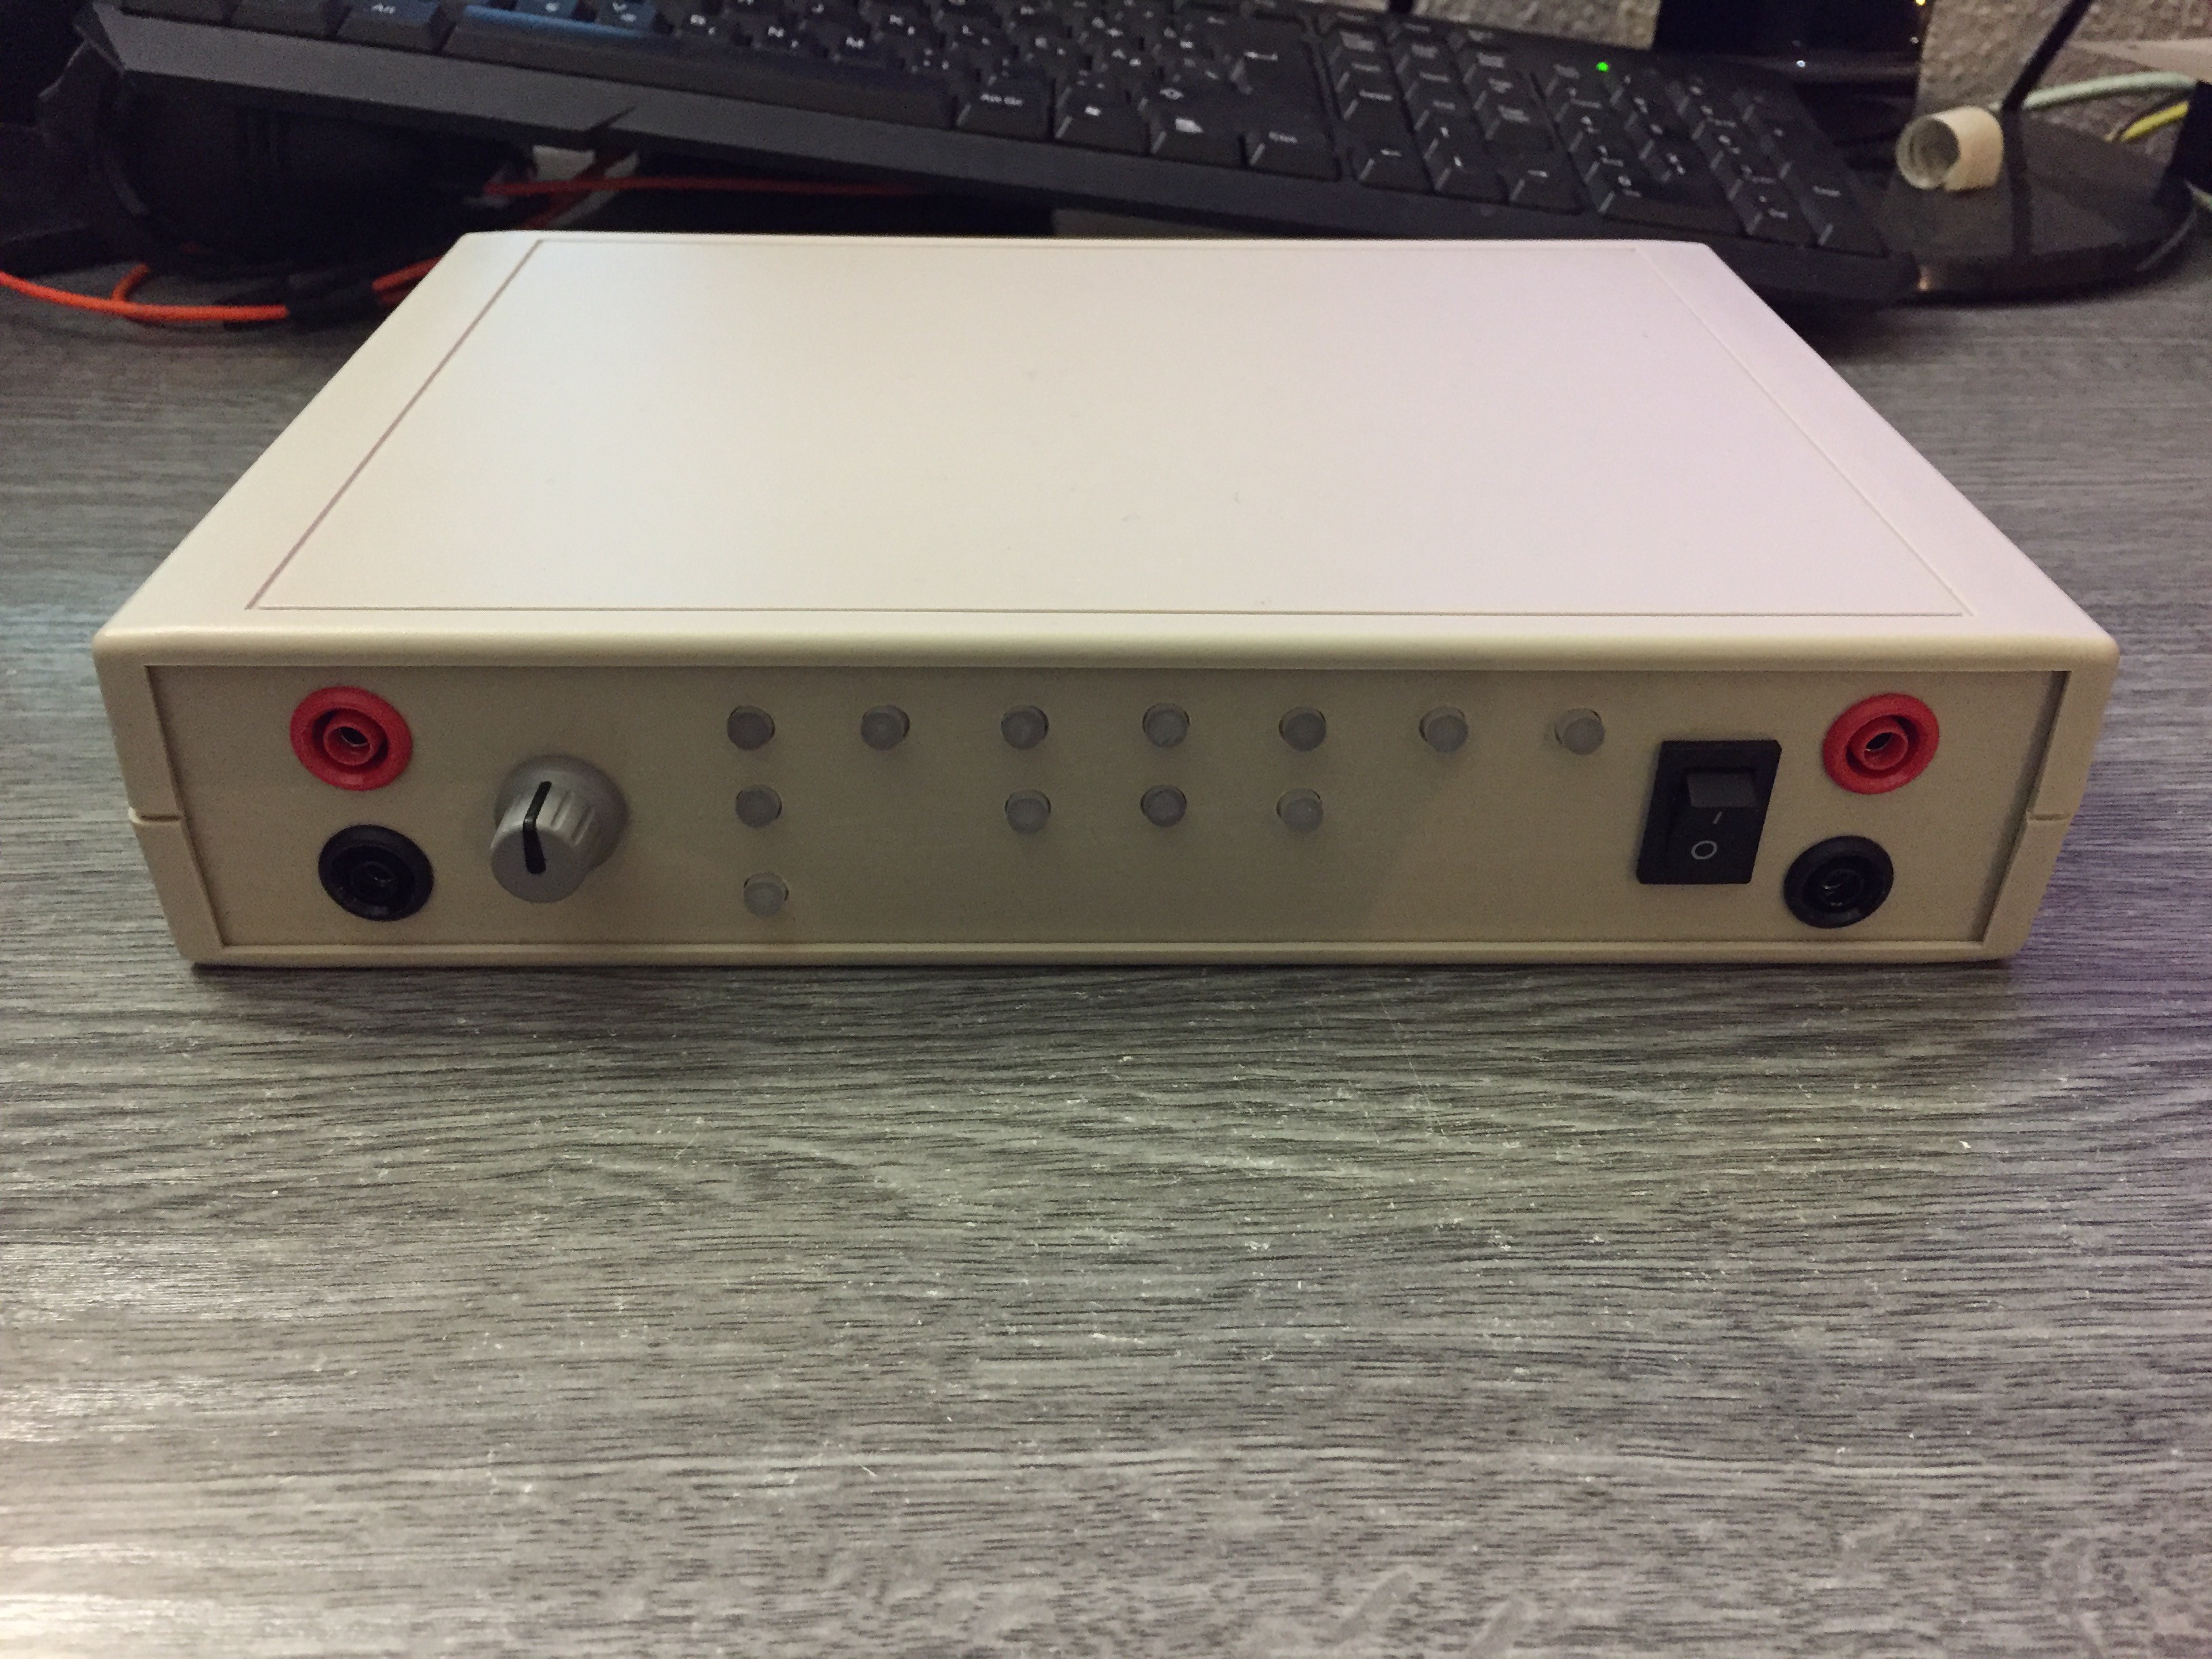
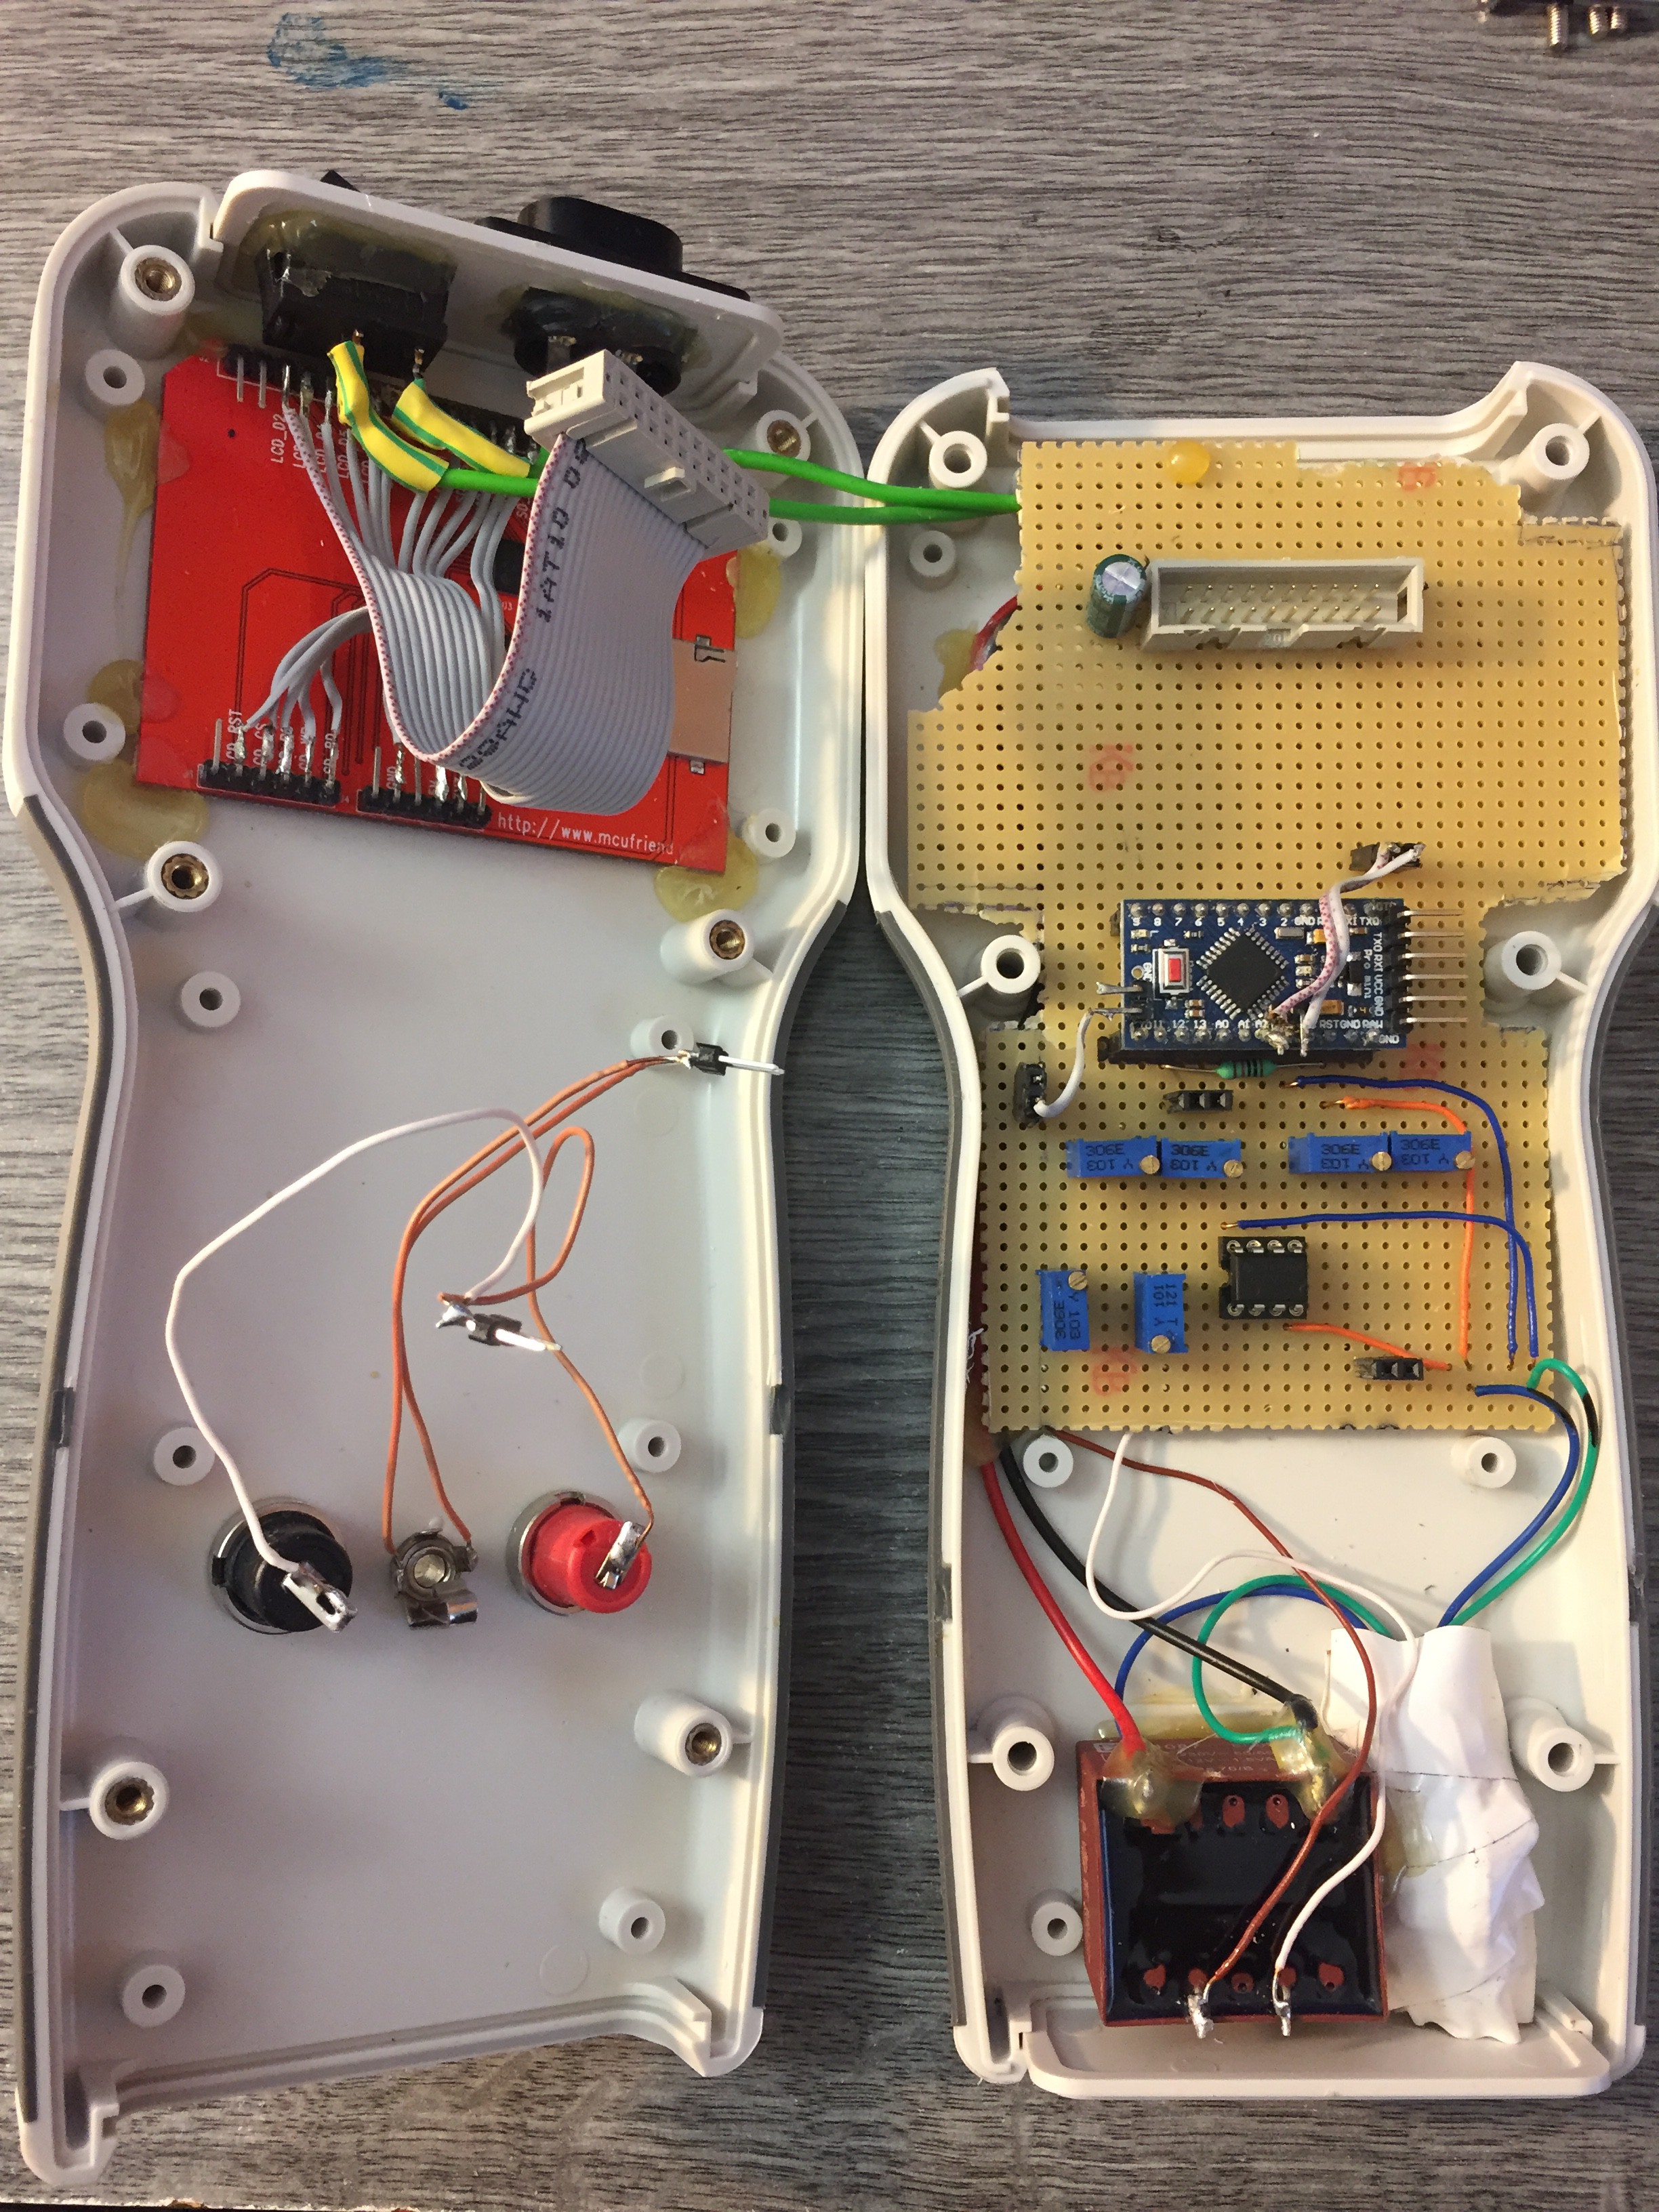
Version 3 is done!
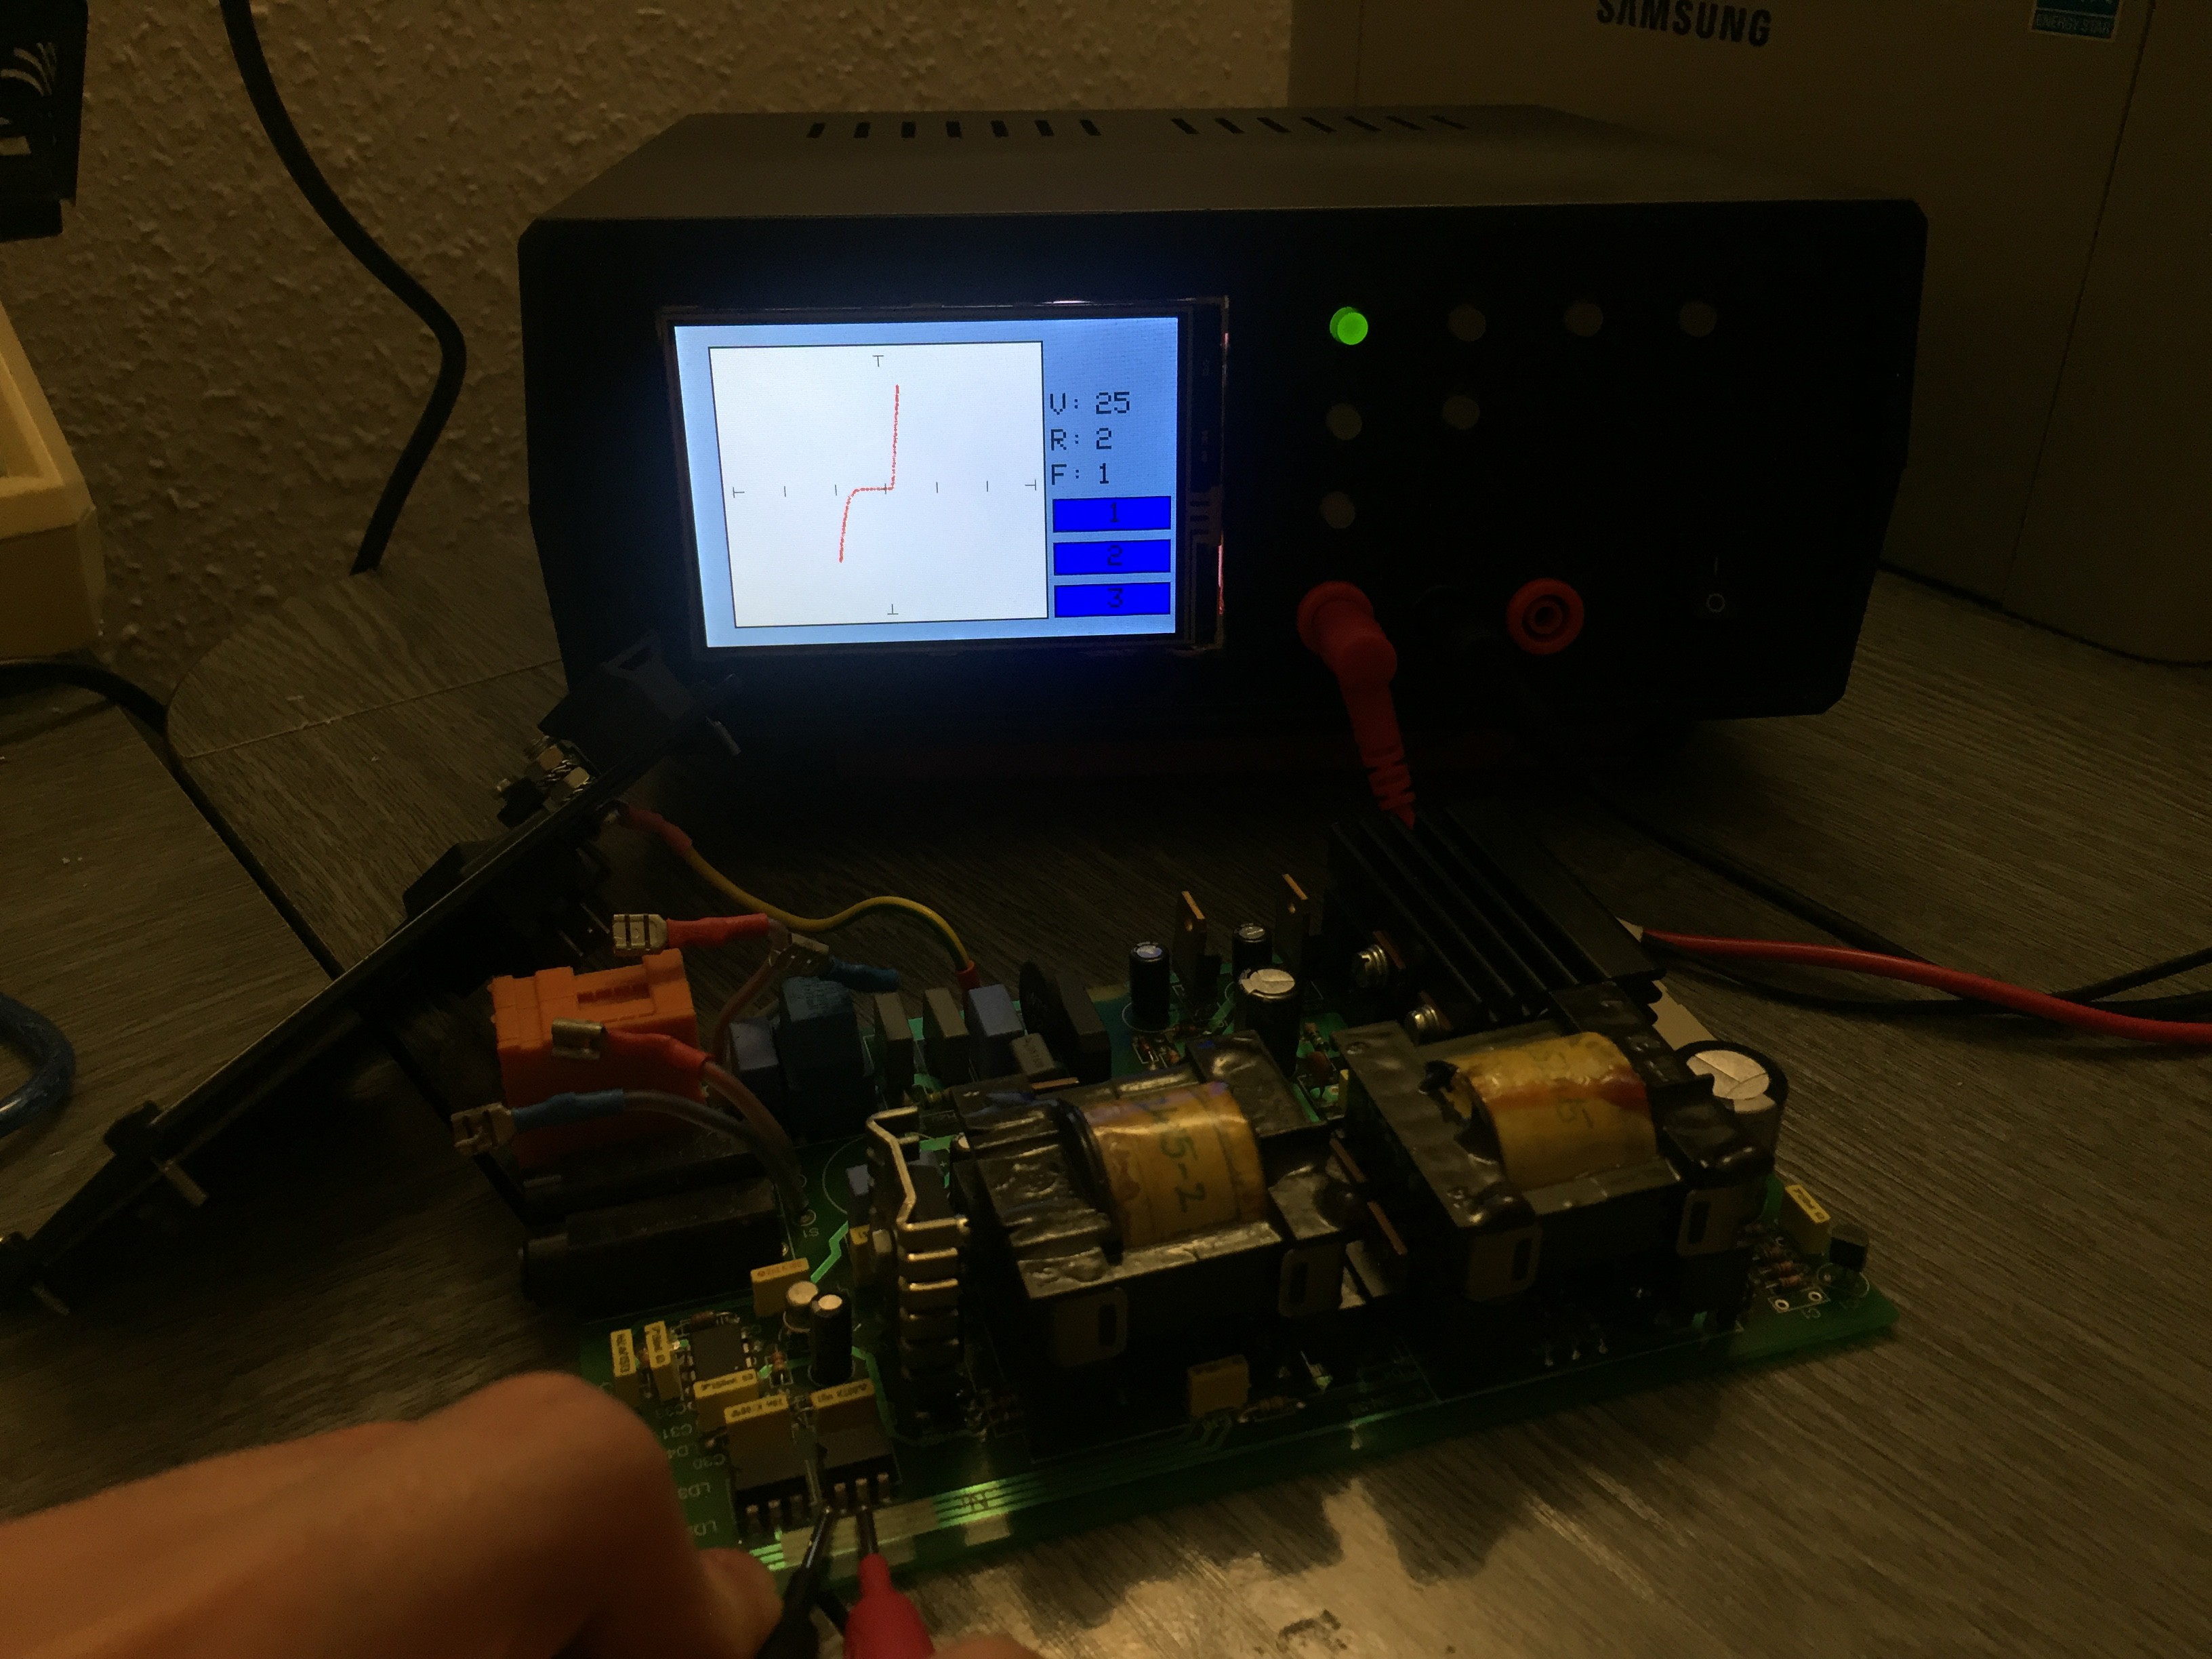
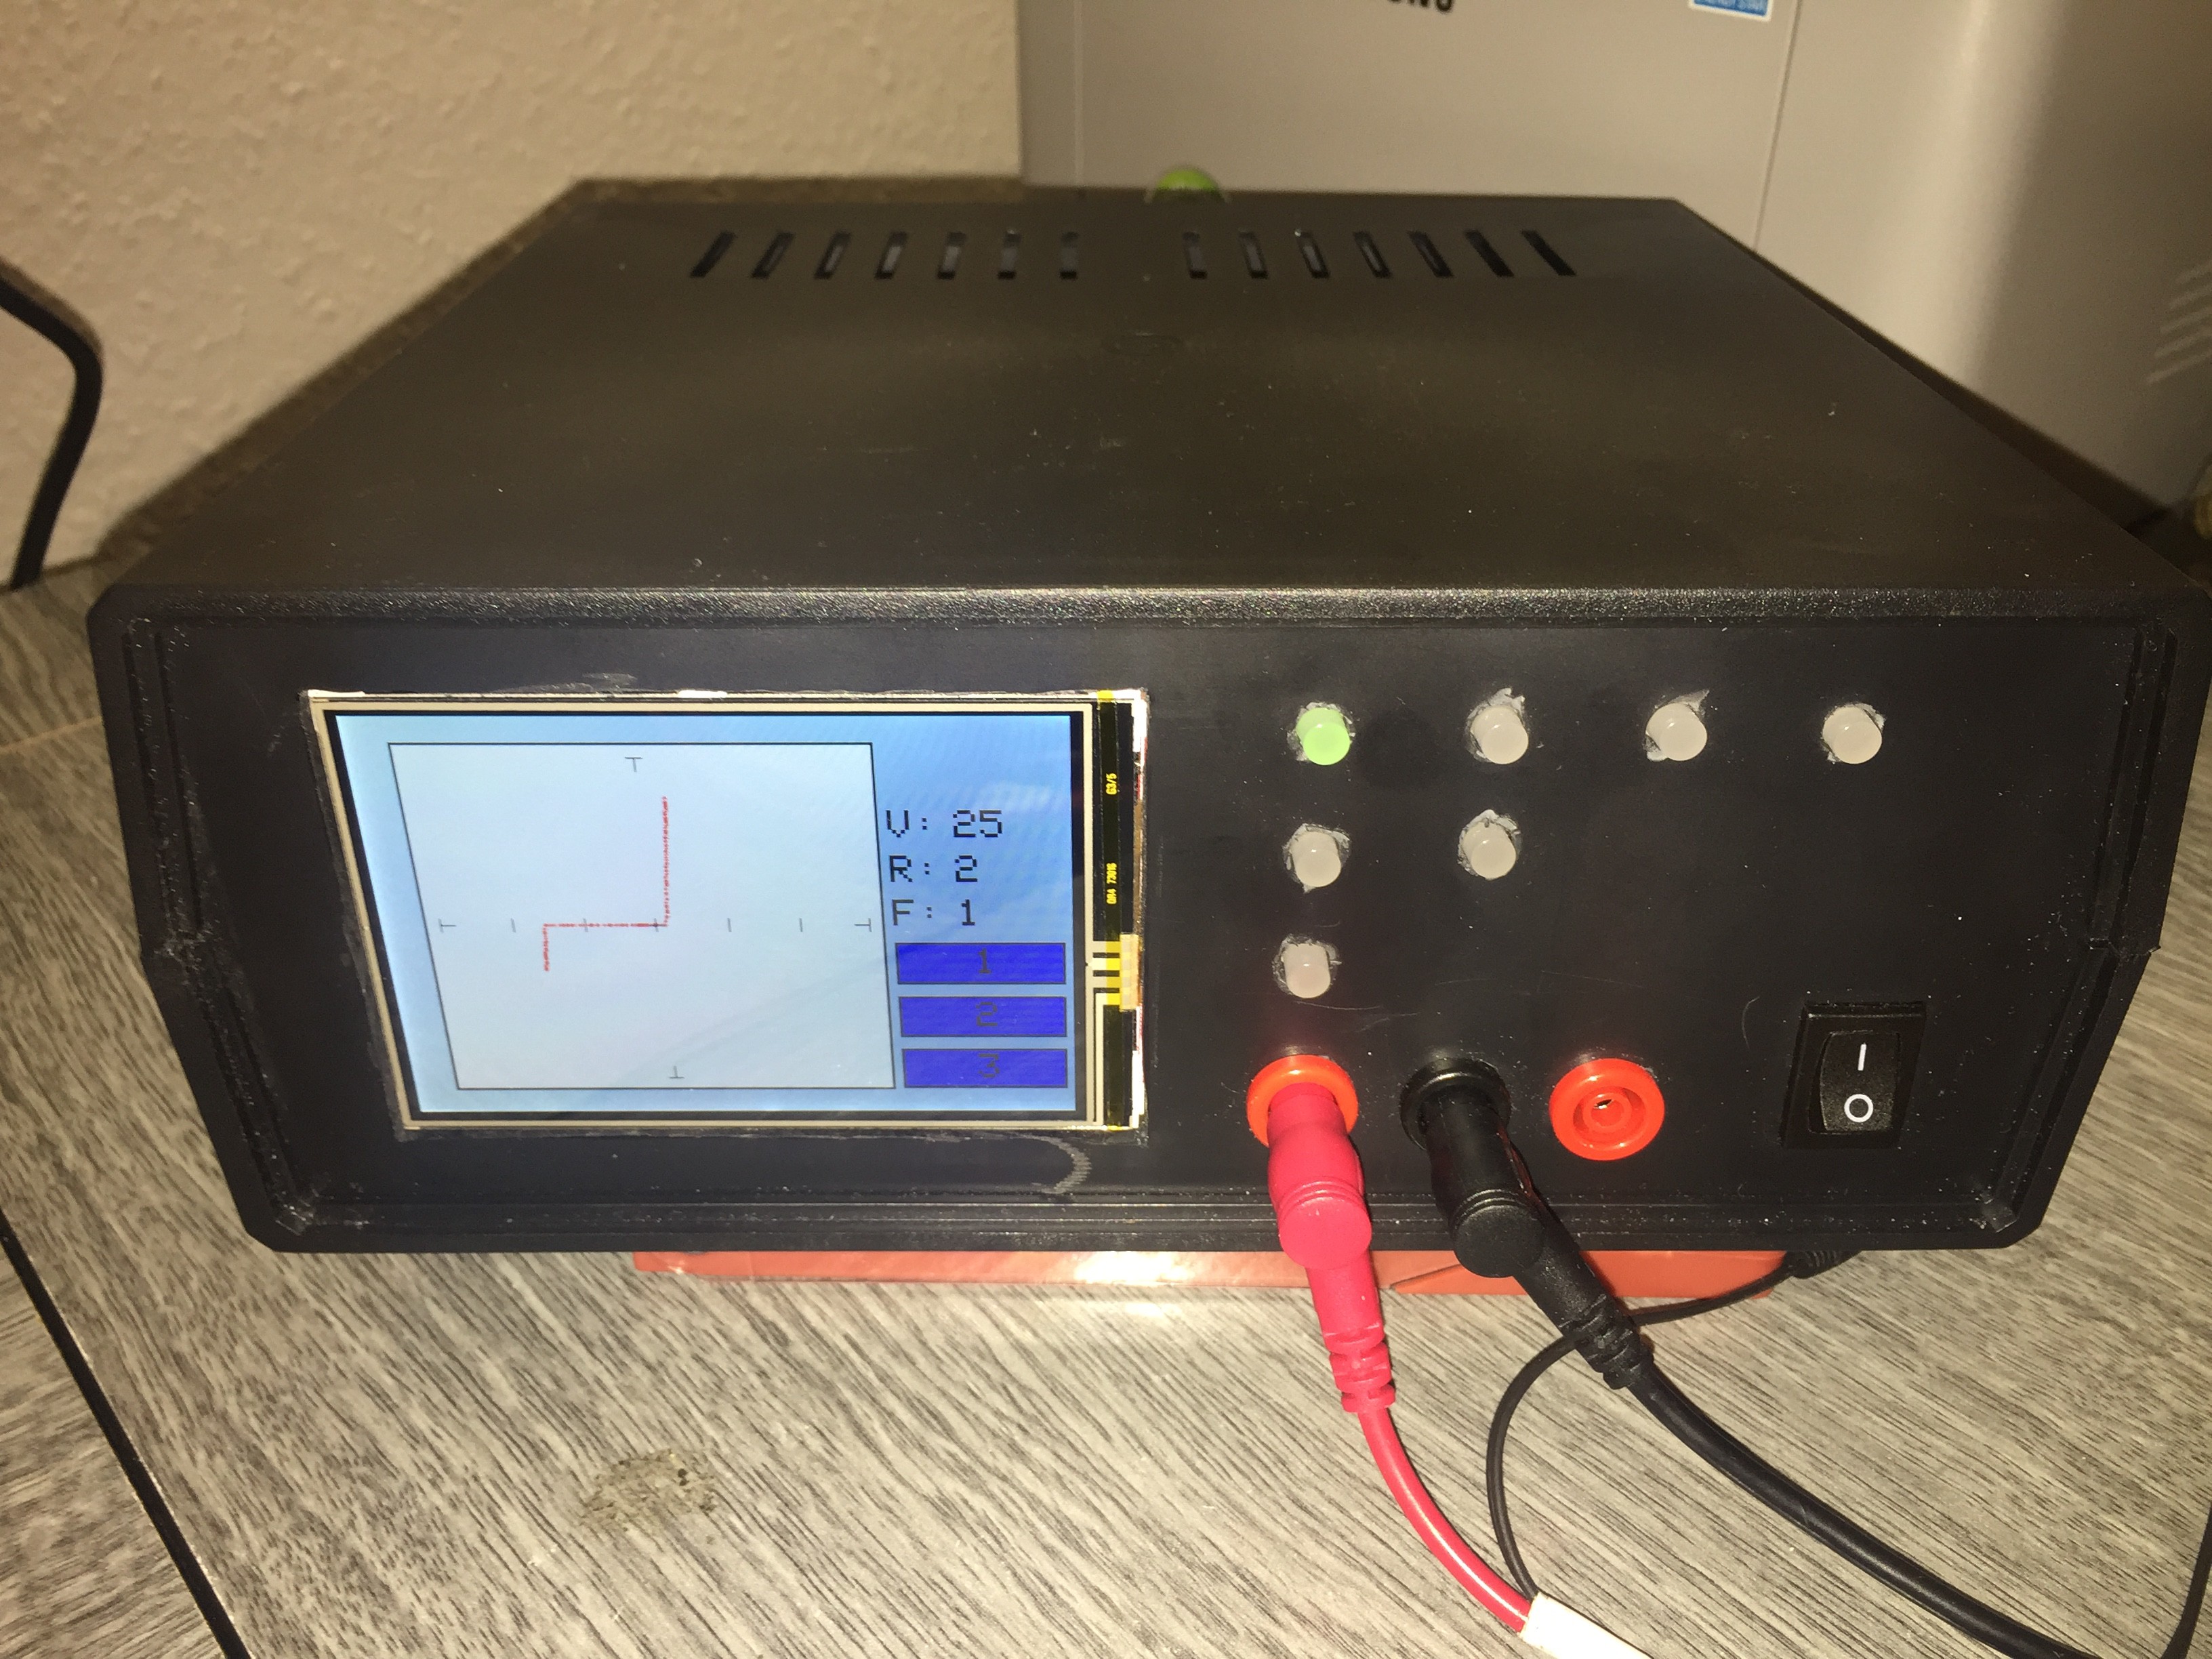
03/18/2018 at 17:07 • 1 commentI finnished the Version 3 prototype, every function is working now. I found tested some future development on it, and I managed to connect it to the PC, so will be also capable of saving curves onto an excel sheat. I need some time and I will finnish the configuration on this also.
Here is a video about every function:
Some picture:


![]()
![]()
![]()
![]()
![]()
![]()

I am quite happy about the prototype, I think it is better then what I expected when I started. Now I have the final circuit so I am looking forfard to designing my own pcb for it.
It still missing the power plug at the end, but I will place it.
-
Version 3 #2
03/15/2018 at 17:39 • 0 commentsHi everyone,
I did some progress on the Version 3 prototype, it has more working function then before. I am still facing with some hardware butg, what I inherit from the Version 2. I found out the original circuit has big issues, because I did not had Oscilloscope when I developed the Vesion 2 I could not see these issues before. The Voltage ranges was messed up. Most of the issues I could fix, but it has still some.
A little bit about the spec:
- 6 Voltage range (6 Current range)
- 6 Frequency range
Ranges 1 2 3 4 5 6 Resistance 250ohm 2k 5k 10k 15k 20k Voltage 0,5V 1,8V 3,3V 6V 8V 10V Current 2mA 0,9mA 0,66mA 0,6mA 0,5mA 0,5mA Output 1mW 1,6mW 2,2mW 3,6mW 4mW 5mW And the video:
-
Version 3 Function test
02/11/2018 at 21:23 • 0 comments -
Version V3 in the final!
02/03/2018 at 21:50 • 0 commentsHi everyone,
I know you are waiting really long time to see how is this project develops. I had a bit of time recently and I could work on the Version 3 electronic development and bulding ass well. It took me a lot of time, to start it, but I am getting ready to finish it in the next 2 week.
Some improvement, I managed to build it a bit smaller then what I thought and it may get smaller with time. Because it is still a prototype, I am building it on a proto board, and after if everything works I will designe a PCB for it.
The improvement was, I managed to get more resolution on the Voltage ranges, but it is not has any big deal in Version 3, because it will be have 6 Voltage range, but if I need in theary it can be handle 255 Voltage range now if it needed. Also if I redo at Version 2 I can use the 255 voltage ranges. :D
Also I would like to improve the frequancy ranges, which has at the moment 6 ranges.
As I mentioned before the Version 3 specification will be:
- 6 Frequancy range between 50Hz and 20KHz
- 6 Resistance range between 47ohm and 25kohm
- 6 Voltage range between 0,2V and 28V peak to peak
Some picture :
![]()
![]()
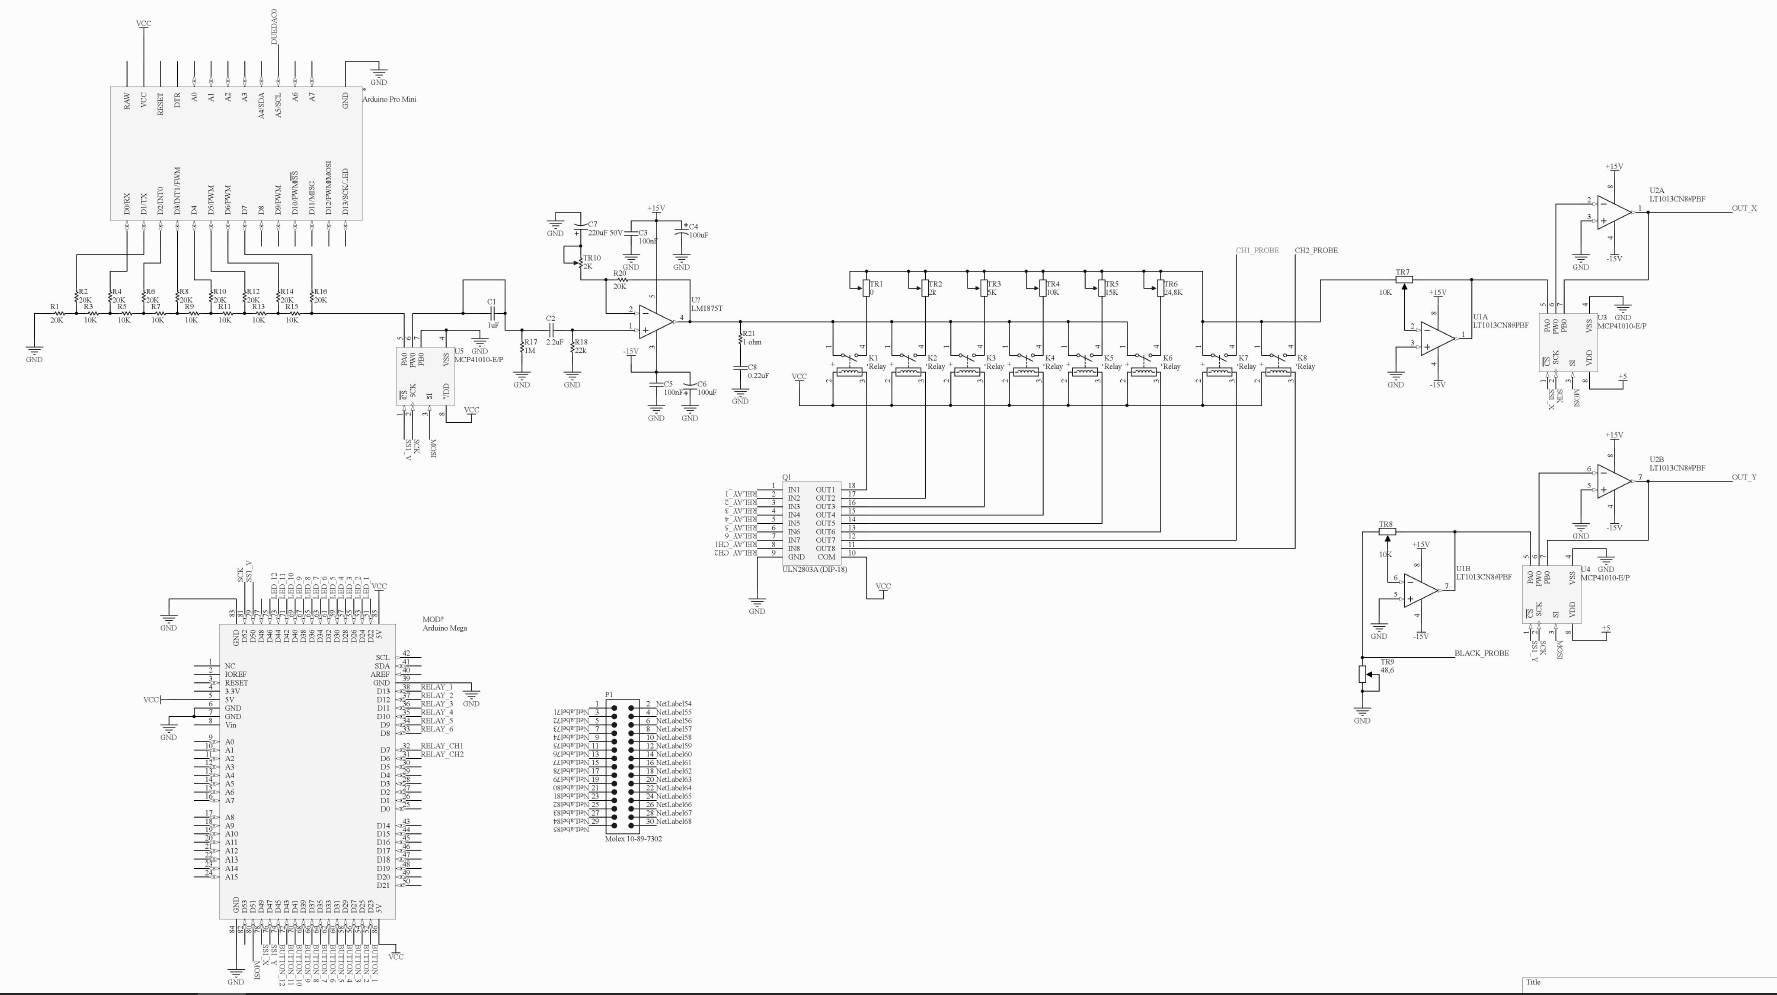
The improved circuit designe:
![]()
-
Version 3 prototype is on the way
07/24/2017 at 19:29 • 0 comments![]()
I started working on the nev version prototype, which will be really simmilar to the Tektronix TR210. For use you will be need an oscilloscope to display the curves.
It will have:
- 2 channel
- 6 voltage ranges
- 3/6 frequancy ranges
- will work both 230V and 110V AC
I still have to finish the pcb designe, and manufacture them.
-
Version 1
06/29/2017 at 17:05 • 0 commentsThe hardware:
It has tree main part, which are:
- Display (2.4" TFT Touch display)
- Arduino pro mini (5V 16Mhz version)
- Analog stage of the curve tracer
![]()
The display has 320x240 pixel resolution, which is perfect for this application. I only use 240x240 pixels for the curves and the other part of the screen is used to show some basic parameter, which is minimum and maximum measured voltage. These two voltage point can show you the break down points on the Zener diode for example.
When I was developing the sketch I was optimistic to use the Arduino pro mini, but end of the project I had to realise it can not handle very well the display functions and at the same time the measure functions. I ran out very quickly of the 2K RAM, so I had to do some optimalisation. In the "final" code I am using half of the program memory and almost 90% of the RAM. On the Pro Mini I had to use almost all digital and analog pin, to make it working.
For power the microcontroller and the display I used a small DC-DC converter, which I not recommend to do, because I figured out it makes a lot of noise. This noise has a very bad effect on the current measurment, that why I do not have a perfectli straight line on the display.
![]() On the picture above you can see I hacked a button on the red probe. That button has a purpose, if you push it when you measure something, the tracer can store that curve into the memory. The stored curve showed on the display as a red curve, and same time you can measure a other component, which you want to compare it.
On the picture above you can see I hacked a button on the red probe. That button has a purpose, if you push it when you measure something, the tracer can store that curve into the memory. The stored curve showed on the display as a red curve, and same time you can measure a other component, which you want to compare it.The software:
Part of the code was from my other project, which was a simple arduino oscilloscope I made. I never thought I can use it for anything usefull, because of the low speed, but for this project it was perfect. I modified to handle two channel, and it worked perfectly.
In this project I did not need any trigger function, because it does not matter where the drawing is starting. It just simple measure 240 point on each channel as fast as can do, and after those stored in two array, it start drawing the dots on the display.
After all this project was successful for me, I learned a lot.
A slow mo video how it works:
Upgrade plans:
In the future I would like to separate the display functions from the measure functions.
I am thinking about to make a function generator for drive the analog section, and then I can change the voltage, frequency and with some other component the resistance, with I can limit the current.
-
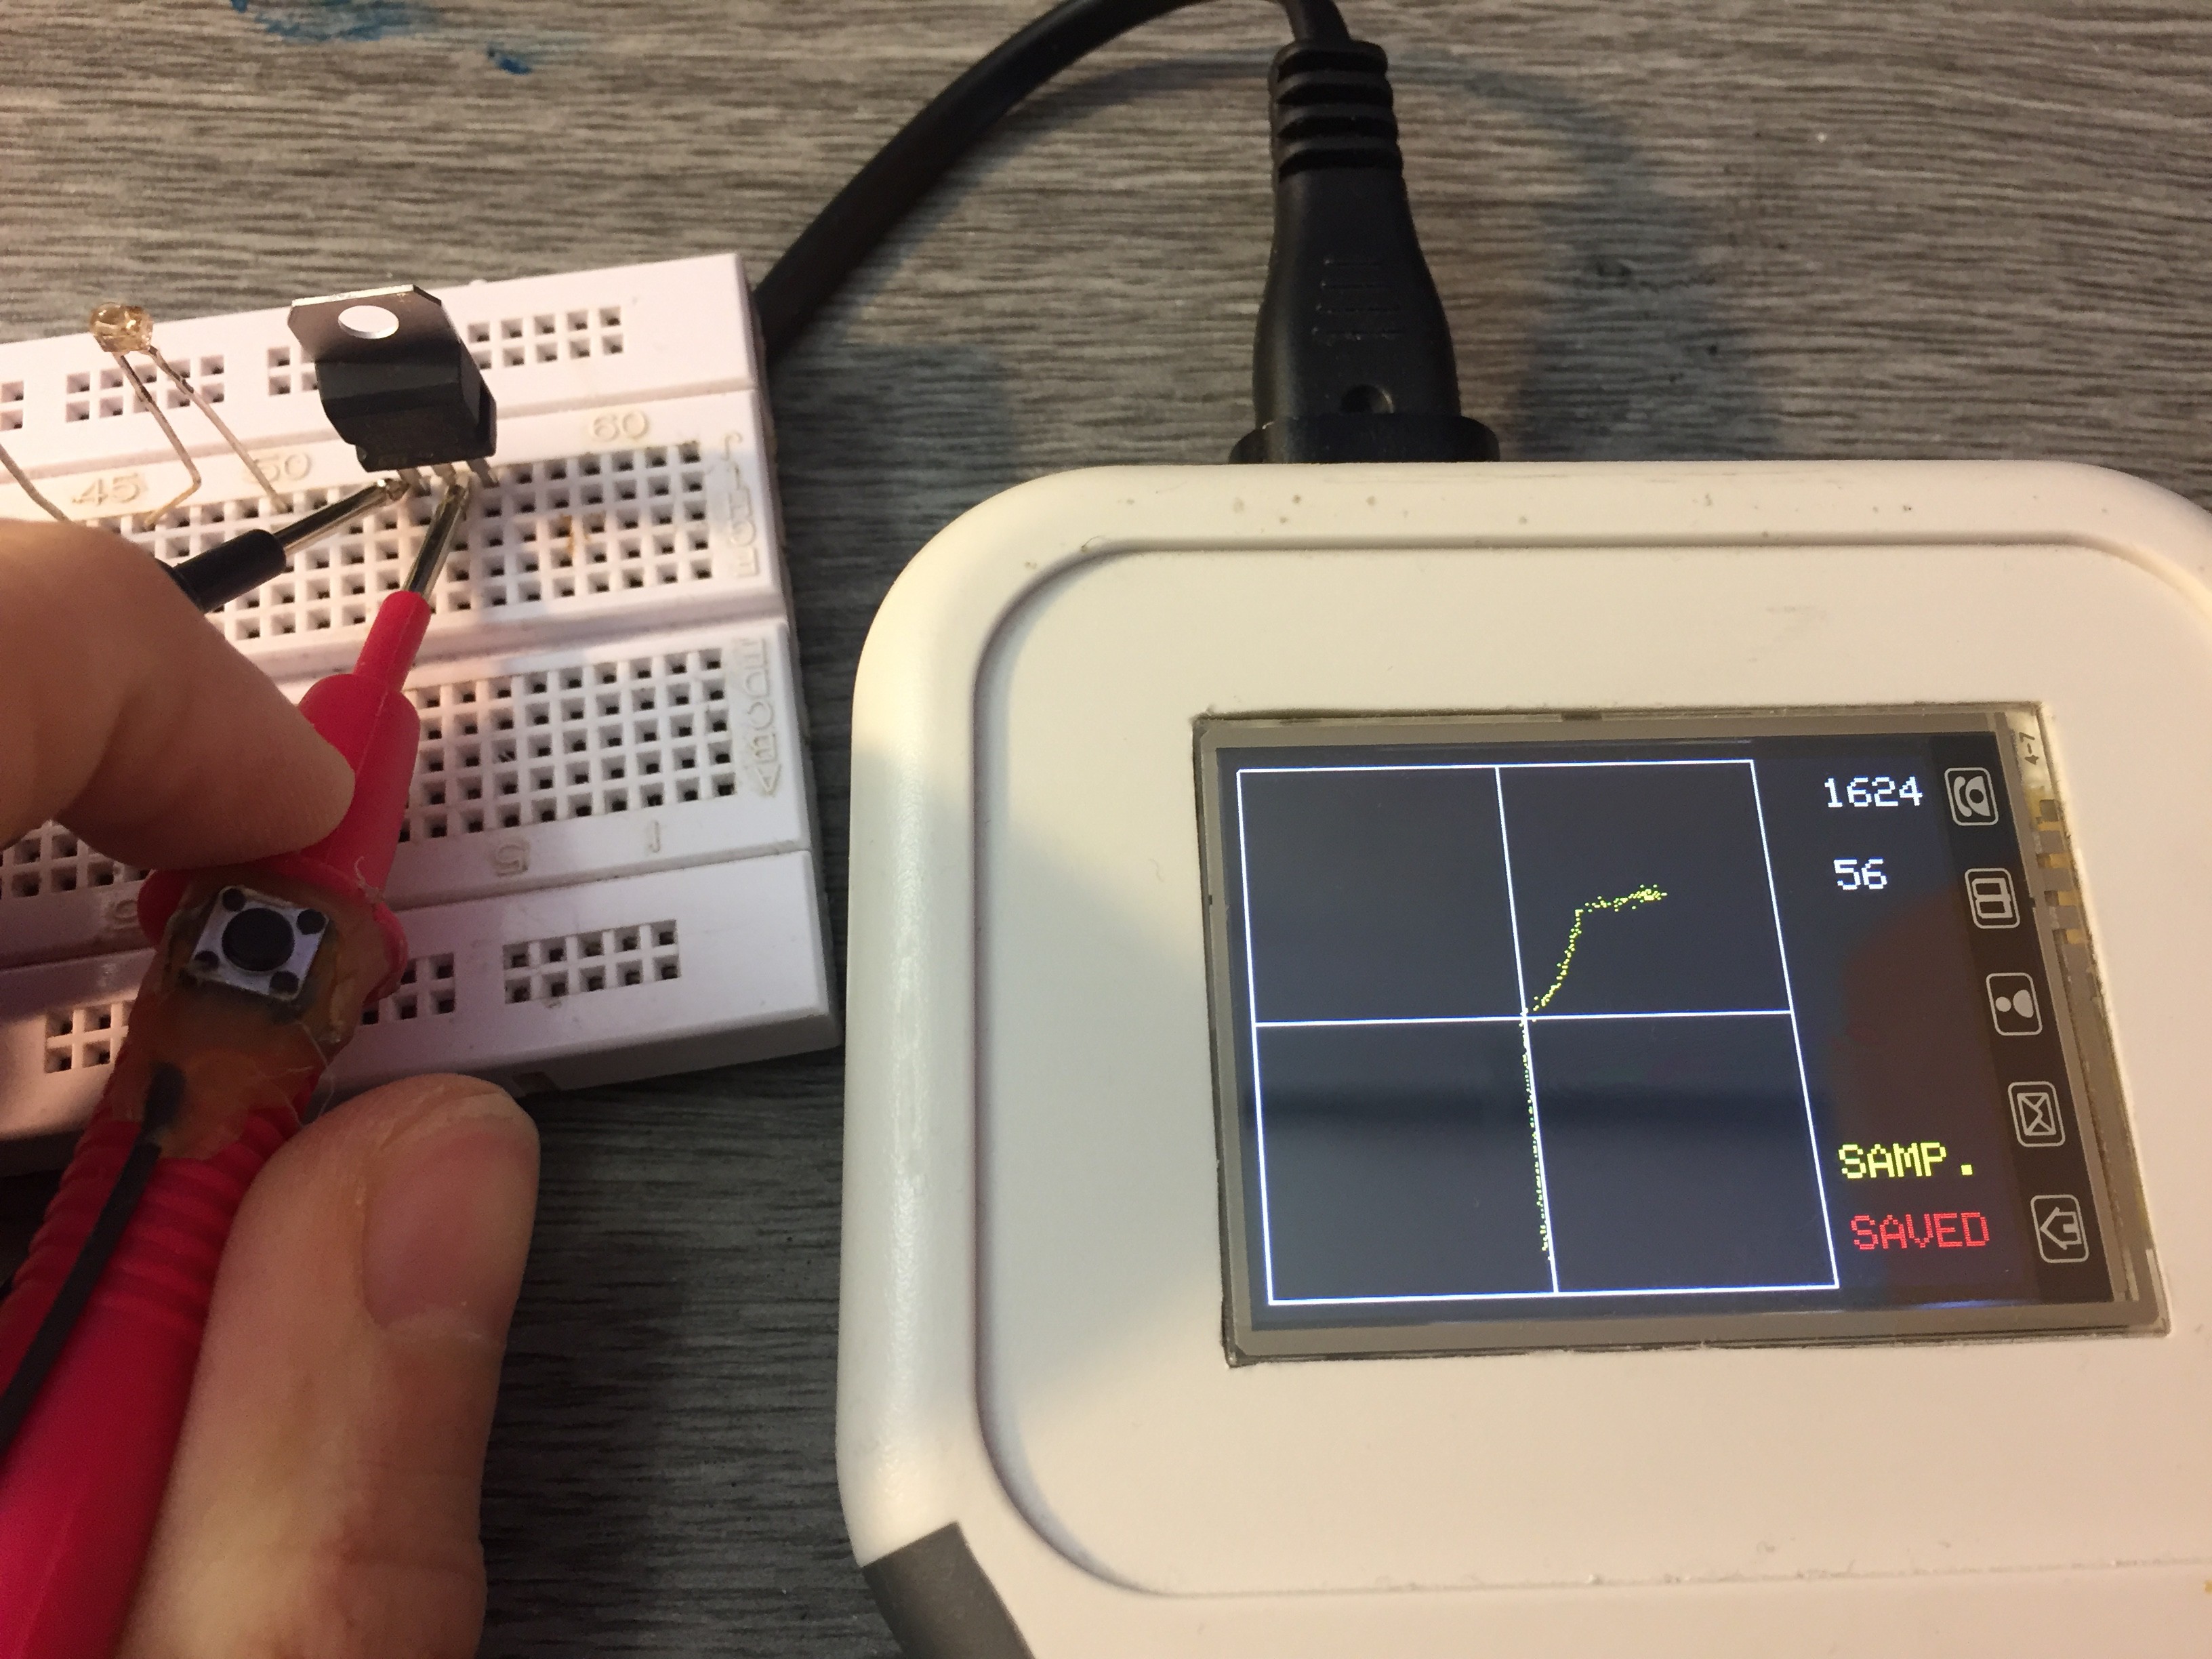
It is working properly
04/19/2017 at 18:03 • 0 commentsI was working on the auto range function on the tracker, and it is working properly now. I can set anything, and the lines now stay stable. It was a the biggest job in this project I think, because I had to do a lot of research about op-amps. After all the programming was a bit difficult, but after I figured the method, is is quite simple.
I did not make a video about the new function, becaus I last video is almost the same, one that changed, the waveform stay steady, whenever the Voltage or Resistance range changed.
The curve tracer now have:
- 25 Voltage range from 1V to 20V peak-peak
- 5 Resistance range (50 , 2k, 10k, 17k, 25k ohm ) I will expend this to 10-15 ranges, it is not to difficult.
- 6 Frequancy range from 120Hz to 1.2kHz I will expand this as well, up to 2kHz, or above.
- USB connection to PC, for save waveforms.
What do not work yet, known bugs:
- Have to press twice the main menu button to go to main menu. (bug)
- Need a front foil, with things printed on it.
- First start up, the auto range function works only, when you go to first in to the Voltage menu
- Have to make full schematic and circuit designe, to send out to the PCB fabricator
- I can make a scanner for the curve tracer, but have to think, wher can I place a connector on the front panel.
So yes I am slowly gettint closer to the end, but every working hours on it, I see more, in this project.
-
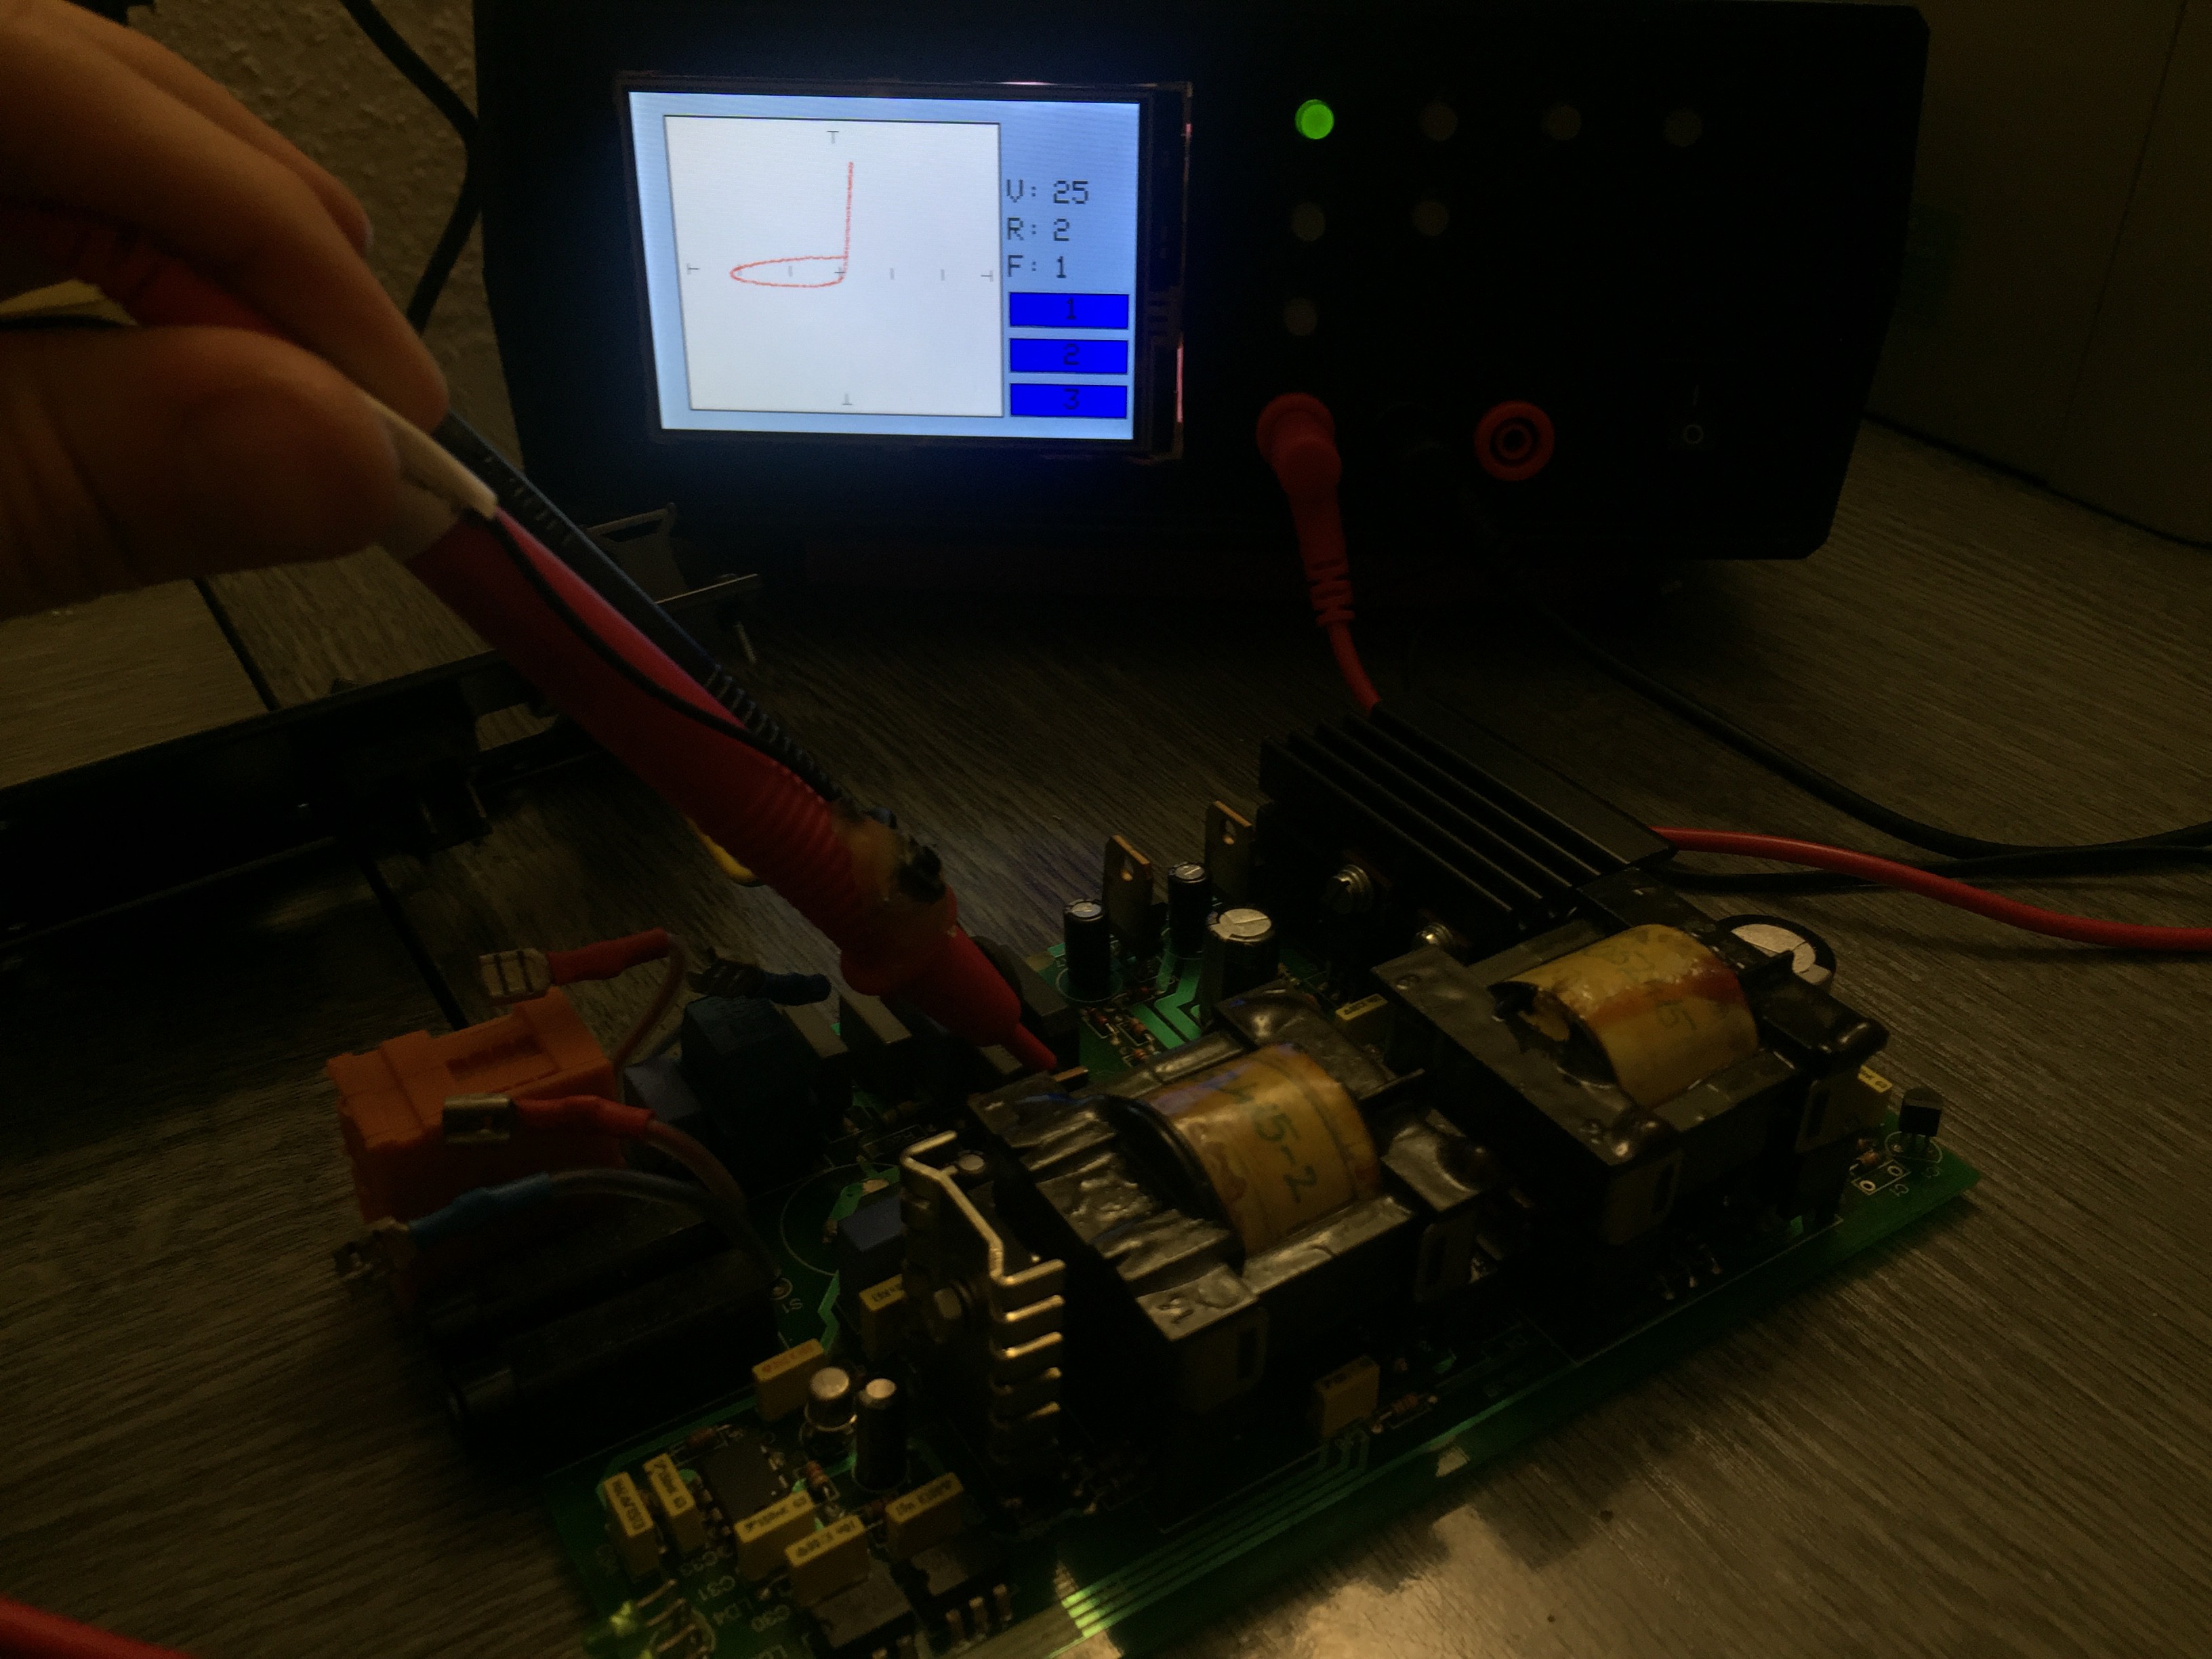
Saving curve to PC
03/26/2017 at 20:33 • 8 comments -
Functioning with 2 channel!
03/13/2017 at 22:12 • 0 commentsIt was not to difficult and not too much work to made the second channel ussable. Whit this I can compare 2 component, and see if those have any different.
I made a little video about how it is works now.
In the video the first test was between a 6.2V zener and a 8.2V zener diode.
In the second test I used a LED and a normal diode.
-
Like a huntron.
03/08/2017 at 21:28 • 0 commentsI have been working hard on the tracker, I built it together, so no more breadboard floating around. I found some problem with the auto ranging circuit, so it is not working yet. I also had to change the rensistance ranges, so in this state I have 5 ranges, but I would like to upgrade to 8 or more, if it is possible. I have to work on a lot of things still, so it is some photo, where is the project now.
![]()
![]()
![]()
Microcontroller based curve tracer
Electronic Curve tracer for measure and compare components on circuit boards