 Josh Villbrandt
In one of our previous posts, we described the back-end architecture that shuffles data to and from the SolarSurfer over the Iridium satellite network. With a database full of vehicle telemetry in place, we now have the ability to build an application with real-time tracking of the SolarSurfer. By the time we launch for the Hawaii trip, we intend to share this application with the public, but for now we've been keeping its address private. The code, however, is publicly available under the SolarSurferCommander repo on GitHub.
Our goal is to allow the widest audience possible to track the SolarSurfer, so we decided to build the app as a web app. The app is written in Javascript and built on the AngularJS framework - the latest craze in application design. Angular is a framework for "single-page apps" which means that the entire web app is downloaded and executed in the client's browser on the first request. Once loaded in the browser, the app is smart enough to update itself with the latest vehicle telemetry directly from the SolarSurferAPI and can display those updates without having to reload the entire page. This is more efficient than the classical web model which entails reloading the entire page (and not just the latest data) with each data request.
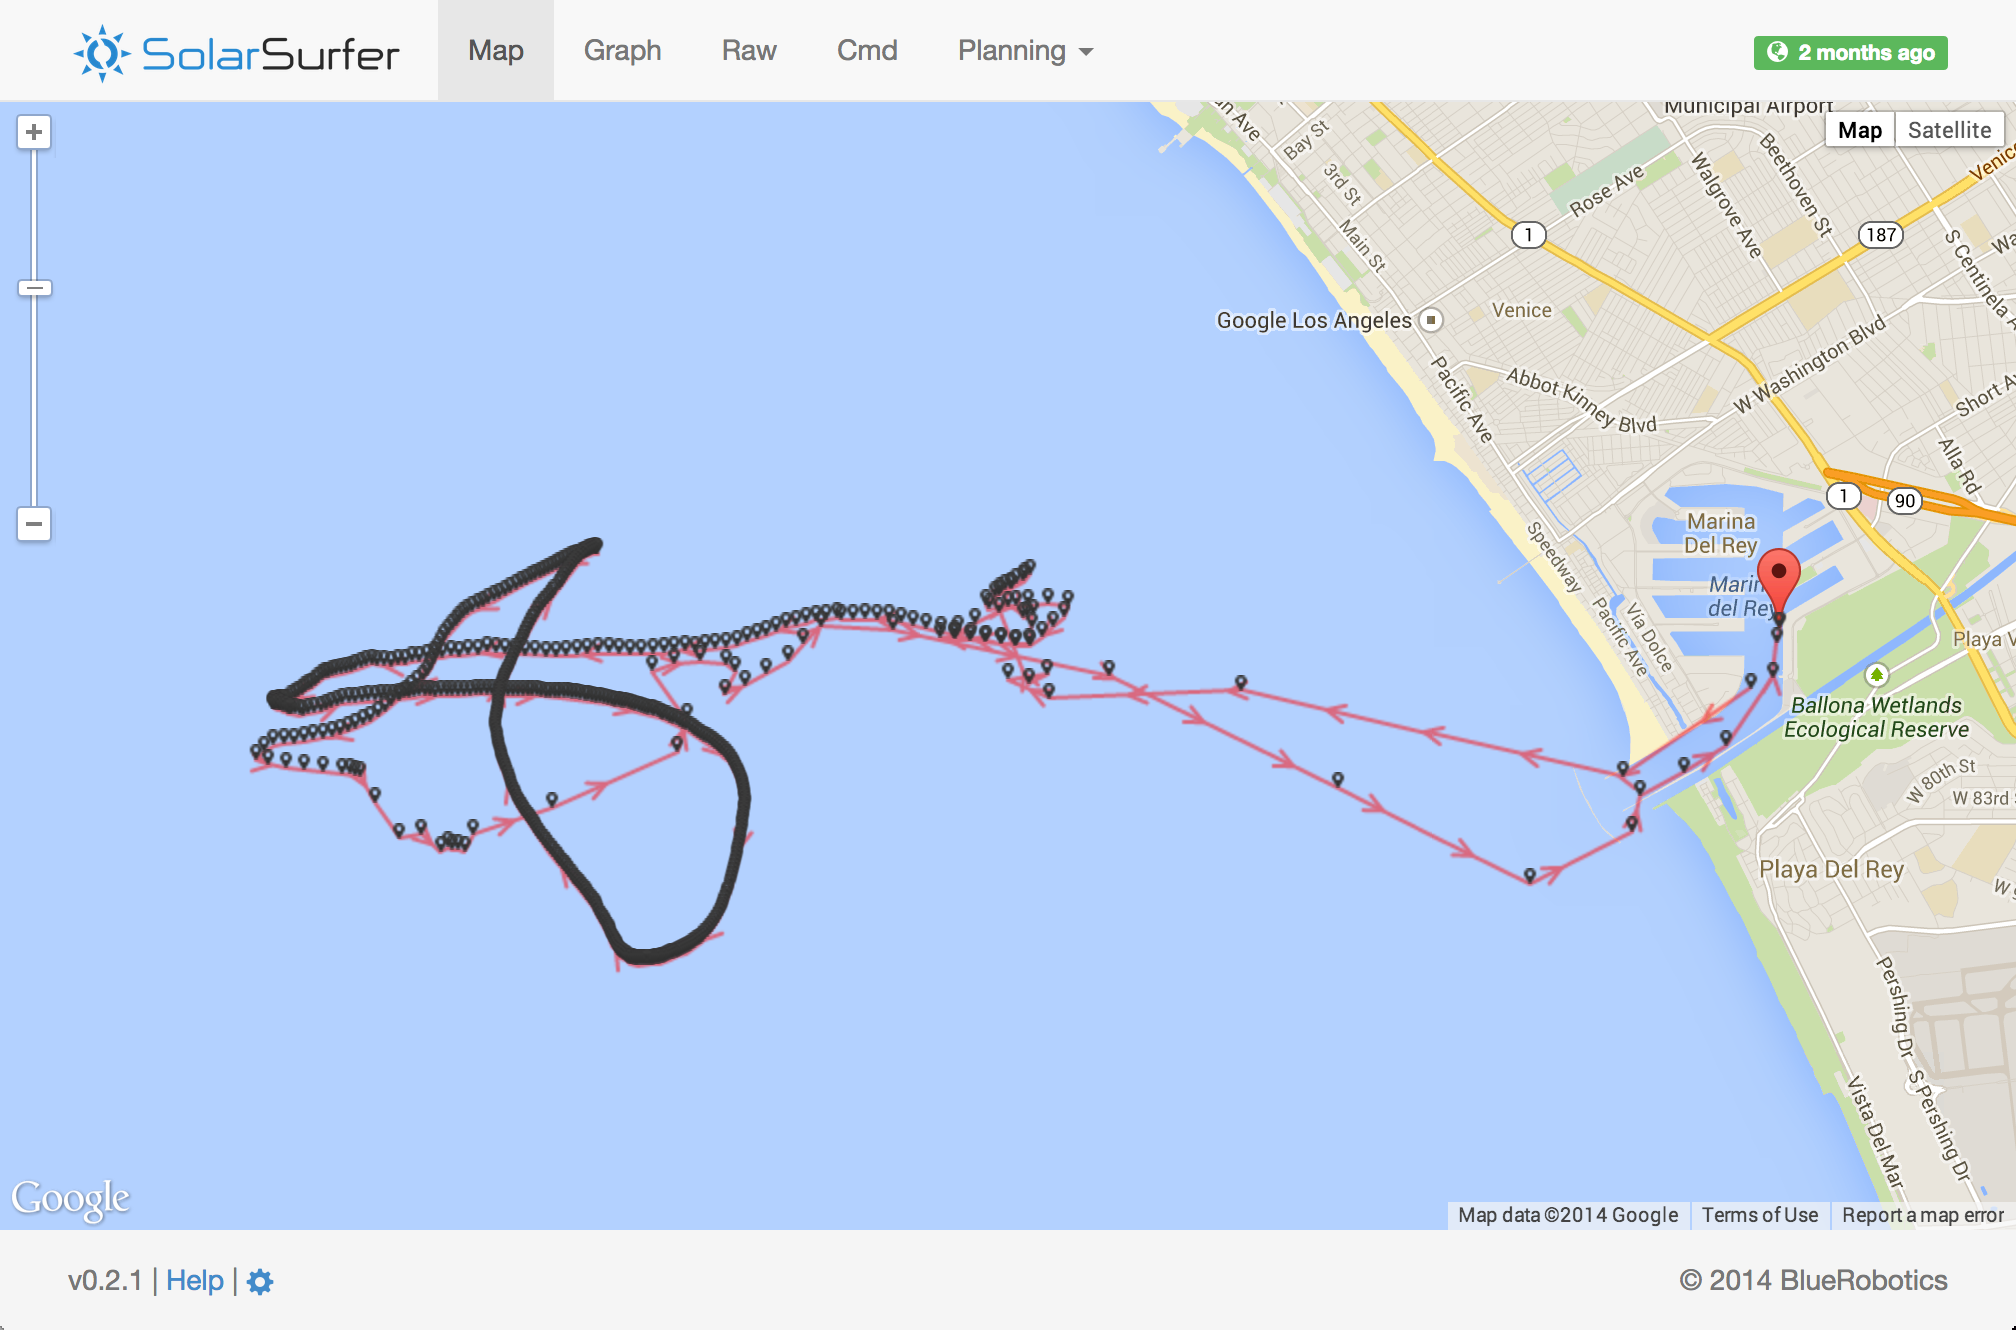
In order to best track the SolarSurfer, the SolarSurferCommander app uses three different widgets to display telemetry. This first a map with a plot of the SolarSurfer location over time (pictured below.) This map also grabs the user's current location in location-enabled browsers and plots that alongside the SolarSurfer. This is helpful for us during Ocean Test No. 3 as we were able to track down the SolarSurfer using the relative location between the two points on the map.
The second widget is a traditional graph / chart widget (we used HighCharts) that allows us to view various parameters over time. We currently have three graphs on the app - a power graph, a navigation graph, and a command and telemetry statistics graph. The power graph (shown below) helps us visualize the thruster power control algorithm with respect the current available sun energy and battery state of charge.
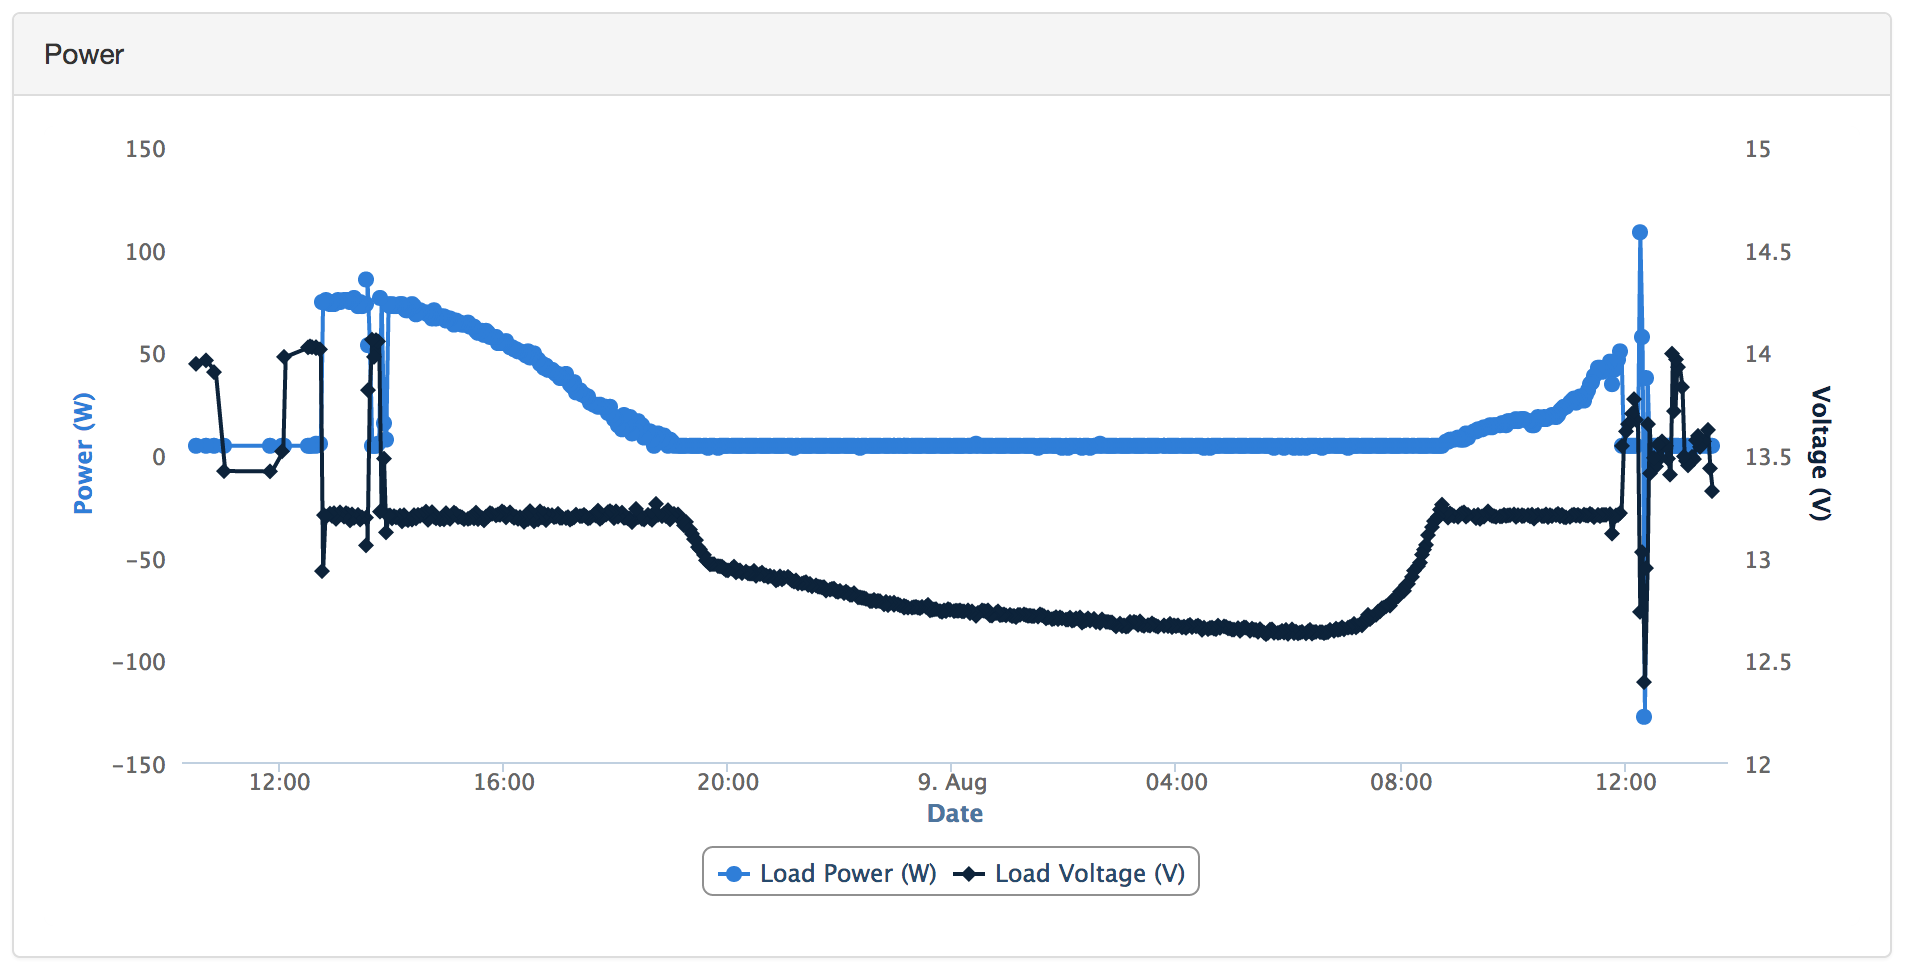
As you can see from the graph, the thrusters are commanded to use less power (shown in blue) as the sun is going down. When the sun finally goes down (thrusters shut off and the blue line becomes flat) the battery slowly starts to drain (shown by measuring the bus voltage in black.) At the beginning of the next day, the sun starts to rise and the battery begins to charge. Once the battery is fully re-charged, the thrusters are allowed to use the excess power shown by the blue line starting to increase again. That's pretty cool if you ask me!
The third widget that we currently employ is a simple text-based output of the latest telemetry message in JSON form. One of the benefits of the SolarSurferMessage package is that it automatically deserializes the raw byte-streams that we send over Iridium, so the telemetry messages from the API are actually in a pretty readable format. Even bitmaps and enums are automatically expanded to human-readable values.
As mentioned, the live version of this tracking app is private at this time. (Although nothing is stopping you from cloning the you could clone the project from github and run it locally) We will soon be refactoring the app as SolarSurferInfographic and we promise to share it with everyone as soon as we do!
Discussions
Become a Hackaday.io Member
Create an account to leave a comment. Already have an account? Log In.