 Craig
CraigFollowing up from our pear experiment
Well unfortunately I was not able to get much of a signal out of measuring a pear. That's a shame because it's one of the fruits we try to harvest in large amounts.
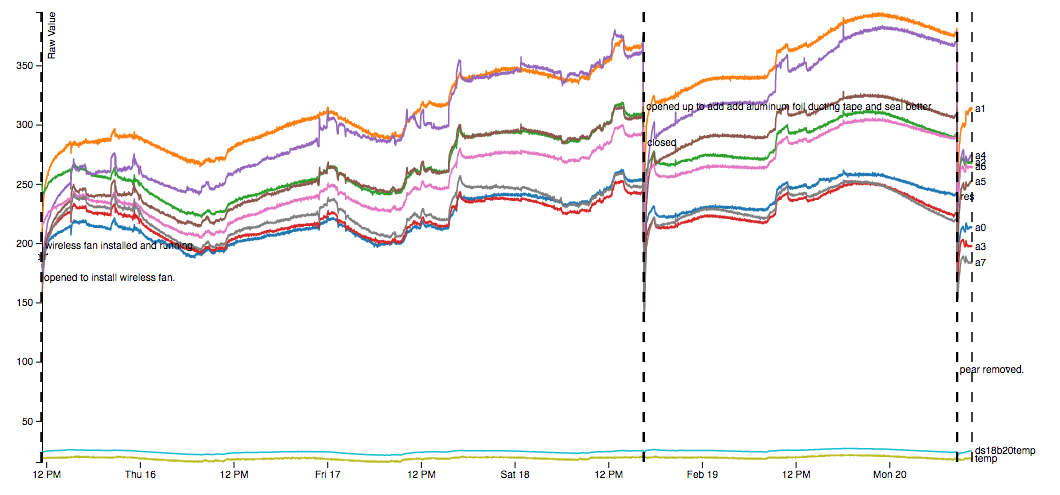
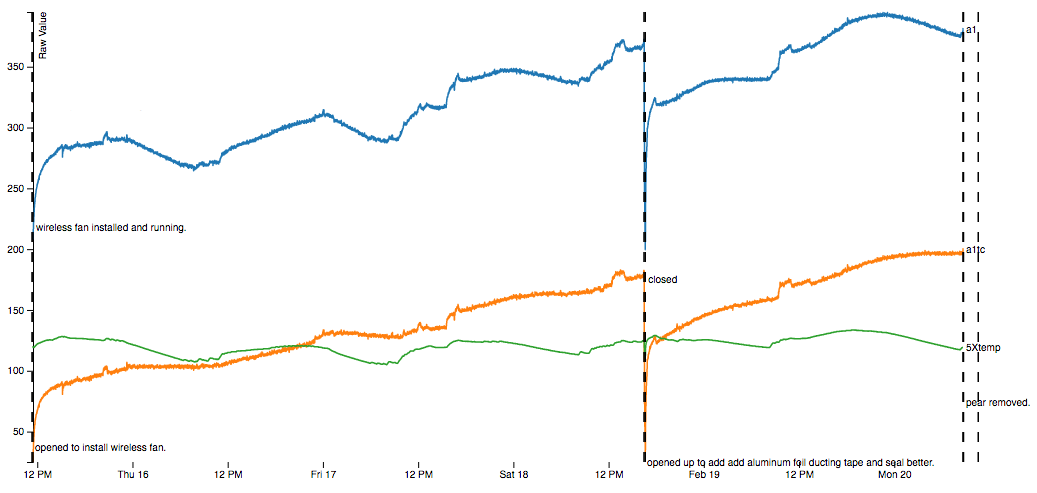
Once I had the chamber somewhat better sealed, this is the best data I was able to get... about 5 days worth. Unfortunately, there's not much of a clear signal here. Stuff is increasing, but it's also got a lot of wander to it and would be hard to determine a GO/NO-GO threshold from this.
There were still sealing issues: a lot of those large spikes appeared when I sat down at my computer next to the sample chamber and this was super frustrating cause I thought I sealed it really damn well.
Two holes, both with o-rings. All the existing holes were covered with the nice aluminum-foil sealing tape that conforms really well. I don't know what else I have to do here... I can sit down and watch the signals slowly start to climb. Very frustrating.
Of the data I got, if we take our strongest signal (A1 -- MQ3 alcohol sensor) and plot it in relation to temperature, we can see a pretty strong relationship:
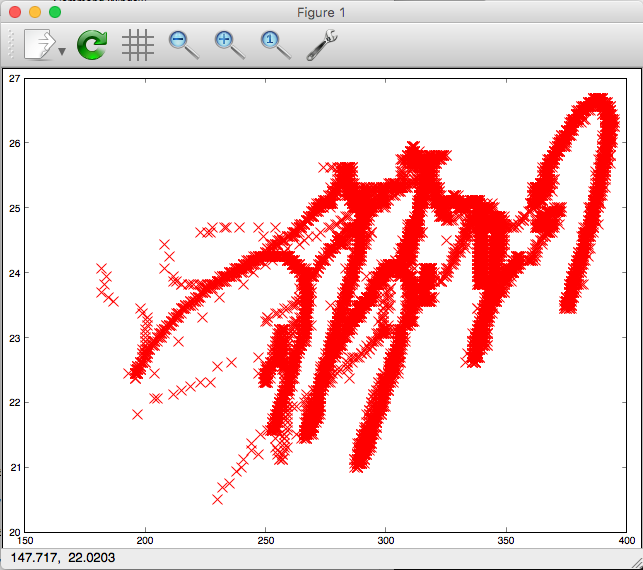
You can see that there are several periods where the data decrease in a linear fashion and then increase in an almost identical fashion. It's sort of like someone is writing the letter 'm' over and over.
Furthermore, these linear relationships all have about the same slope, and I'm saying that's our temperature compensation coefficient:
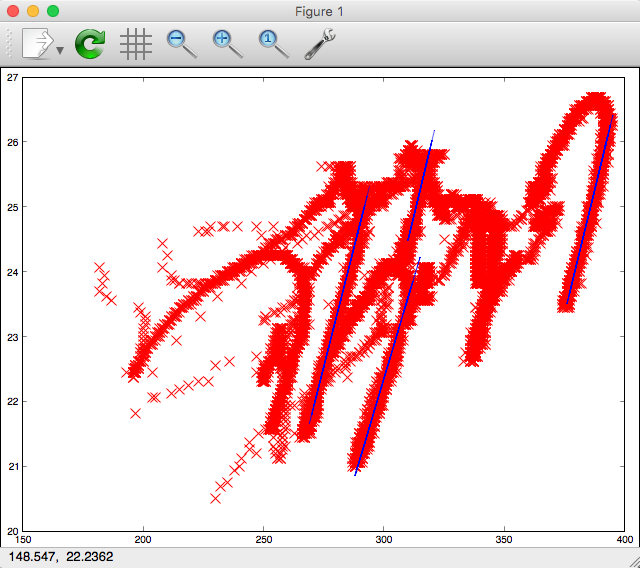
These lines all have a slope between 0.125-0.154. The value I ended up using was 0.1313, but it probably doesn't matter that much.
I'm really trying not to imagine things in the data here. I'm restricting myself to the areas where the sensors decrease and increase along the same linear path because those don't make physical sense with sensing a gas emitted by a fruit but they do make physical sense when considering an oscillating temperature relationship.
Taking our 0.131-ish slope and compensating, we get:
One other thing to note: when I ended this experiment, I took the pear out and tried eating it. It was TOTALLY GROSS. It had absorbed whatever rubber chemicals had volatilized from my big 10-conductor cable and just tasted like sweet weird rubber. It was super disgusting and I couldn't take more than 2 bites and I regret swallowing them. So there's something to be said for a new setup entirely that doesn't use that cable.
Next steps
A bit dejected after this one honestly. My thoughts at this point are to get as much wireless as I can so I can completely self-contain the electronics. Benefits of this:
- No holes need to be cut in the container so we can certain that we're sealing really well
- Can get rid of smelly cables
- Can switch to digital potentiometers for sensor calibration, leading to much more repeatability
Disadavantages:
- Have to make a new circuit board with those potentiometers and mounting for some kind of wifi-enabled microprocessor (ESP32 for instance)
- Have to figure out how to program the ESP32 and deal with level shifting 5V sensor outputs to 3.3V analog inputs and deal with its immature toolchain in general.
- Have to figure out how to supply ~1.5A wirelessly. I really don't have enough EE knowledge to be able to do this yet. Qi chargers/general inductive charges seem to top out in the 500-1000mA area. I guess I could get 3 and put them in parallel?
Discussions
Become a Hackaday.io Member
Create an account to leave a comment. Already have an account? Log In.