 Mike Szczys
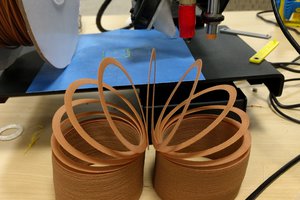
Having built my own midTbot I was interested in generating my own gcode as a fun way to learn how it works. By far the best I've found is the quick gcode tutorials on cnc cookbook. I played a bit, then wrote a Python script that generates the gcode to draw the Seed of LIfe.
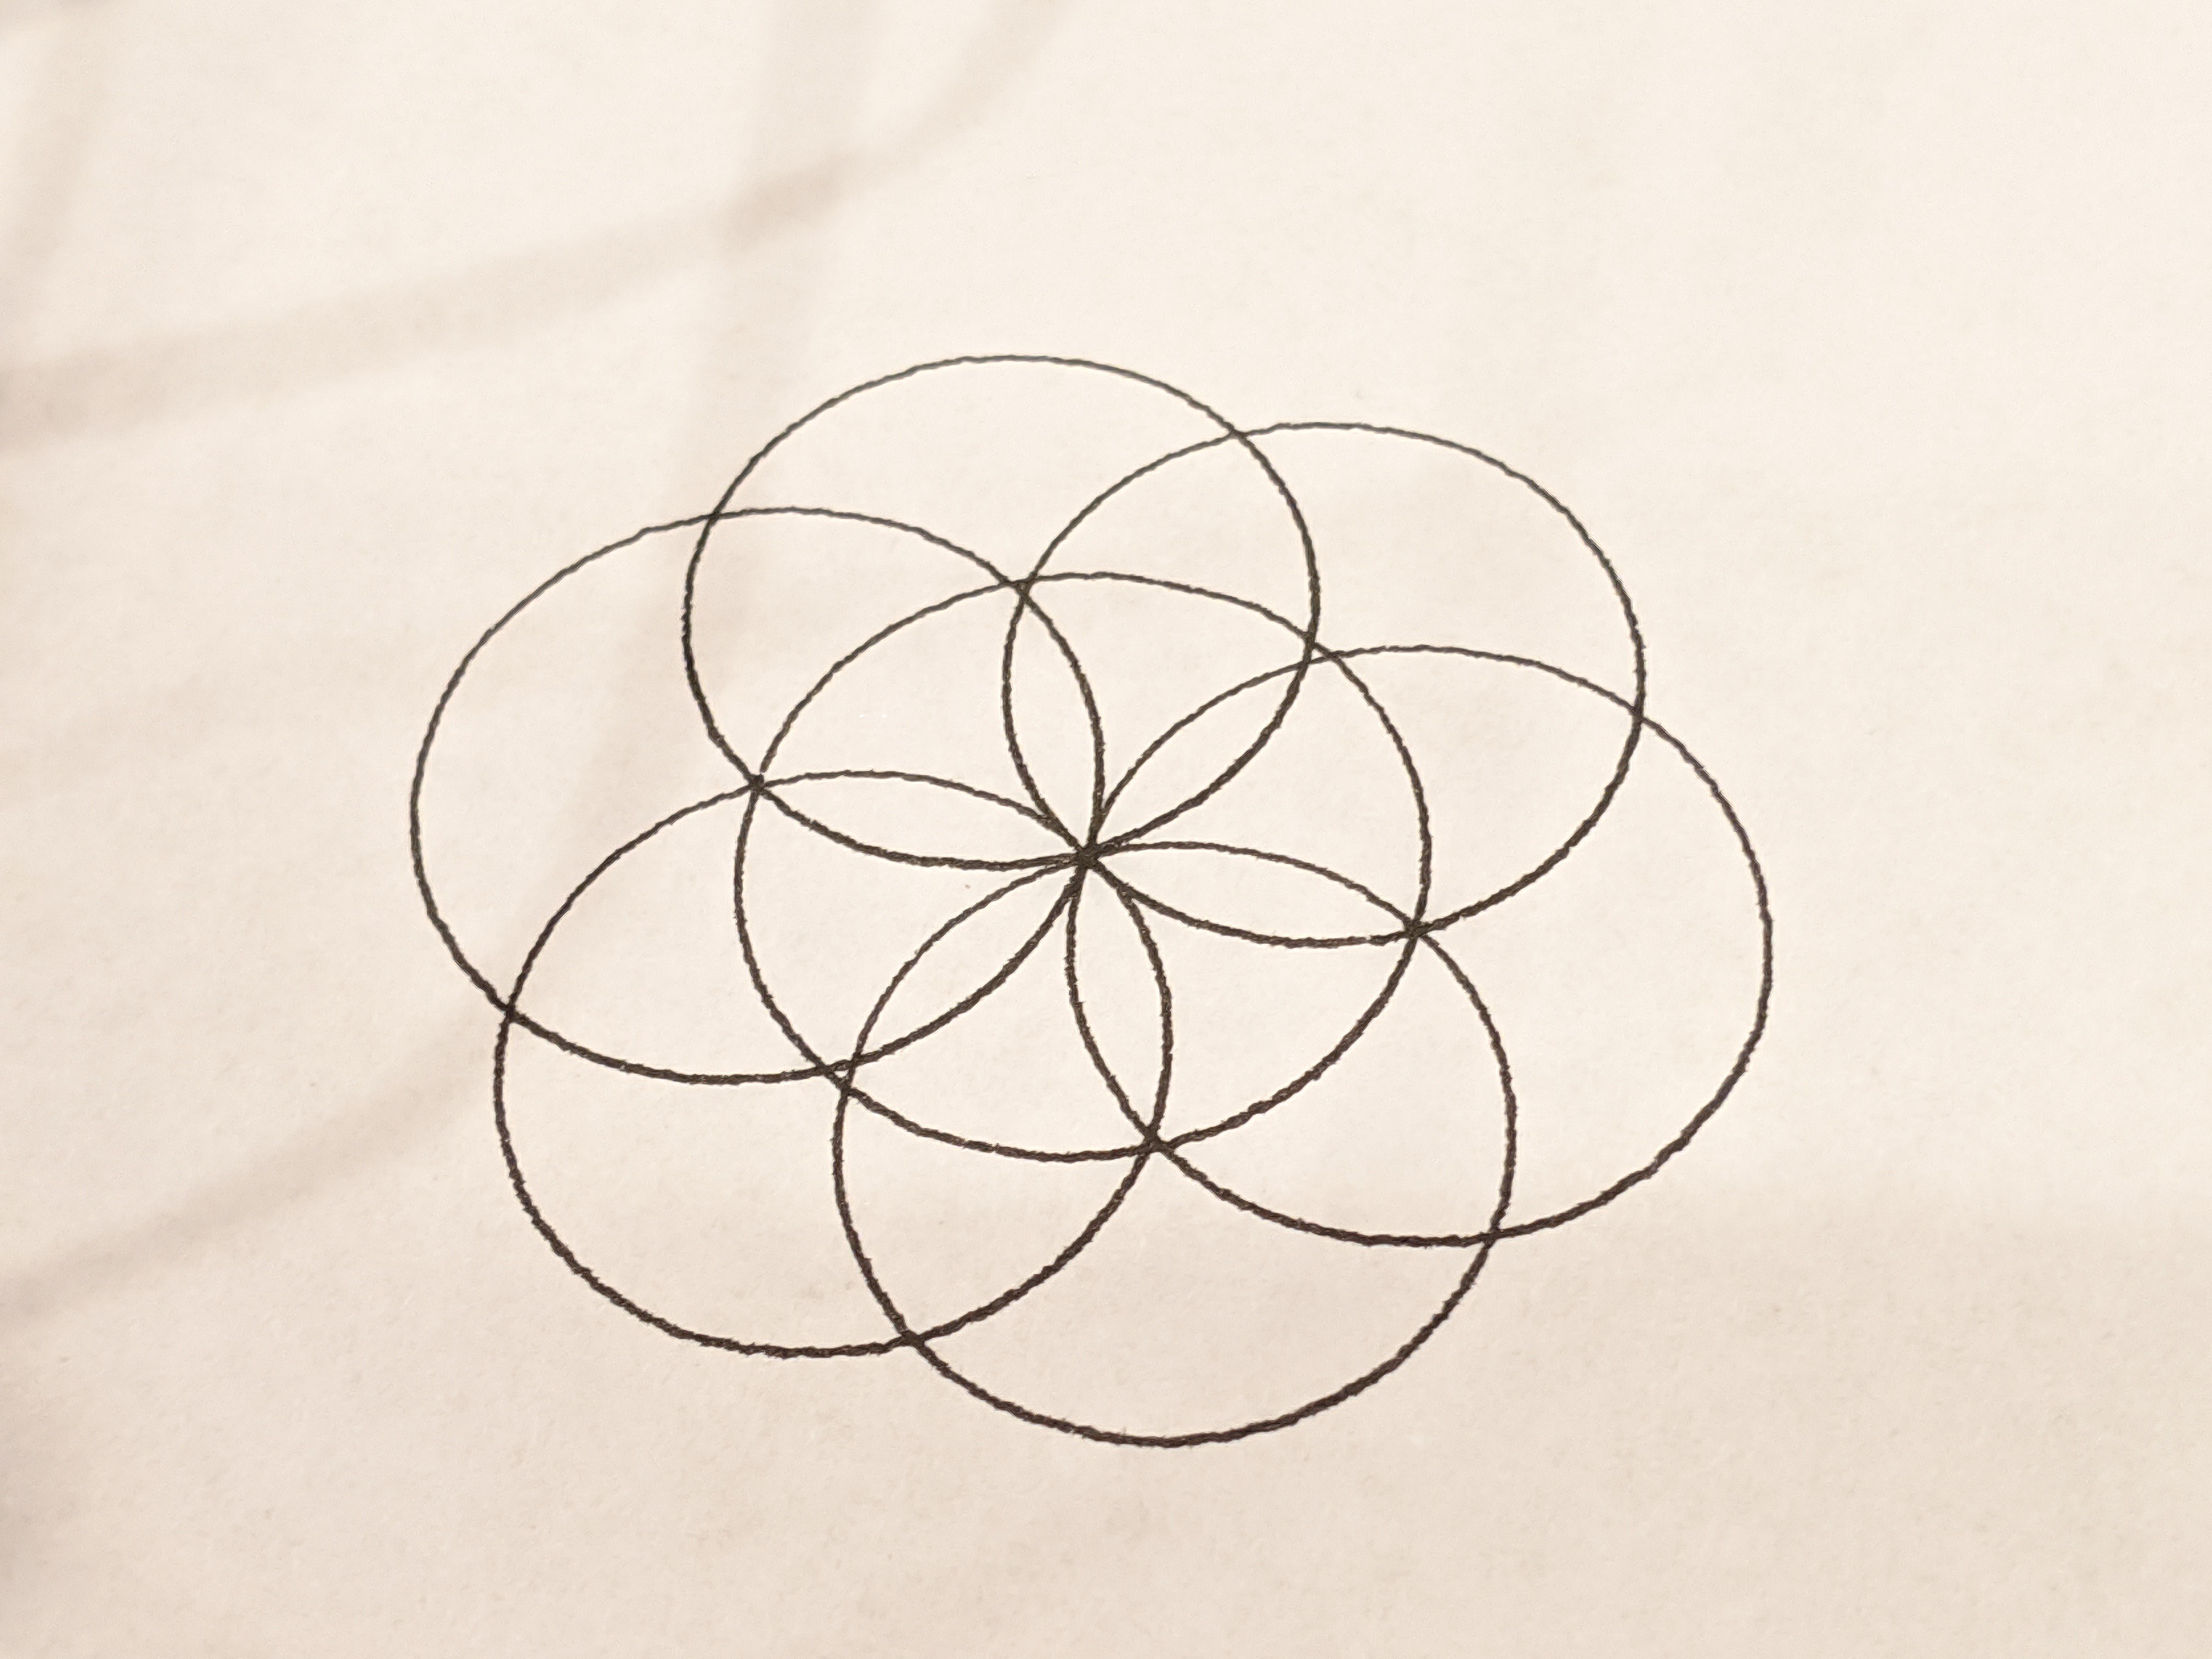
Seed of Life is a pretty good exercise to start with. It uses arcs, and gcode has an arc option based on where the pen is currently located, where the ending point is, and the location of the center of the arc. Seed of Life sets centers defined by a triangle that has the radius as the hypotenus, and 1/2 the radius as the short leg. So calculate the long leg and you have all the info needed for the gocde.
Code is pretty simple:
- G0Z[0..5] lifts and drops the pen
- G0X#Y# moves the pen
- G2X#Y#I#J# draws an ark with:
- Current pen position as starting point
- X#Y# as ending point
- I#J# as pivot point of arc (center of circle) relative to the current pen position.
This is the gcode that drew the image:
G90
G0Z5 F400
G0X70Y90 F4000
G0Z0 F400
G2X70Y90I10J0 F4000

G0Z5 F400
G0X80Y90 F4000
G0Z0 F400
G2X80Y90I10J0 F4000

G0Z5 F400
G0X80Y90 F4000
G0Z0 F400
G2X80Y90I5J8 F4000

G0Z5 F400
G0X80Y90 F4000
G0Z0 F400
G2X80Y90I-5J8 F4000

G0Z5 F400
G0X80Y90 F4000
G0Z0 F400
G2X80Y90I-10J0 F4000

G0Z5 F400
G0X80Y90 F4000
G0Z0 F400
G2X80Y90I-5J-8 F4000

G0Z5 F400
G0X80Y90 F4000
G0Z0 F400
G2X80Y90I5J-8 F4000

G0Z5
G0X0Y0
This is the Python that generated that gcode:
import math

def triangleLongLeg(r):
    #Solve for the long leg of the triangle
    return math.sqrt( (r**2) - ((r/2)**2) )

def circleGcode(penx,peny,centerx,centery):
    print("G0Z5 F%i" % zfeed)
    print("G0X%iY%i F%i" % (penx, peny, xyfeed))
    print("G0Z0 F%i" % zfeed)
    print("G2X%iY%iI%iJ%i F%i" % (penx, peny, centerx, centery, xyfeed))
    print("")

x = 80
y = 90
r = 10

zfeed = 400
xyfeed = 4000

#Calculate Centers:
centers = list()
longleg = triangleLongLeg(r)

centers.append([x,y])
centers.append([r,0])
centers.append([(r/2),longleg])
centers.append([0-(r/2),longleg])
centers.append([0-r,0])
centers.append([0-(r/2),0-longleg])
centers.append([(r/2),0-longleg])

#Generate the gcode
print("G90") #Set absolute mode
points = centers[0]
circleGcode(points[0]-r,points[1],r,0)
for points in centers[1:]:
    circleGcode(centers[0][0],centers[0][1],points[0],points[1])
print("G0Z5")
print("G0X0Y0")
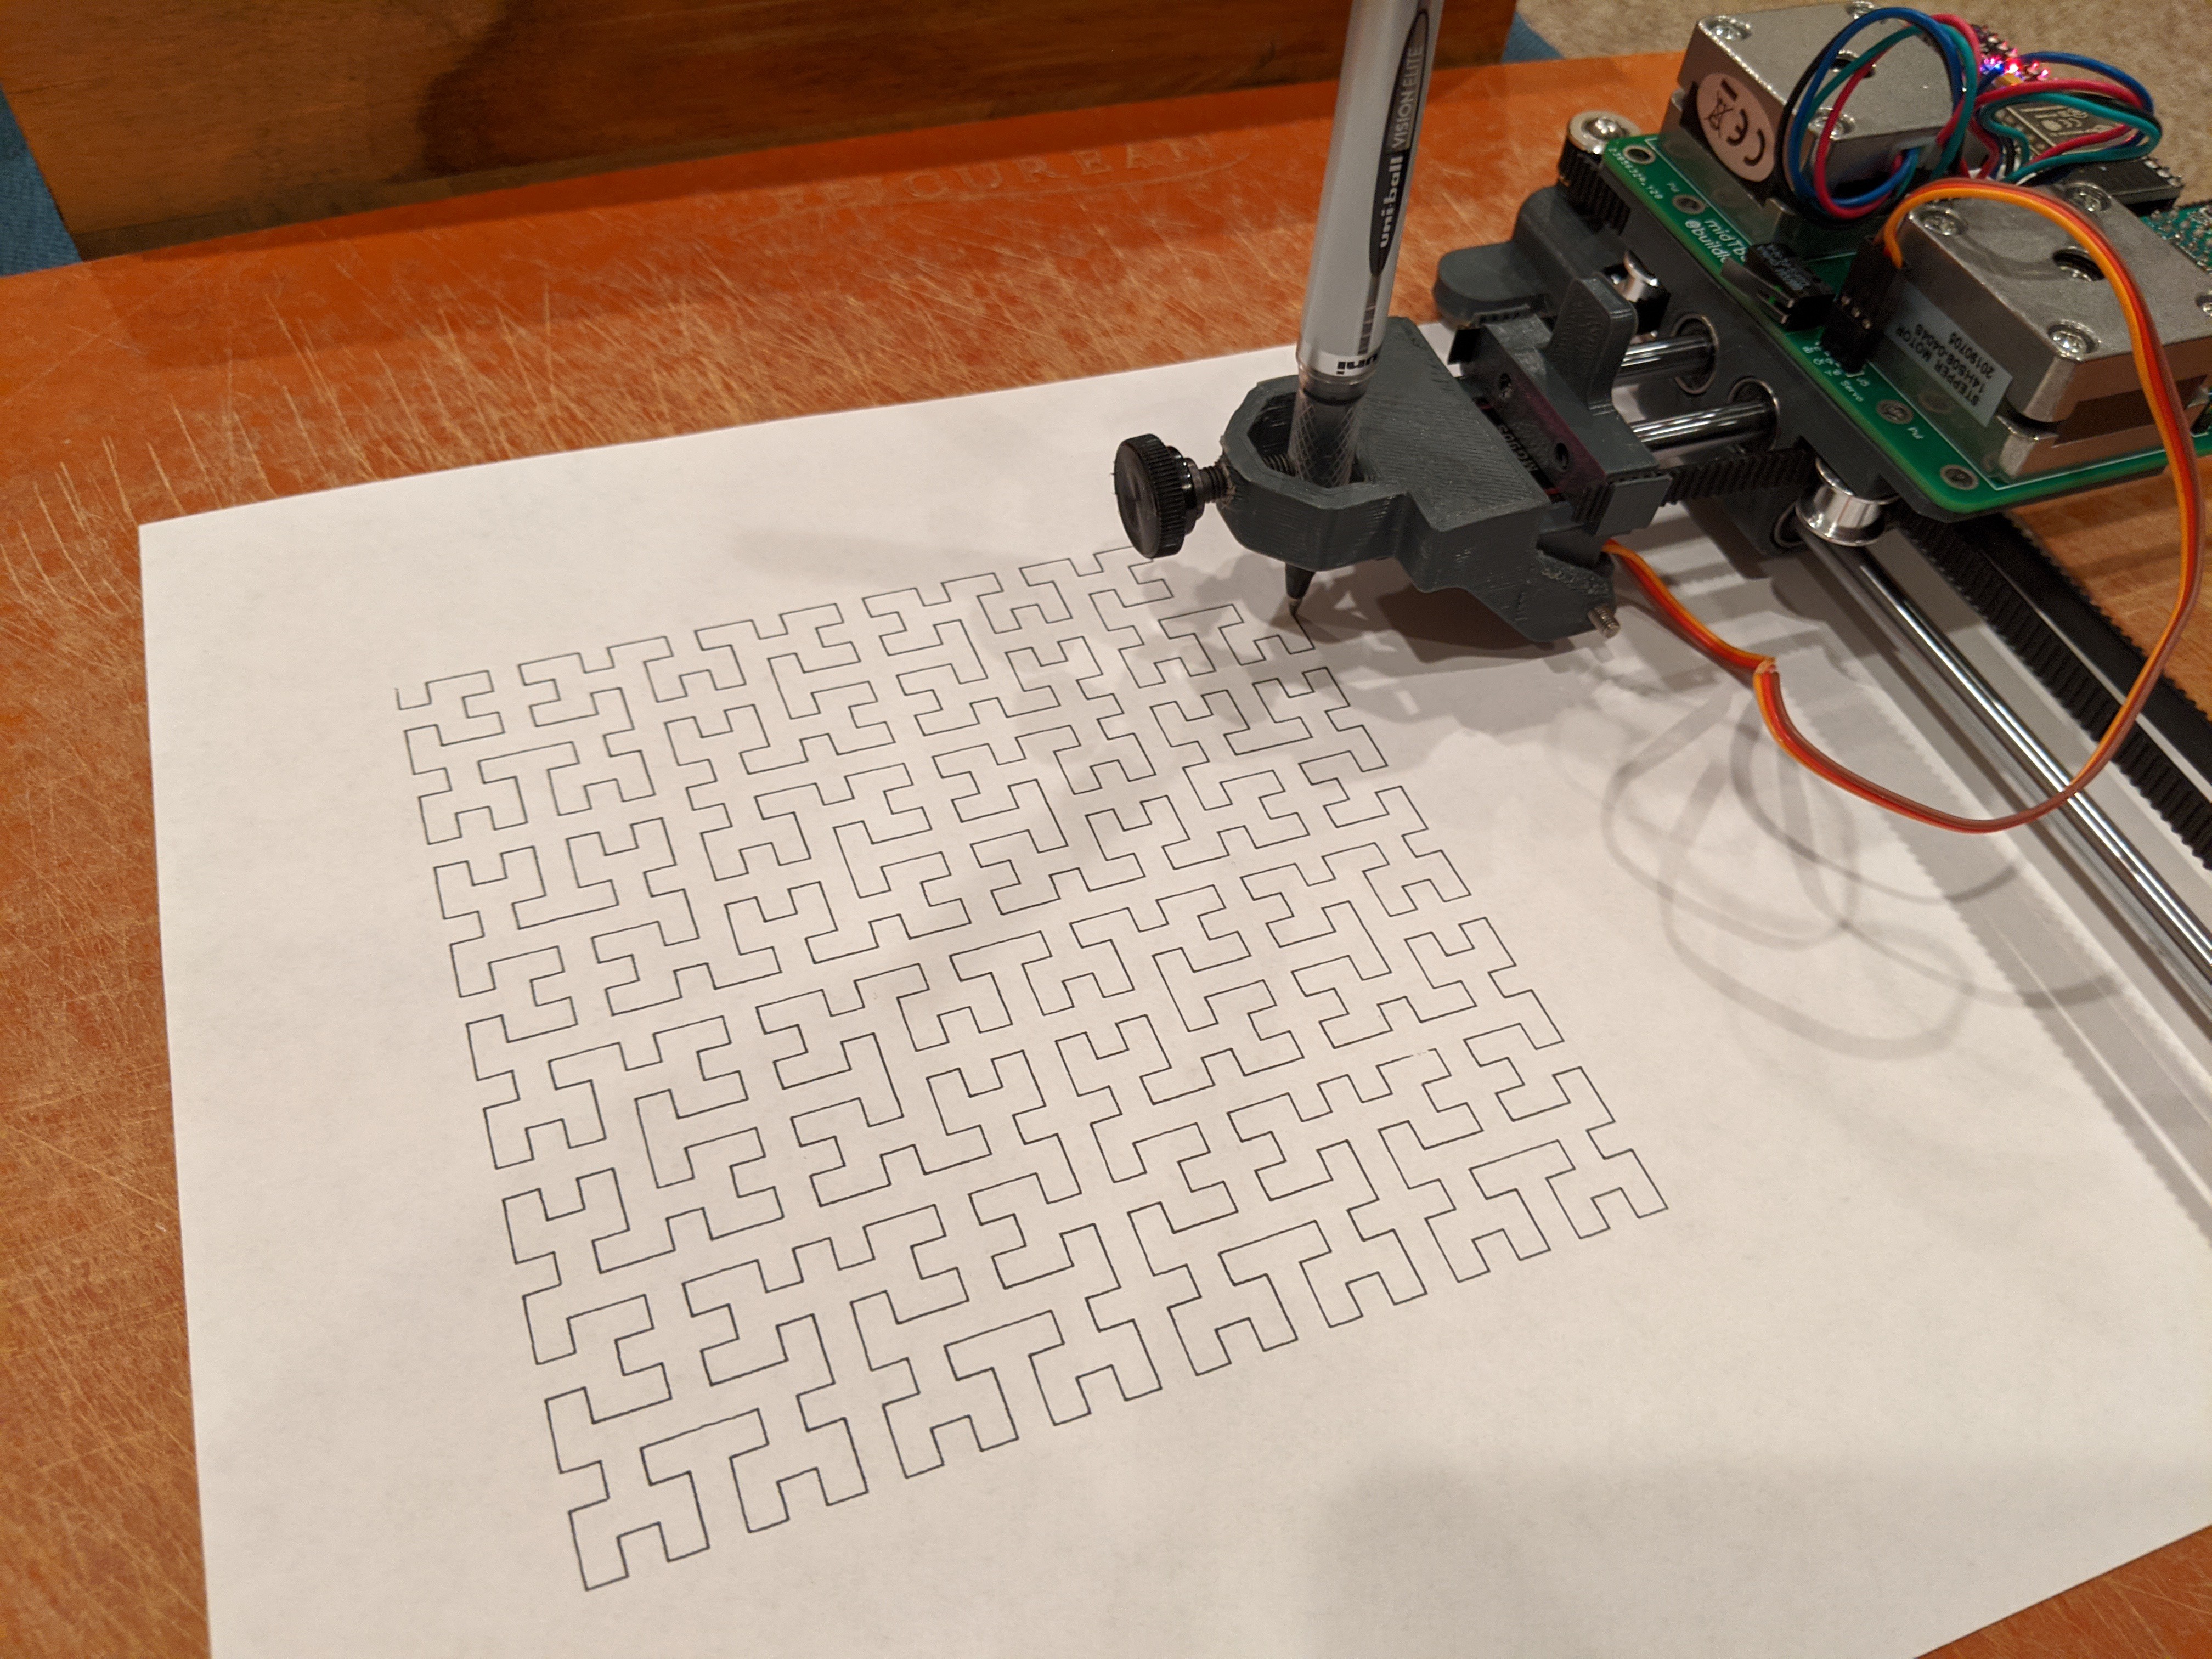
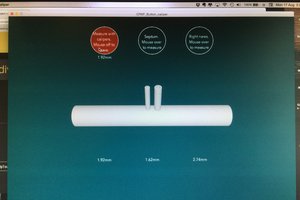
About the Machine
The pen plotter I'm using has a plot area of about 142mm x 142mm. The design is called midTbot by Bart Dring who has well documented everything about the project, and sells driver boards on Tindie.

 Ben Hartmann
 Ted Yapo
 Alex Rich
You've got some awesome precision going on there!