 Mike Szczys
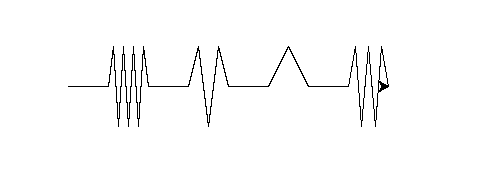
To make my spiral patterns more useful I want to add some contrast element. Seems like drawing a zig-zag pattern is one way to do this as it fills more ink into a given space than merely drawing a straight line.
from turtle import *

stylus = Turtle()
#stylus.setpos(100,100)

def zigzag(turtleObj, endPosition, zigAmplitude, density):
    if density > 7:
        print("Warning: Density out of bounds, setting to zero")
        density = 0
    staticAxis = (endPosition[0] - turtleObj.position()[0], endPosition[1] - turtleObj.position()[1])

    #Don't zig if somethings wrong with coordiante sets
    if (staticAxis[0] == 0 and staticAxis[1] == 0) or (staticAxis[0] != 0 and staticAxis[1] != 0):
        print("Error: can't zig unles one and exactly one X/Y coordinate set is the same")
        #Just move to the end position and return
        turtleObj.setpos(endPosition[0],endPosition[1])
        return

    if density == 0:
        turtleObj.setpos(endPosition[0],endPosition[1])
        return

    if staticAxis[0] == 0:
        #We should be moving along the Y axis because start and end X coord is the same
        staticStart = turtleObj.position()[1]
        peaks = returnZigPoints(staticStart,endPosition[1],density)
        amplitudeValues = (endPosition[0] + zigAmplitude, endPosition[0] - zigAmplitude)
        for i in range(len(peaks)):
            turtleObj.setpos(amplitudeValues[i%2],staticStart+peaks[i])
    else:
        #We're moving along the X axis
        staticStart = turtleObj.position()[0]
        peaks = returnZigPoints(staticStart,endPosition[0],density)
        amplitudeValues = (endPosition[1] + zigAmplitude, endPosition[1] - zigAmplitude)
        for i in range(len(peaks)):
            turtleObj.setpos(staticStart+peaks[i],amplitudeValues[i%2])

    #Send cursor to the final position
    turtleObj.setpos(endPosition[0], endPosition[1])

def returnZigPoints(startPoint,endPoint,density):
    steps = (endPoint-startPoint)/(density+1) #There is 1 more segment between points than there are total points
    pointset = [steps]
    for i in range(1,density):
        pointset.append(pointset[-1]+steps)
    return pointset
Using this code:
stylus.setpos(40,0)
zigzag(stylus,(80,0),40,7)
stylus.setpos(120,0)
zigzag(stylus,(160,0),40,3)
stylus.setpos(200,0)
zigzag(stylus,(240,0),40,1)
stylus.setpos(280,0)
zigzag(stylus,(320,0),40,5)
So if I combine this with a bit of image processing and add it to the spiral patterns I was drawing before, I should be able to make some kind of meaningful abstract representation of 3-bit grayscale. That's next on the challenge list!
Discussions
Become a Hackaday.io Member
Create an account to leave a comment. Already have an account? Log In.