markwarren.ee
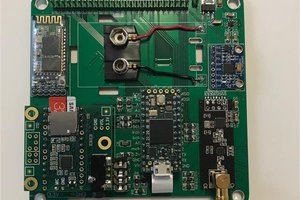
Last couple days been studying and writing some modules for the bmp280 pressure sensor module in preparation for including it in one of my larger projects. I've got a little project running where the esp device (an esp8266 D1mini in this case) masters an i2c bus going to the bmp280 and displays the data on an oled display. When the tcp server running on the esp receives a properly formatted http request packet it responds with a packet with the most recent temp and pressure data. On a desktop I am running a shell script that periodically issues a curl command with the http request, receives the response, timestamps it and appends it to a data file. The data file is formatted for a gnuplot script file that outputs a graph as the one accompanying.
Discussion - Over short time intervals this device's resolution and repeatability can, impressively, monitor relative height within about a foot (comparable to a few ppm). Over the longer term: while I was working on this a storm was moving through the northeast that saw a fluctuation in pressure of between 984-1018 hPa (which would have been 1000 feet of altitude change). The night that I got it working there was a wind advisory with up to 50mph gusts, it looked like the thing was not going to be useful for my purpose - had relative height reading changing by fifty feet over the course of 10 minutes! (NOT good for an indoor drone) The temperature data also showed that my house was losing heat like five times faster because of the wind (new windows?). When the wind died down my 10 minute drifts from a unit on my desk decreased to the two foot range.
Think I'll keep one (or several) running for a while (anywhere there is a usb charger) and cycle the collection script on one of my permanently on desktops.
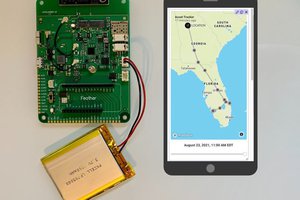
01/22/2020 - added 18650 battery module for portable solution so that I can walk around with it and wave it around to see how the relative altitude measurement is effected. Looks definitely good enough to replace indoor drone throttle faster/slower joystick with altitude up/down in motor speed control loop for my f450 quadcopter project, currently it updates every 1 sec - planning to speed up the loop and experiment with some filtering (and adding some limits - and figuring out how to land gracefully) prior to adding it to attitude control.
Added graph of walkabout to gallery - spent about three minutes walking from my desk up two stories to the attic and then down to to basement. My oled display was showing me my progress while on my desktop the wifi tcp data was being collected on my desktop computer. I lingered for about ten seconds on the second story on my way back down - each level appears to be about ten feet high. Even at the beginning and the end of the graph you can sort of see where I picked up and put the unit back on my desk. Today the winds are 'around 5mph' by the forecast - that windy night when I first got it working the data (forecast 'gusts up to 50mph') would have shown spikes up to about fifty feet within this timescale.
01/23/2020 - added graph to gallery of data collected over about four days. The last two days of pressure data in the graph, where the atmosphere is pretty stable, seems to show signs of semidiurnal 'solar tide' effect on atmospheric pressure - these are like the ocean tides except the force building up the wave is due to uv heating of ozone on the far less massive atmosphere then on the gravitational well from the moon on the oceans - notice that it reaches a peak just before midnight also.
 Paige Niedringhaus
 Mike Holden