 Sridhar Rajagopal
Introduction
Dr. Wattson is an energy monitoring board (based on the #Microchip #MCP39F521, a power monitoring IC) along with an #Arduino library and #Python library (for boards like #RaspberryPi and #BeagleBoneBlack). It is intended to allow you to easily integrate quality energy data into your next project!
If you haven’t heard of it and would like more information, check out https://upbeatlabs-wattson.launchrock.com/ for more information. It is also available on Tindie.
In this project, I created an Arduino based Energy Monitor and Data Logger to help study the energy characteristics of different loads.
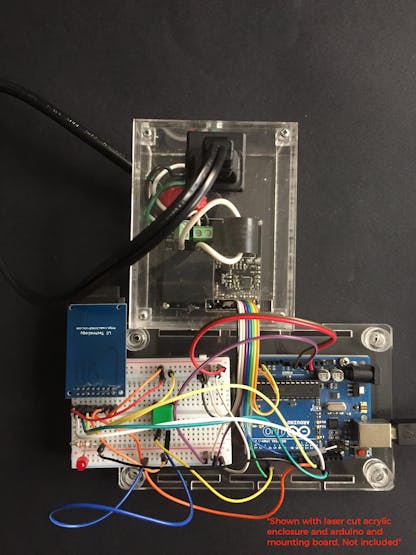
It consists of an Arduino talking to the Dr. Wattson board to get energy data, along with an SD card to write the data to. A button facilitates toggling the data logging, along with an LED indicator to show when data is being logged. The button along with the LED made it really easy to initiate data logging when I had the appropriate load plugged in.
To facilitate the logging and subsequent analysis, I also implemented a log rotation scheme, so each run will be logged to a different file. The output is in CSV format, which means it can be easily imported to Excel (or Numbers on Mac or other equivalent), and the data plotted.
Arduino Energy Logger with Dr. Wattson Energy Monitoring Breakout
Dr. Wattson comes with a companion acrylic enclosure, so that the AC wires are enclosed and you can use it in a safe manner. The enclosure is available on Tindie as well - https://www.tindie.com/products/upbeatlabs/enclosure-for-dr-wattson-energy-monitoring-board/
/i/89288/products/2018-02-09T02%3A19%3A15.985Z-DSC_1386.jpg)
/i/89288/products/2018-02-09T02%3A19%3A15.985Z-DSC_1382%20%281%29.jpg)
I have prepared a User Manual showing how the wiring is to be done, which is now available on GitHub, along with the Arduino and Python libraries.
See the Instructions section on the Setup, the Circuit and a discussion of the Sketch!
Action!
Once I compiled and uploaded the sketch to my Arduino, getting energy data was pretty easy.
I plugged in the load of choice — a CFL lamp. I wanted to see the current and energy consumption from a cold-start perspective, as well as a warm-start. I plugged in the lamp, but didn’t turn it on.
I pressed the button on my circuit to start the energy measurements — when it was logging, the RED LED told me so! I then turned on the CFL Lamp, and waited until the I thought I had gotten enough data — you see, the CFL, when starting off, consumes more energy than advertised (in my case, a 14W CFL bulb), and then settles down eventually to about 14W. I waited until the readings had settled down. I then pressed the button to turn off the reading.
I could now safely eject my SD card and start looking at the data!
PS — To log data from additional devices, all you have to do is reset the Arduino — it will pick the next available DATAXX.CSV to log the data into, so you can easily keep the data separate.
Note: Instead of using the Arduino Serial Monitor, I use the built-in “screen” command on my Mac terminal as a serial terminal. In my Sketch, I print the energy data to Serial, and also issue a “clearscreen” command, so the output doesn’t move
Serial.write("\x1B" "c"); // Clear the screen on a regular terminal
wattson.printMCP39F521Data(&data);
This only works on a regular terminal that can accept terminal commands like the above, and does not work on the Arduino Serial Monitor unfortunately. However, once you try screen, you may never go back to Arduino Serial Monitor!
The command will be something like this:
$ screen /dev/tty.usbmodem1411 9600
where the first parameter is the “serial port”, and the second is the speed you have configured for your Serial connection in your Arduino sketch.
Plotting the data in Excel
Because the file in CSV format, loading it and plotting it in Excel was pretty easy. I shall not go into the details here, as there are many tutorials for creating a chart in Excel. I inserted a row containing the column headers
timestamp, currentRMS, activePower, reactivePower, apparentPower
(note to self — this will be a future enhancement to my Sketch — to add the column headers in the CSV directly!)
I chose the above datapoints to log and plot. Current consumption over time is obviously interesting. Why activePower, reactivePower and apparentPower? Based on the electrical characteristics of the device, it can be a resistive load, a reactive load, or somewhere in between, and the three power parameters thus tell us its overall characteristics, and also if they change over time. Or so I think…
Let’s take a look at my results for a CFL Lamp from a cold start:
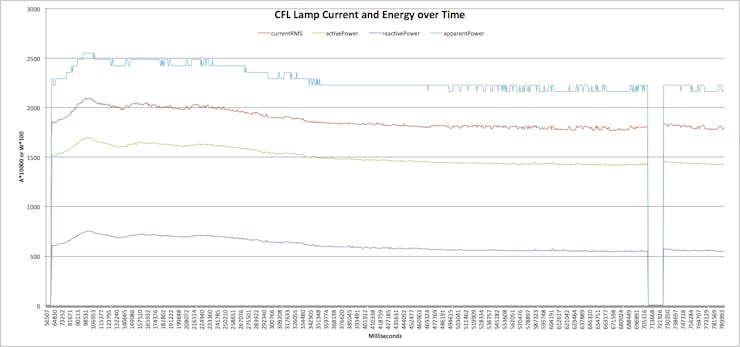
CFL Current, Active Energy, Reactive Energy, Apparent Energy Data over Time — “cold-start” and “warm-start”
A note on the units: the current is A/10000 and energy is W/100 — these allow the values to be in the same range for plotting together to see trends.
The current peaks at around 0.21 amps before eventually settling to about 0.18 amps.
The active power peaks at about 17 watts before eventually settling to about 14.2 watts.
After it had settled, I switched off the CFL and waited for a little while, before turning it back on again (hence the drop in the current in the chart above). You can see that once a CFL has “warmed up”, it quickly settles to it steady state consumption.
Conclusion
There’s a lot of interesting data and experiments you can do with energy data from your appliances and devices. I was excited to start getting my hands on some data and sharing them with you!
My goal with Dr. Wattson is to enable quality energy data for the Maker and make it more accessible, so you can use it as a building block for your wild and crazy ideas.
Dr. Wattson is designed to be safe to use (especially with the enclosure) and uses a isolated design using a current transformer and voltage transformer (so you don't need any other components other than your Arduino to start reading energy data), comes calibrated (so you can get quality energy data right away), but also exposes more complex functionality for the serious user (that have been fully implemented in the Arduino and Python libraries):
- calibration routines
- ZCD (Zero Crossing Detector)
- Event notification (over-current, over power, voltage sag/surge events) - get external interrupt notifications on events you have subscribed for
- the ability to customize the range of readings (by modifying burden resistors and or CT and recalibrating using above-mentioned calibration routines),
- using multiple Dr. Wattsons together with a single MCU (by changing configurable I2C addressing).
If you are interested in energy monitoring and like Dr. Wattson, please sign up at (https://upbeatlabs-wattson.launchrock.com/) to stay abreast of news and updates!
Cheers,
Sridhar