 danjovic
I should apply a gamma curve to the analog axes read from Classic controller to make the response of the stick more subtle near the center and more steep close to the edges.
Classic controller analog sticks provide position information with a low resolution. Left stick provides 64 steps and Right stick provides 32.
Both axes are combined using the following equations:
index = LeftJoy + (RightJoy * 2) - 32;
if (index > 63) index = 63;
if (index < 0 ) index = 0 ;
The variable index shoulld assume a value between 0 and 63.
When both sticks are in center position the resulting will be 32, right in the middle of the scale.
Either stick can be pushed or pulled to make the index value swing from 0 to 63. If both sticks are moved in the same direction the resulting value will reach the maximum (or minimum) on the middle of their course (not exactly in the middle because of the gamma curve). On the other hand, when both sticks are thoroughly moved in opposite directions the resulting will be again the middle of the scale.
Whole code to process the joysticks is then:
  lx=classic.leftJoyX();
  ly=classic.leftJoyY();

  rx=(classic.rightJoyX()<<1);
  ry=(classic.rightJoyY()<<1);

  combinedXaxis = lx+rx-32;
  if (combinedXaxis>63) combinedXaxis = 63;
  if (combinedXaxis<0)  combinedXaxis = 0;

  combinedYaxis = ly+ry-32;
  if (combinedYaxis>63) combinedYaxis = 63;
  if (combinedYaxis<0)  combinedYaxis = 0;

  combinedYaxis = 63-combinedYaxis;
The latter statement on code above inverts the way that Y axis behaves so the resulting value grows when the stick is moved down and vice versa.
Gamma
The curve below depicts the values from middle scale to the upper limits (down and right), being a total of 31 counts. The Y axis represents the amount of countings that should be read by the 5200 system.
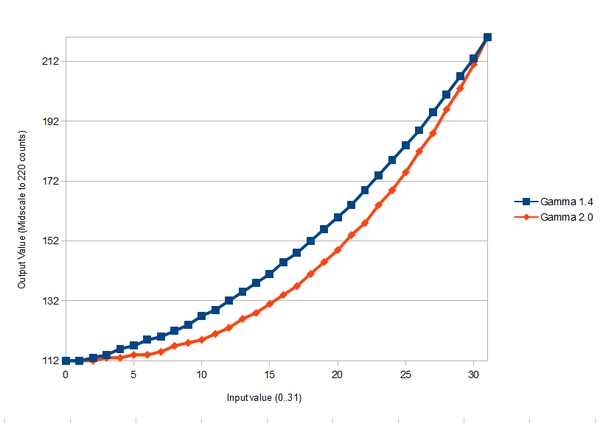
The whole curve along with a gamma = 2.0 and a linear reference (gamma = 1.0) is depicted below
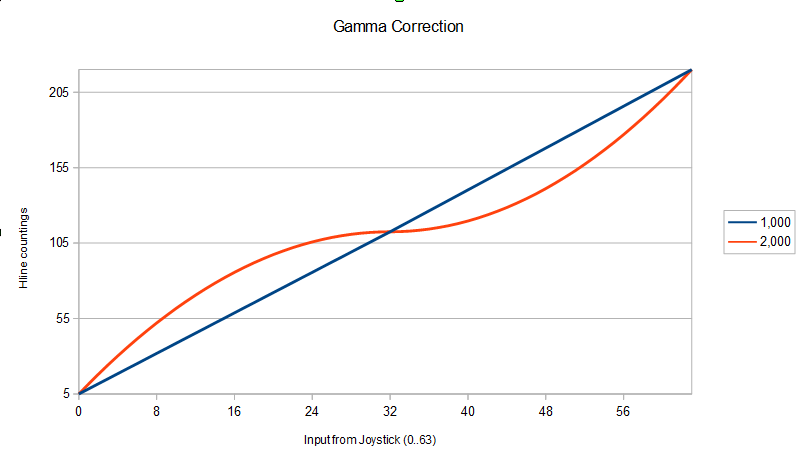 The spreadsheet that generated the curve provides the array for correction of gamma values:
uint8_t gammaCurve[64] = { // gamma = 2.0
5  , 12 , 18 , 24 , 30 , 36 , 42 , 47 , 52 , 57 , 62 , 66 , 71 , 75 , 78 , 82 ,
86 , 89 , 92 , 95 , 97 , 100, 102, 104, 106, 107, 109, 110, 111, 112, 112, 112,
113, 113, 113, 114, 114, 115, 117, 118, 120, 122, 124, 126, 129, 131, 134, 138,
141, 145, 149, 153, 157, 162, 167, 172, 177, 182, 188, 194, 200, 207, 213, 220
}
Discussions
Become a Hackaday.io Member
Create an account to leave a comment. Already have an account? Log In.