 MorriganR
As noted above, the EXTEST instruction is not safe if you do not have the electronic schematic. For example, some unused pins can be connected to ground. Forced change of the state of such pins to 0 or 1, using the EXTEST command, can lead to the significant current flow. As a result the power consumed by the board under study from the power source can change. A similar situation can be observed when trying to control the state of the pins connected to the output pins of other chips or clock sources. An analysis of the power consumed by the board, in combination with the EXTEST command, will provide us with the additional information.
The circuit shown in the figure below was assembled in order to measure the current consumed by the board. It includes a shunt resistor and an INA180A3 current-sense amplifier.
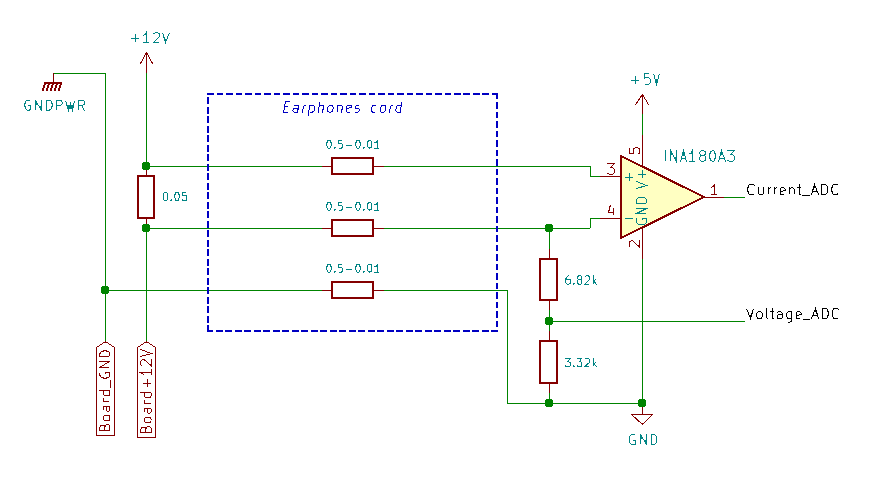
All components were mounted directly on the Arduino Nano board with the exception of the shunt resistor.
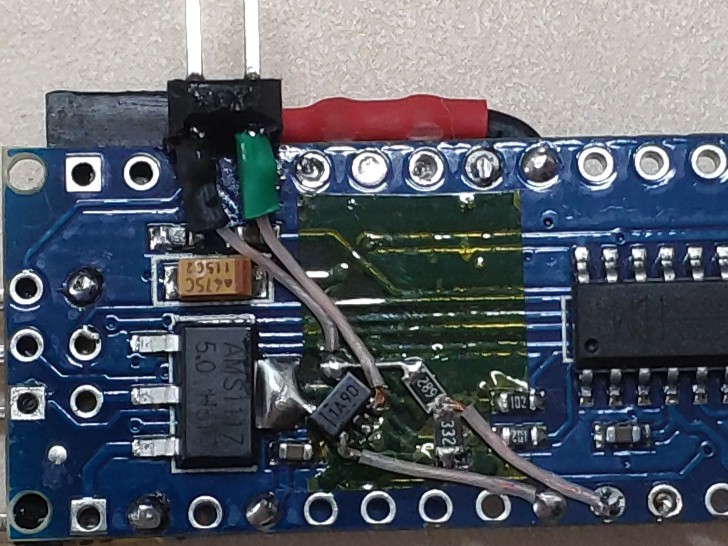
The shunt resistor was placed on the power cable. This does not comply with TI's recommendations for incorporating the INA180, but in order to verify the concept we will consider this acceptable.
The Microsoft Catapult V2 board was chosen as a test subject. Eight LEDs array is installed on the board, which are controlled by drivers via FPGA pins.
For testing we will need only a light-emitting diode LEDG[0], which is controlled by FPGA pin A11. All the information we need to control the state of this pin can be found in the BSDL file.
--BSC group 452 for I/O pin A11
 "1206  (BC_1, IOA11, input, X)," &
 "1207  (BC_1, *, control, 1)," &
 "1208  (BC_1, IOA11, output3, X, 1207, 1, Z)," &
From here everything is very simple, using the EXTEST command we are changing the state of A11, making sure that the LED is blinking, and in parallel measuring the current consumed by the board from the power source.
The oscillogram of this process is shown in the figure below. The first channel (DC coupled) of the oscilloscope is connected directly to pin A11 of the FPGA, and the second (AC coupled) to the output of INA180A3. To get a picture on the second channel as clean from noise as possible, it was required to use the function of averaging over 256 oscillograms. The total measurement time was about one minute. A similar picture is observed if the oscilloscope is synchronized with the falling edge of A11, the only difference being that the consumption current decreases. The waveform shows that the time, for which the consumed current stabilizes at a new level, is about 1ms.

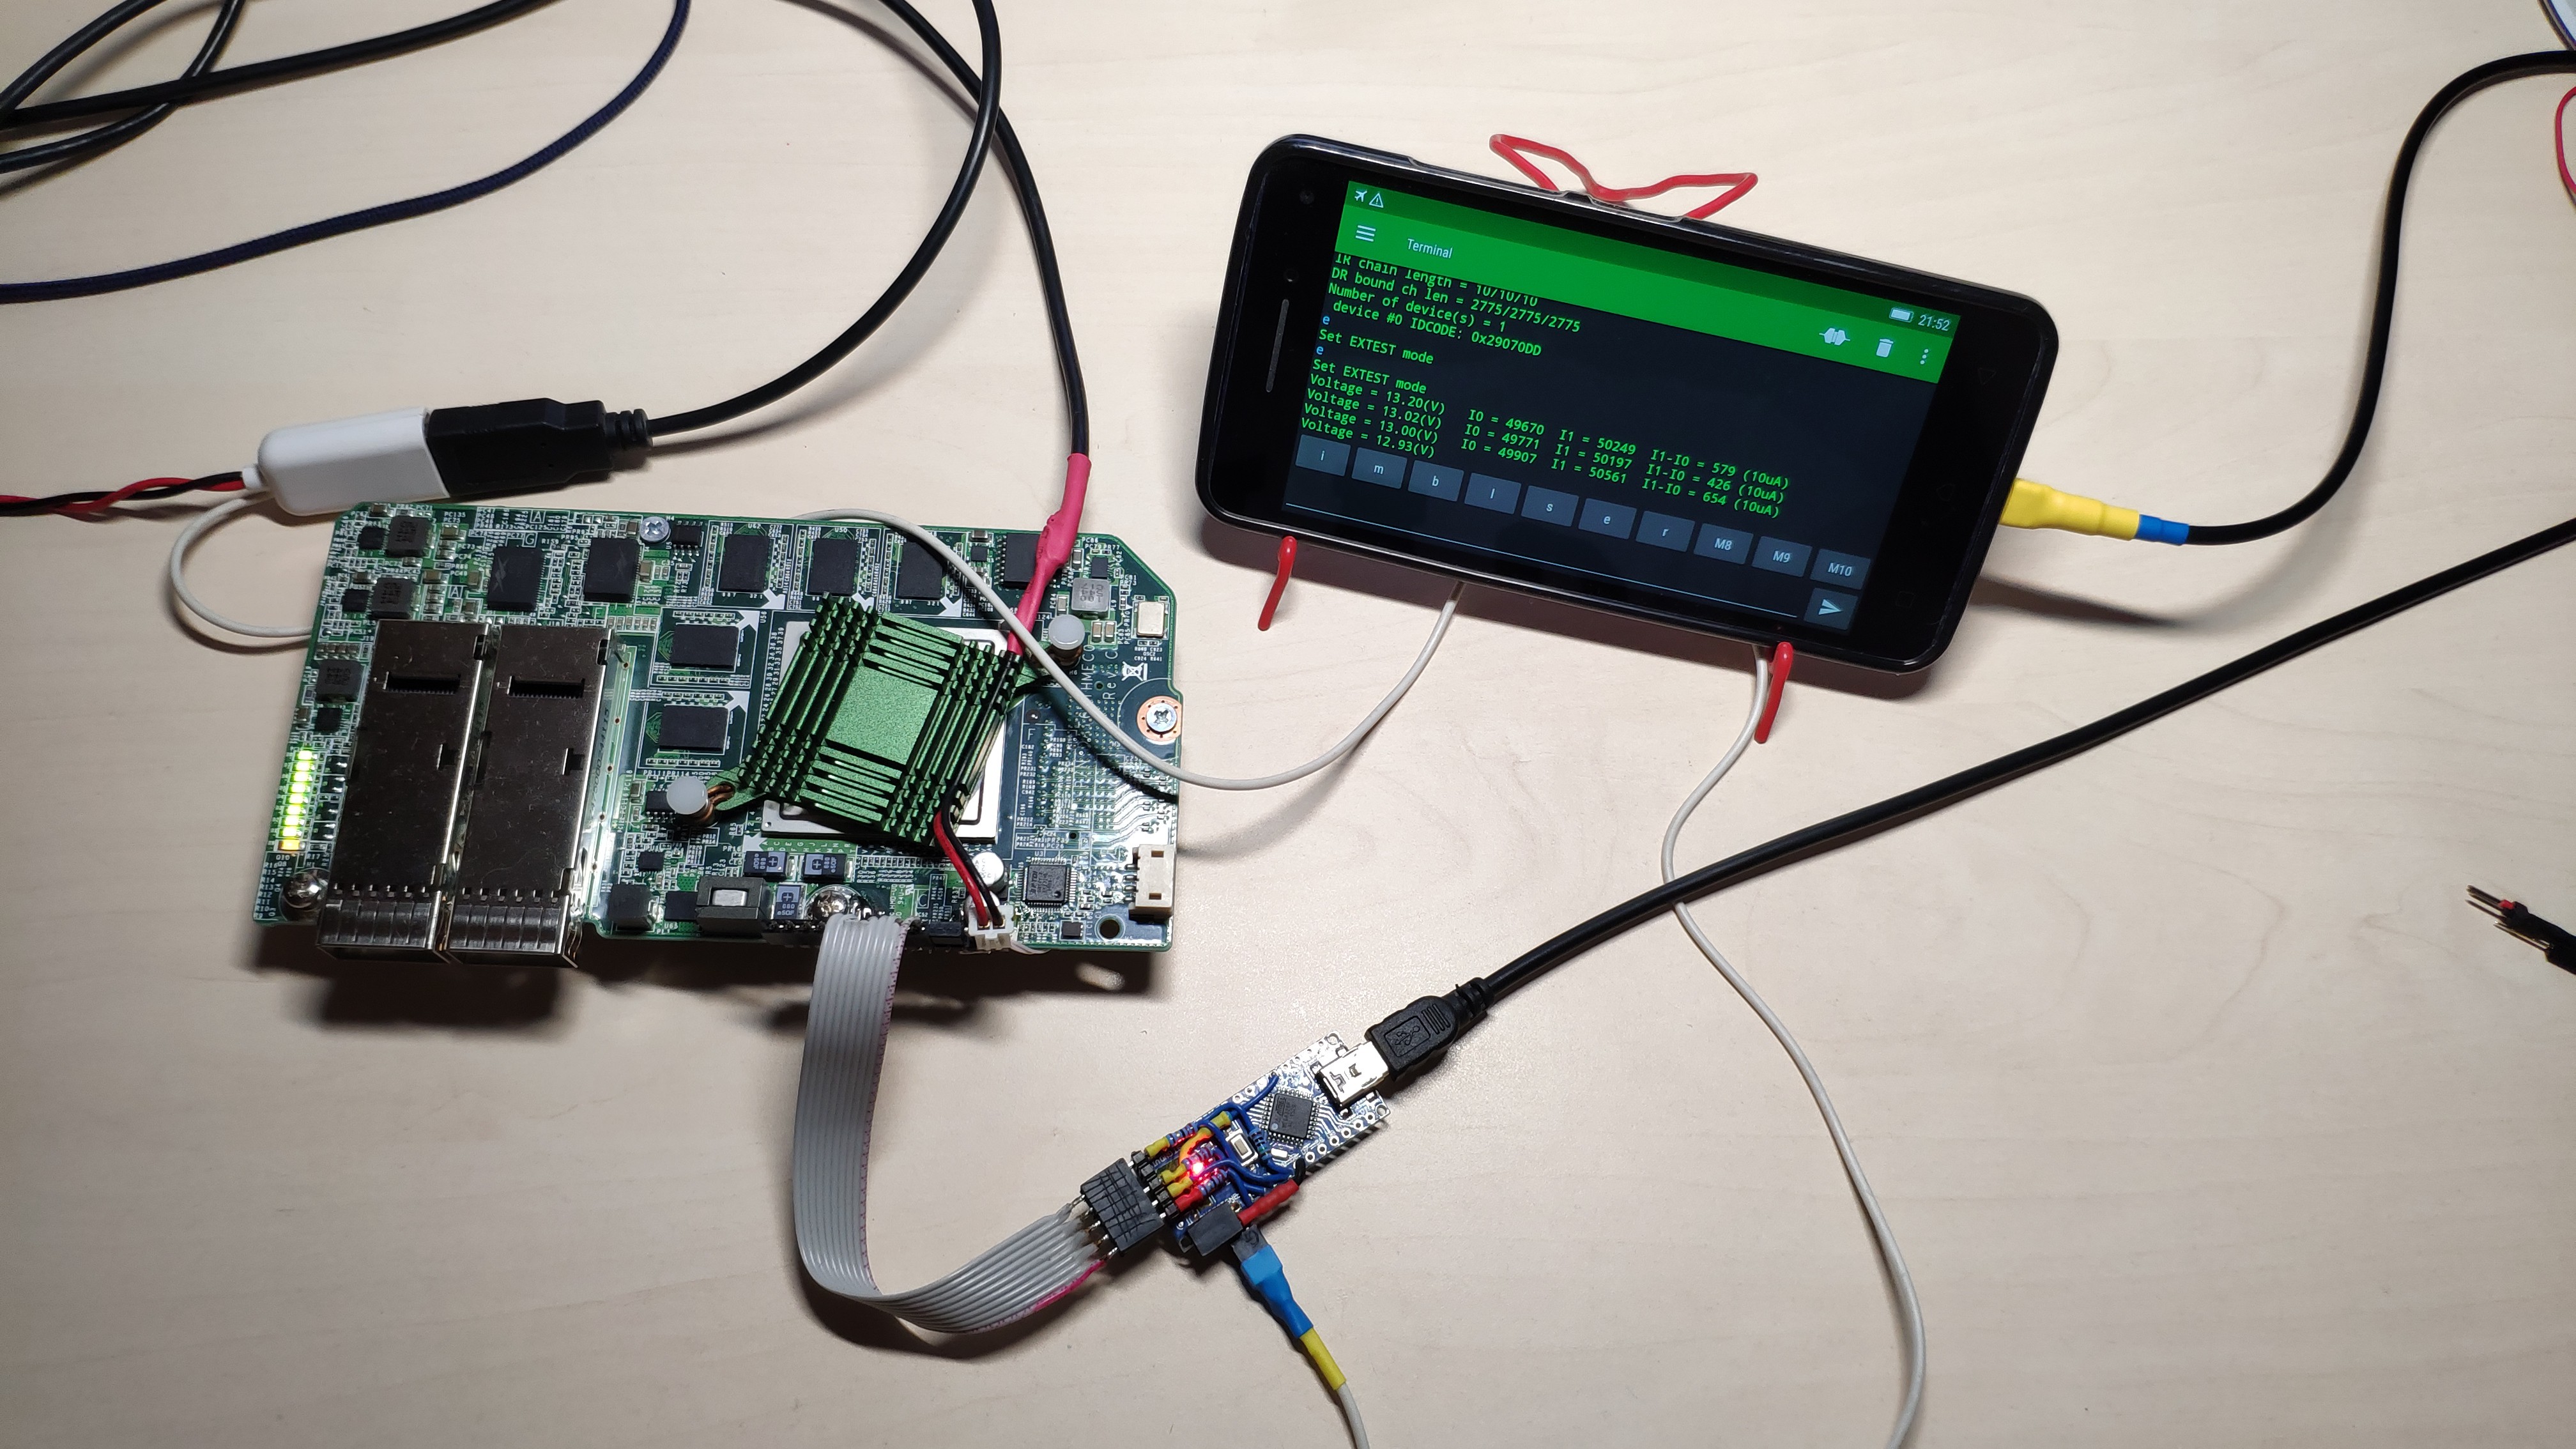
That’s why, it is necessary to measure the current consumed by the board with a delay of at least 1ms. Similar measurements are presented in the figure below.
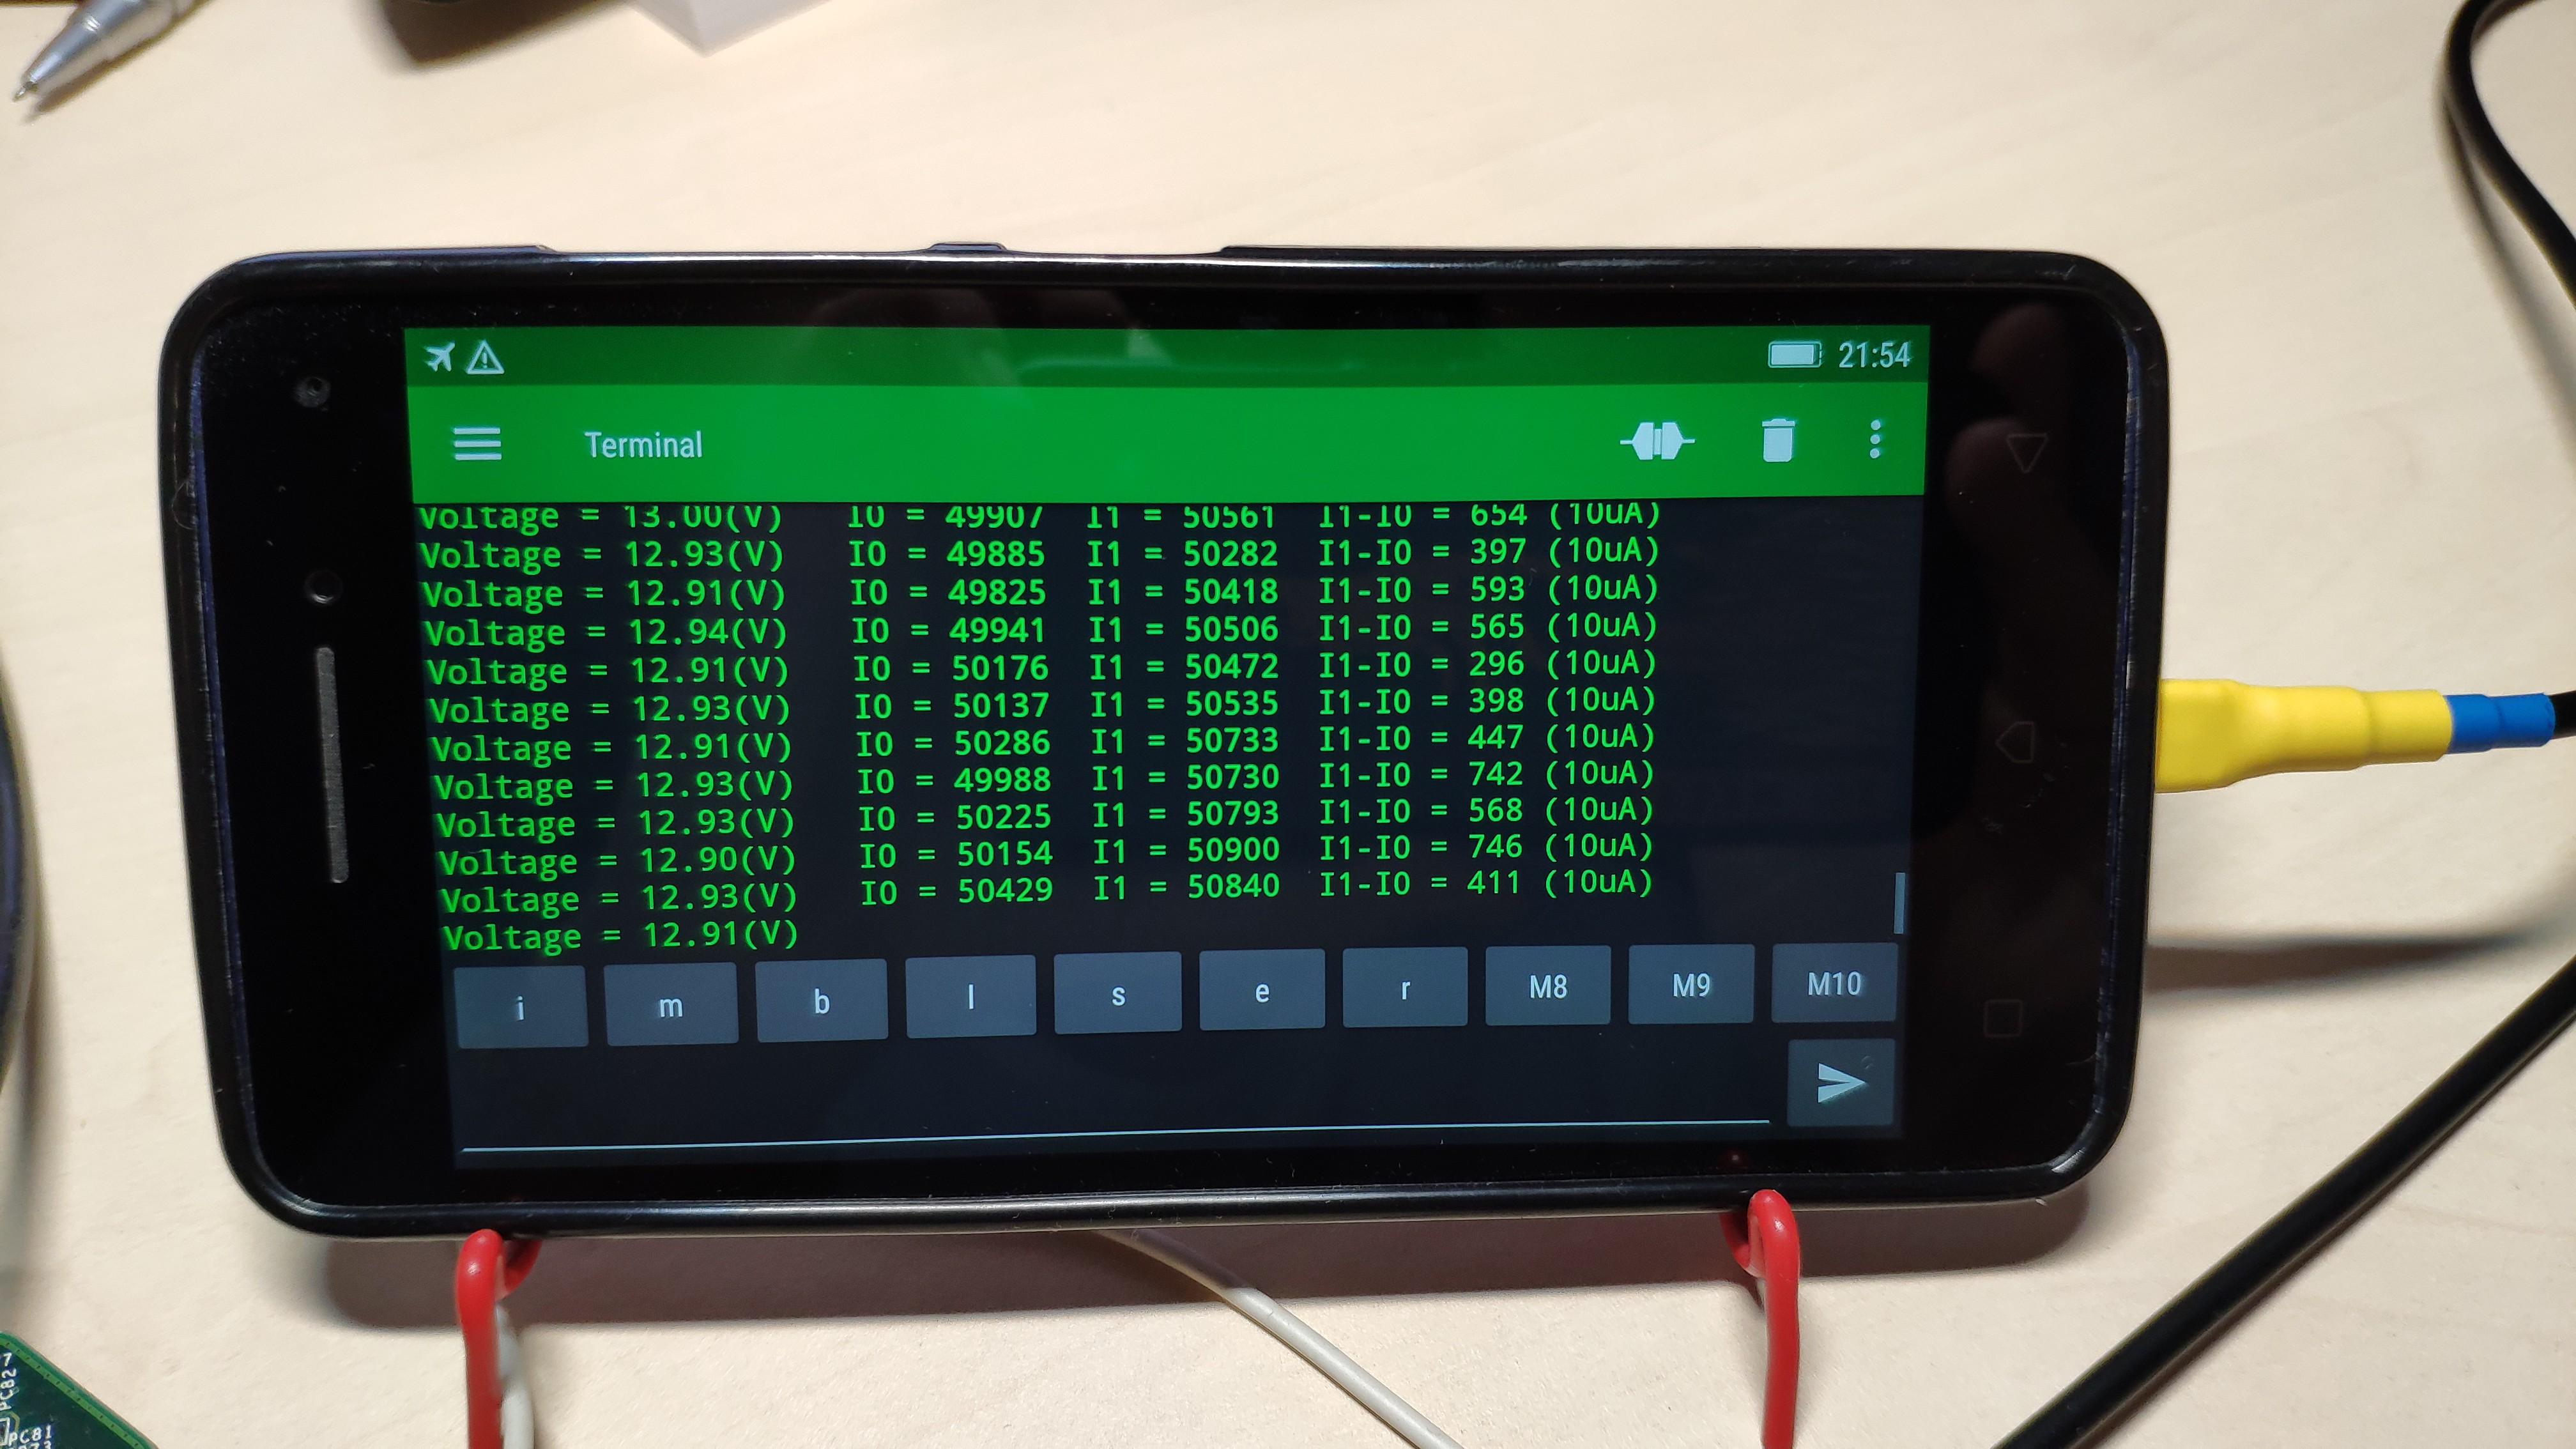
i0 - current consumed by the board in the state A11 = 0, LEDG is off.
i1 - current consumed by the board in state A11 = 1, LEDG is on.
As with the oscilloscope, the data are averaged over several measurements, in this case over 100 measurements. As the results show, the system confidently registers changes in the current consumption at the level of 1%.
Obviously, the sensitivity can be improved if the recommendations for including the INA180A3 are fully implemented. It can also negatively affect the accuracy of analog measurements, in case the Arduino Nano is powered from the phone.
P.S. Arduino sketch for this log is available at https://pastebin.com/P6MCjkSU .
Discussions
Become a Hackaday.io Member
Create an account to leave a comment. Already have an account? Log In.