 Rohan Menon
Background
Water bodies are crucial components of almost all ecosystems and many human activities. Today, the USGS maintains the largest collection of water sensing devices. They have about 10,000 sensing devices across the nation. Unfortunately, this does not cover millions of American homes susceptible to flooding from nearby streams and rivers or the ocean. Additionally, these sensing stations are designed for accuracy. This means that installing one has a high cost of infrastructure and can cost thousands of dollars.

Water data does not have to be limited to level and flow rates. Many residential drinking supplies come from water that originates as runoff. Impurities like road salt and fertilizer can sometimes find their way into these drinking supplies. By monitoring temperature and conductivity in these streams, you can help predict ecological events like algal blooms. And, if the network of sensors is large enough, you can pinpoint the origin of the impurities.
As climate change makes super storms and mass flood events increasingly common, water resources are becoming harder and harder to predict. The remedy is more data and analysis to provide real-time insights about water bodies. A network of low-cost and easy to install sensors would help fill the gaps in our understanding about how water bodies interact while also providing real-time alerts to flood-prone homes.
Solution
Hardware
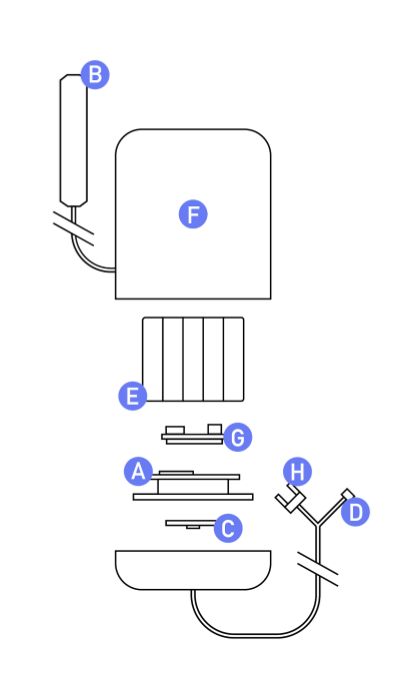
(A) A Particle Electron microcontroller is responsible for coordinating all the sensors present on the device and using a cellular data connection to transmit this to the central server.
(B) A 3G antenna is mounted internally away from other electronics to improve reliability.
(C) An ultrasonic distance sensor faces the surface of the water measuring fluctuations in the height of water flowing through the stream or river. The raw sensor data can then be used as a measure of relative flow rate.
(D) A thermistor mounted under the surface of the water measures the temperature of water flowing through the stream or river.
(E) AA batteries were chosen as the device’s power source for their high energy capacity, low leakage current, and resilience to extreme temperature. Cells are wired in series in sets of 3. This comes out to 4.5V with 15 total cells.
(F) An ABS enclosure is waterproof and designed to be easy to install at the field.
(H) Conductivity is measured by passing a small current through two aluminum plates. When placed under the water, it can monitor relative conductivity.
Bill of Materials
Item | Price |
ABS Enclosure | $10.00 |
Particle Electron 3G | $70.00 |
Ultrasonic Distance Sensor | $5.00 |
AA Batteries x 15 | $5.50 |
Thermistor | $2.00 |
Passives, wire, hardware | $5.00 |
| 3.3V to 5V boost converter | $2.00 |
| Waterproof Button | $5.00 |
| Waterproof RJ45 Panel Mount | $10.00 |
Total | $114.50 |
Software
The software powering the project consists of two main components: the embedded software running on the actual sensor, and the software powering the web server which receives and stores the data from the sensor and provides historical data to users.
The embedded software is designed to consume as little power as possible to extend battery life. The Particle Electron stays in a deep sleep state in between readings which are taken each hour. When the Particle wakes, it takes sensor readings at the same time that it attempts to connect to cellular data. This is so that when it does eventually establish a connection, it can immediately publish the data and return to a sleep state. The device has a software watchdog running as well. If the sensor is on for more than 5 minutes without connecting, it returns to sleep and tries again later.
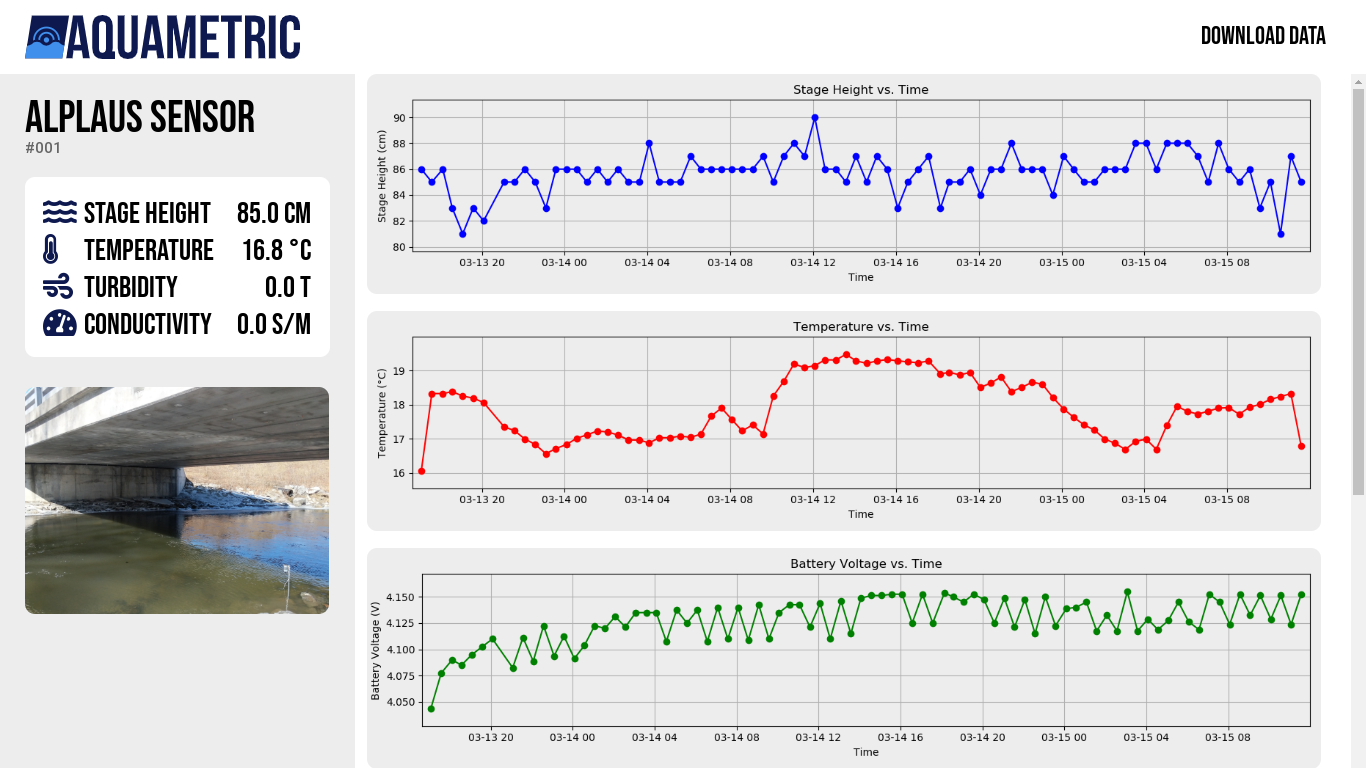
The web server serves two main functions: to receive data from the individual sensor units, and to make this data available to users. To submit data to the server, a sensor unit submits an HTTP POST request consisting of a JSON string which contains the current sensor readings. The server parses this string and adds the data to a log file for that specific sensor unit. This data is then accessible from the interactive website. The website was designed to provide a streamlined user experience and easy access to historical data from all sensor units. All sensor locations are displayed on a map, allowing the user to select the desired sensor. Users can then view graphs of each of the data fields being collected by the sensor, and download JSON or CSV files containing historical data to perform further analysis.
Build Guide
If you would prefer a docs style build guide, you can find that here.
Choosing Parts
Depending on the specifics of your installation, the parts you buy are likely to be different.
Sensors
Start by considering the different things you want to measure about the stream. In its standard configuration, the device uses sensors measures stage height, water temperature and water conductivity. If you would like to measure other things about your water body, you’ll have to design a circuit to control it and modify the device code to measure from your new sensor. For example, the ultrasonic range sensor we use requires 5V to function properly, this required us to add a 5V voltage boost module to our PCB.
Microcontroller
The standard configuration is based around a Particle Electron 3G. Switching to another Particle microcontroller will require some modification of the device code. Switching to a non-Particle Microcontroller will likely require rewriting the device code.
Battery
The battery is the largest component of the device and different situations may call for different battery chemistries. In its standard configuration, the device uses 15 AA batteries in sets of 3 in series (4.5V). This mimics the voltage of a LiPo cell meaning that the existing voltage regulation circuit on the Particle Electron can be used. This pack is designed to last about 1 year, but your milage may vary.
Alkaline batteries were chosen for their high stability at a wide range of temperature and relatively high energy density. Factors like serviceability, temperature range and size limitations may lead you to choose a different battery size or chemistry.
Enclosure
The enclosure is the most variable part of the hardware. In its standard configuration, the device is contained within a 4x6x2.8 in. ABS water resistant box. You should only consider this option if there is little to no chance of submersion or vandalization for your device. Keep in mind that the standard enclosure is the absolute minimum in terms of size, strength, and water resistance.
The enclosure will need holes drilled, and must be easily mountable. Additionally, it cannot be metal if you plan to use an internal antenna.
Enclosure
Layout
Start by laying out the components in their approximate locations in the enclosure. Here are a few considerations:
- A range finder for stage measurement must face the water’s surface.
- Wires to the auxiliary sensors should be routed out of the way of the range sensor.
- The 3G antenna should be placed as far as possible from the batteries or large metal areas.
- Battery replacements / charging should be made easy.

Panel Mounted Components
Cut holes for components that need access to the outside of the enclosure. Usually the ultrasonic range sensor, auxiliary sensor jack and button. If possible, attach leads to these parts before they are mounted.

Use epoxy to seal these holes if waterproof panel mount solutions are not available. After preparing both surfaces, apply the epoxy generously. Avoid getting epoxy on the ultrasonic sensor’s transducer.

Internal Components
Things in the case should be relatively secure. Velcro and double sided foam tape work well if you are trying to avoid making unnecessary holes in the enclosure. Again, prioritize battery replacements and repairs when doing so.
Device Firmware
Power Optimization
Much like the sensor’s electronics, the main goal is to limit on-time and power consumption to extend the battery’s lifetime. The Particle Electron was chosen, in part, for its on-board RTC that stays powered during the device deep sleep. The device stays in this sleep state for the time between measurements (usually 1 hour). The device turns on for as short a time as possible when it does turn on (usually 15 sec).
A single event in which the device does not sleep properly or wakes repeatedly could completely destroy the battery life. The firmware uses a software timer to make sure that the device turns off regardless of a measurement if 3 minutes have expired.
To reduce on-time, the device uses the multi-threading capability of the Electron to establish a cloud connection while taking sensor readings.
Live Configuration and OTA Updates
As weather situations develop, measurements from the sensor may become more important. The device supports variable measurement rates meaning that, for example, in the event of a flash flood, the sensor could take measurements every 20 minutes rather than the typical 1 hour.
Additionally, the ability to update the device firmware without having to visit the sensor is very useful, especially in development.
Each time Aquametric wakes from its sleep, it connects to our server and checks the measurement frequency and the presence of an OTA update from our live config page. If there is an update for it, it lets our server know that it is ready to accept, and the server automatically flashes the device with the new code.
Modifications
Adding additional sensor readings to the data output of the device is relatively easy. Create a method that returns the sensor you are interested in measuring. Add this method to the JSON string that the device assembles.
Mounting and Installing
Considerations
During our build, we significantly underestimated the difficulty that mounting and installing the sensor would be. Here are a few areas you need to consider with your solution.
Stage Range
You will need to consider the range of water levels your sensor will likely see. You’ll want to mount your sensor such that it covers the greatest range of water levels. Keep in mind that the JSN-SR04 typically has a stable range from 10 cm to 1500 cm. In a major flood event, your sensor may very well become submerged for some period of time. At this point, you’ll need to hope that your enclosure will hold up.
Debris
Your mounting solution will likely build up large amounts of debris during its lifetime. Leaves, sticks and mud will accumulate around any and all edges that are in the water. To some extent, this is unavoidable, so they key is to make sure your sensor will continue to take accurate measurements despite debris. For water level measurement, this may mean offsetting the ultrasonic sensor from the main mounting pole to prevent built up debris from skewing sensor data.

Ice
If the device will experience freezing temperatures, consider how ice may affect your device. Ice can freeze onto a mounting pole having a similar effect as debris buildup. When temperatures start to rise again, ice can break into massive sheets that can bend or topple your mounting solution.

This may be an extreme case, but you get the idea.

Our mounting pole after an ice sheet made its way through.
Soil Type
In our experience, stream and river beds are not very friendly to stake pounding. Before you choose a solution, check to see what the ground is like where you plan to install. While we use an aluminum rod to mount our device, we use a 1/2 in. steel rod with a sharpened end to make an initial hole into the ground.
Vandalization
Unfortunately, this is also a major consideration in an installation. You will likely want to choose an area with limited foot traffic. If that is unavoidable, consider a shrouded mounting solution where the device is completely enclosed. Using standard materials like PVC may help avoid attention. Be sure to communicate its purpose and the permission its received clearly. We use a small printed card for this.

What was left of our device after it was vandalized in May.
Selecting an Option
No mounting solution is going to be the best choice for all locations, that’s why there isn’t a one-size-fits-all option (at least for now). We recommend taking two trips to the stream or river you want to install in. Take note of the stream bed hardness, tree and branch locations, and any other structures that you could potentially mount your sensor to. Take lots of photos while you’re there (if you have a ruler in the shot, you can even use it as a crude scale reference).
Now you can weigh the different options for mounting that you have. Here are some of the ones we have used or planned out.
Option | Description | Pros | Cons |
Metal pole | A single metal rod, aluminum in our case, hammered into the stream bed. The sensor is fixed to the top of this pole with an options extension. |
|
|
Metal pole with stabilization | Similar to the first option, however a metal plate is fixed normal to the pole. This plate is covered with large rocks to prevent movement. |
|
|
Tree/branch mounted | Fix the sensor directly to a fallen tree or branch that goes over the water. You may need to correct for the angle of the tree in the mounting design. |
|
|
Monitoring
Joining Aquametric
Connecting your device to the Aquametric Network is the easiest way to view your sensor data in real time (we might be biased). For the time being, this process involves sending us an email with your sensor’s information. Here’s what we’ll need.
Required | Optional |
|---|---|
|
|
When you’re ready, just email us at dev@aquametric.live. We’ll work with you to get the webhooks set up to interface with our server.
Note
If you’re having trouble getting something on the list, let us know. We’re happy to help with the process.
Other Options
There are a host of maker friendly iot platforms that can accept the JSON data that the device produces. Adafruit.io, Thinger.io, and even IFTTT (which now directly supports Particle) may suit your needs. Depending on what you choose, there may be a prebuilt solution to get the data from Particle, but otherwise, you will likely need webhooks and http requests to do this.
Testing and Troubleshooting
Testing IoT devices, especially ones with such aggressive sleep cycles, can be a pain. Here are some easy ways to test the various operations of the device.
Sensors
Using the flag in the firmware, set the device to serial output. Use a serial monitor to watch sensor readings and make sure they are all accurate.
Ultrasonic Issues
If the ultrasonic sensor consistently reports 0, this is probably due to a faulty connection. Readings that hover around a specific value, but do not reflect the actual range may come from a power supply issue. Try supplying power to the sensor directly to see if the issue is resolved. If you notice readings become unstable after some range, this is probably a power supply issue as well. Make sure the voltage you are supplying is what it is designed for. As a last resort, try adjusting the trim inductor on the sensor.
Full Operation
We recommend running the device at home for a few days before deploying it. From this, you may find problems that only occur intermittently or find that your device is drawing more power than you are expecting. Run the device with the standard flag.
If you are not set up with a monitoring solution yet, IFTTT and Google Sheets is probably the easiest way to log the data for testing. Just set up a task that adds a row to a Google Sheet each time a Measurement event is published by your Particle device.