 Rohan Menon
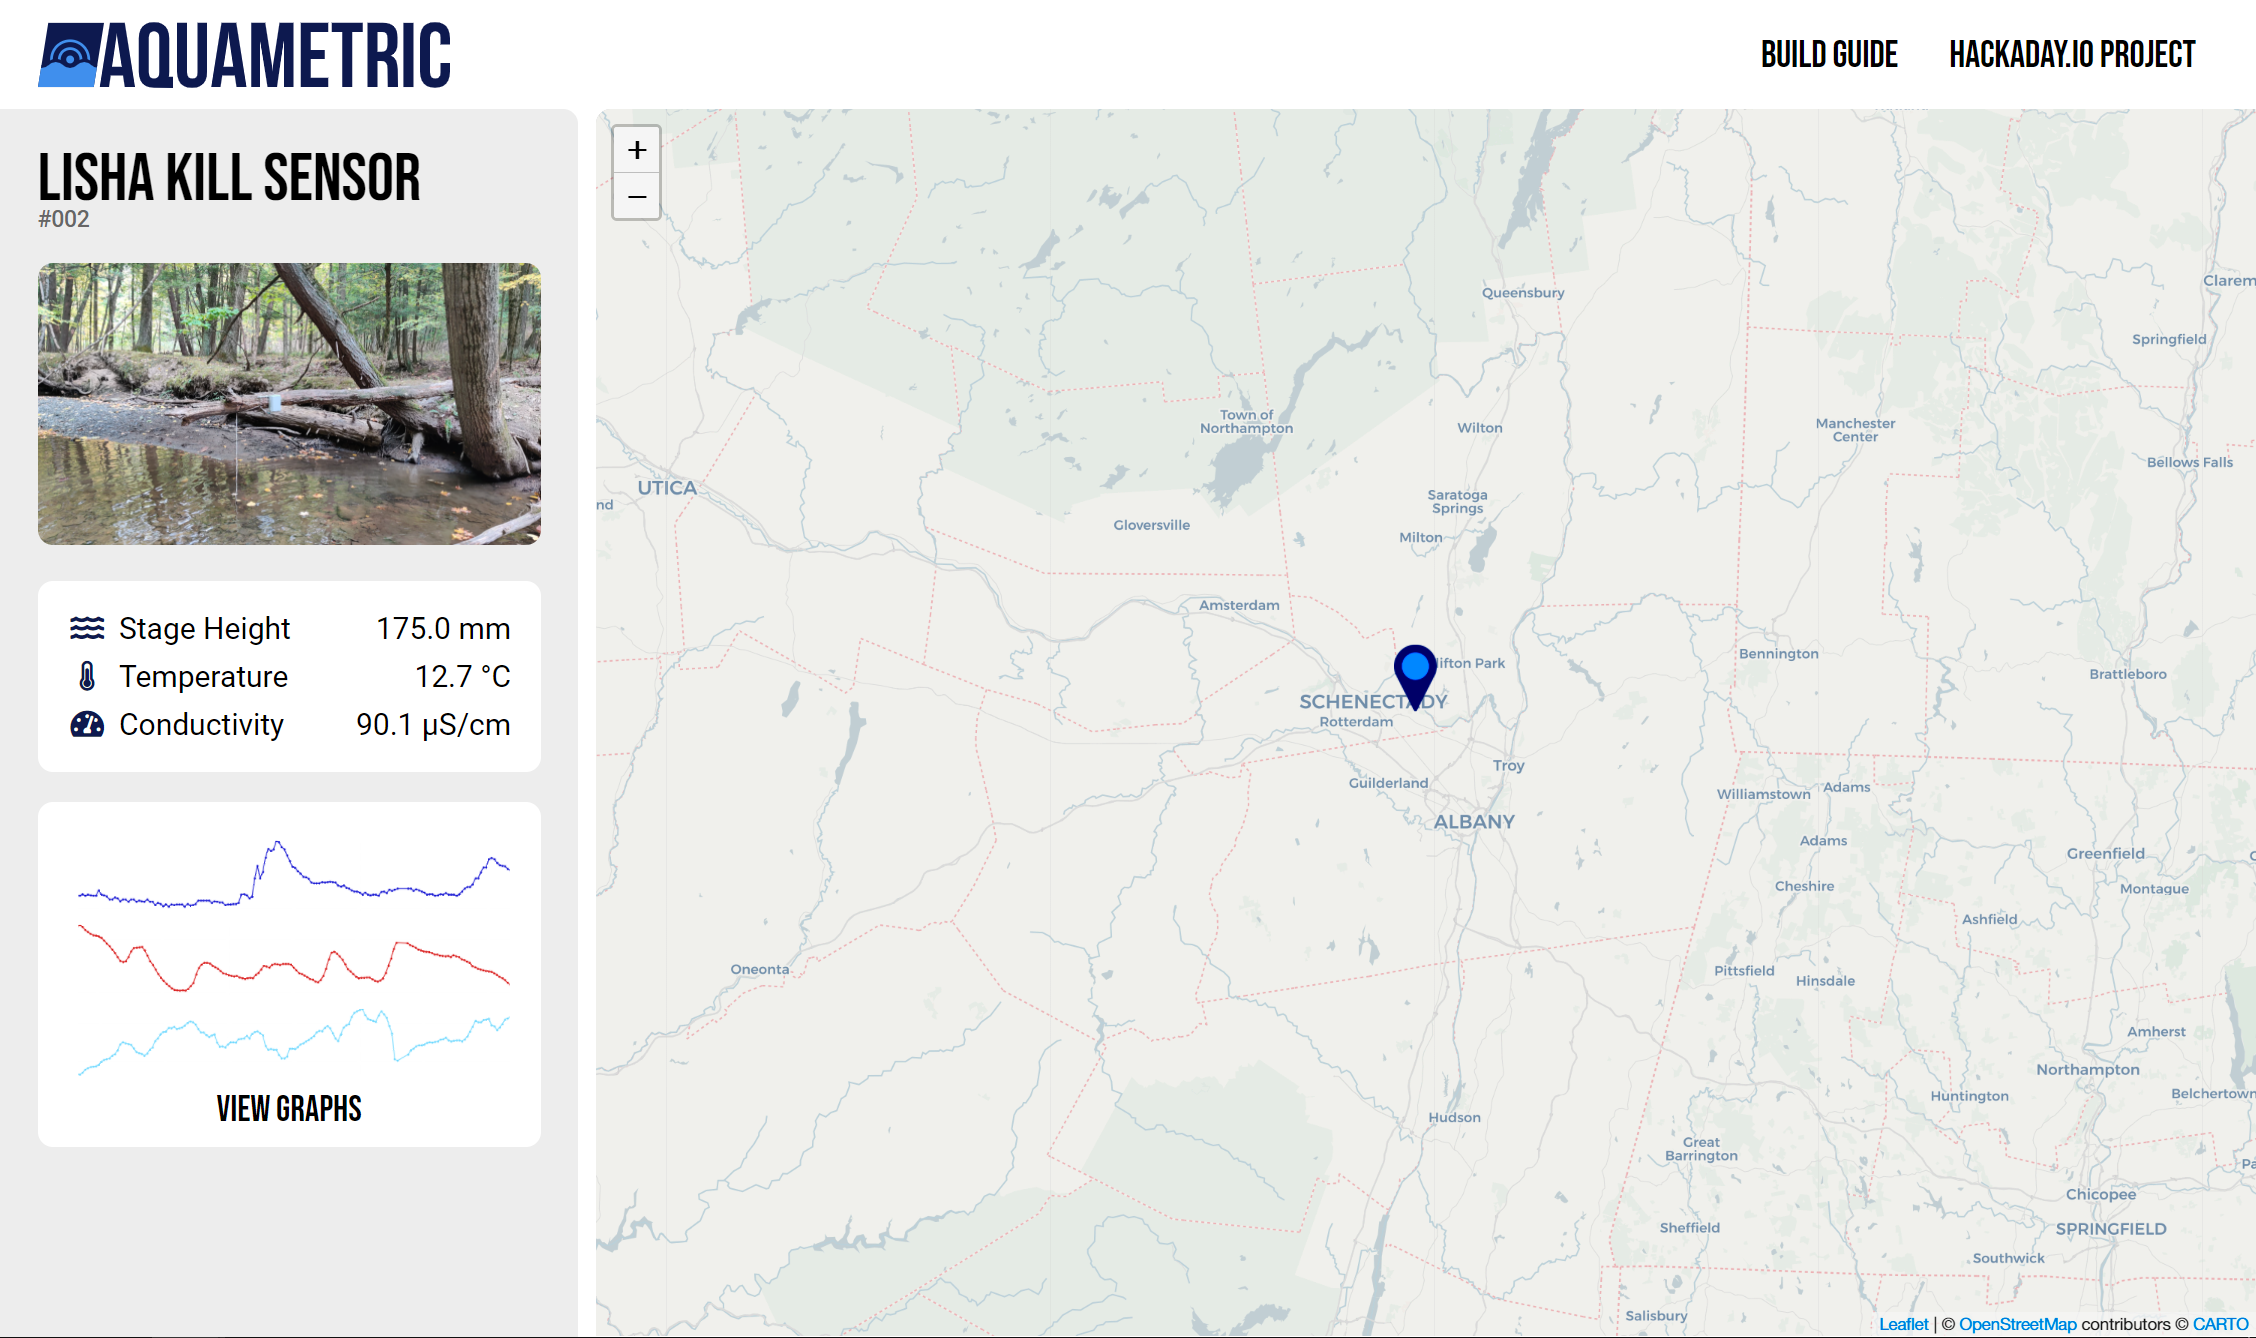
Our website (aquametric.live) is where data from our sensor network is logged. The flask server accepts requests from our sensor and stores them centrally. It also hosts a front end that allows a user to look at current and historical conditions from that unit. Currently, the graphs are generated by the backend on each page load by matplotlib.
We recently added a graph preview to the main info screen that shows the past week of stage, temperature and conductivity data.
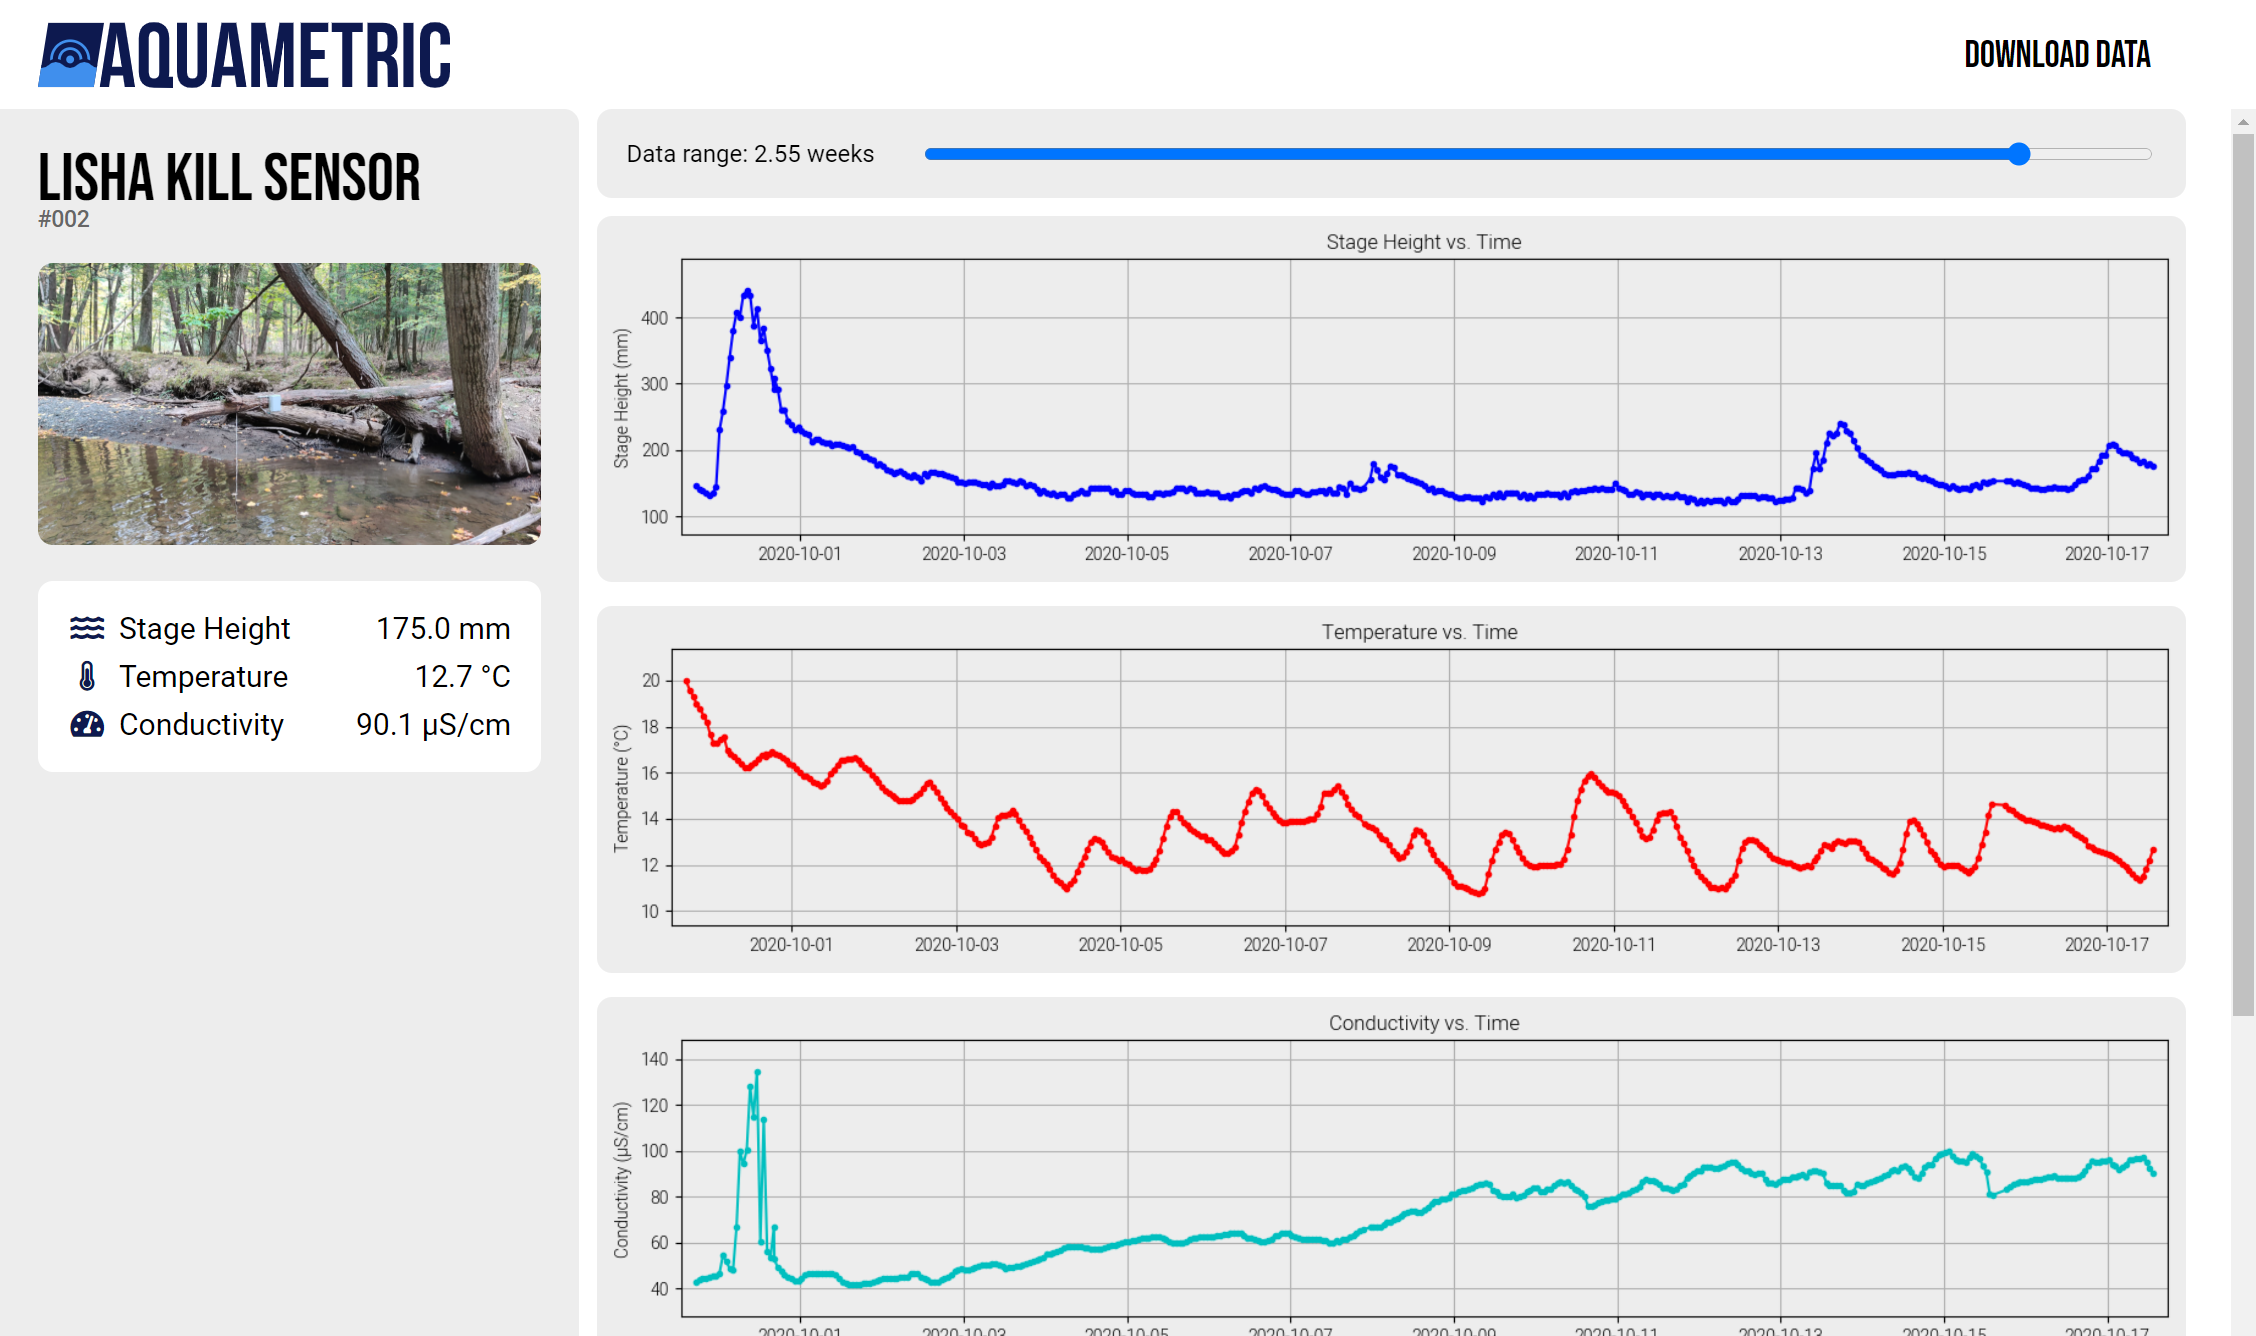
We also added the ability to adjust the data range with a slider on the sensor detail page.
Our next step will probably be switching to dynamically generating the graphs on the front end so they are easier to analyze and can adapt to various screen sizes.
Additionally, the ability to graph other data alongside the water data might reveal insights about how things like rainfall affect conditions. Right now, downloading a CSV of the full data is how we do this.
Discussions
Become a Hackaday.io Member
Create an account to leave a comment. Already have an account? Log In.