 SAYANTAN PAL
Hi, hope you are doing good, and staying at home. As you all know, till now over two million people worldwide, have been infected by coronavirus. which is horrifying. In this
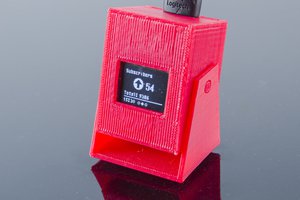
project, I will be showing you how you can create an Internet connected display, which can show coronavirus statistics, in real time. I have used an ESP32 based nodeMCU board and a 1.8 inch LCD display, for this project. I have also made a custom jig, using a piece of purfboard, And made the circuit, using the pinouts given below, to connect them with one another.
Buy electronic components with free shipping on utsource.net
TFT Display Pin --> ESP32 Pin
VCC --> 3V3
GND --> GND
CS --> D15
RST --> D4
A0 --> D2
SDA --> D13
SCK --> D14
LED --> 3V3
Note that, The ESP32 has 2 free SPI ports i.e. VSPI and HSPI, the VSPI is the default. Here I am using HSPI or Hardware SPI port of ESP32. If you are using the same pinout as mine then you need to change that in the “user_setup.h” file under TFT_eSPI library.
In the code, which you can download from my github repo, first we need to include some necessary libraries. We need TFT_eSPI library for TFT display, and TJpg_Decoder library to display custom images on it. To display images we need to have the C array of the Jpeg file we are using. You can go to this website, Image to HEX converter, to Create C arrays from jpeg images using the online tool. And finally we need the ArduinoJson library to fetch the data. Then you need to include your wifi credentials. And then here we have defined the starting days. We need this to count how many days have been passed since all this started.
In the setup section we have initialised wifi and TFT display. Then we draw the background. Next we print some text on the display, and finally move to the loop section. Here we called some functions once by one.First one is the Date function, which shows the time and date. Then we have the world_stat function which shows the statistics around the globe. We fetch the data from a Rest API. let's see how to do that. First go to the Official Website and in the Documentation Page you will learn more about this API.
According to that if you go to this URL you will get the necessary information. You can use the names of other places to be able to get the data from that place. Once you have got the data copy it, and paste it in this website, ArduinoJson Assistant. After that copy the Parsing program and paste it in the code. As we are parsing the data from a website so we will get the response in string. So you need to change that in the code. And like this you will fetch the data successfully. Then we have counted the days, which we are talking about earlier. I have done the same for my regional places as well. Here I like thanks to this github user, Adhikansh Mittal, for creating a simple and easy to use Rest API for India and individual states which I have used in my project. Rest are pretty much the same.

 ACROBOTIC Industries

 Splendide_Mendax
Great but also a scary project. Statistics is a powerful thing if you know how to use it. I'm studying it for a long time, especially by quizzes here https://quizzes.studymoose.com/flashcards/statistics/ , and must say it's not only some numbers. It's a result of the big work of a lot of people. But I'm not sure this project is good in a moral way. Not all people are ready to see the count of deaths.