 Jon
JonPerhaps one of the biggest reasons to launch this project is a fascination with artificial lighting. Access to low-cost versions of what were once prohibitively expensive tools to quantify and control lighting (such as ambient light sensors, RGB sensors, and spectrometers) proved that the timing for a project like this couldn't be more right!
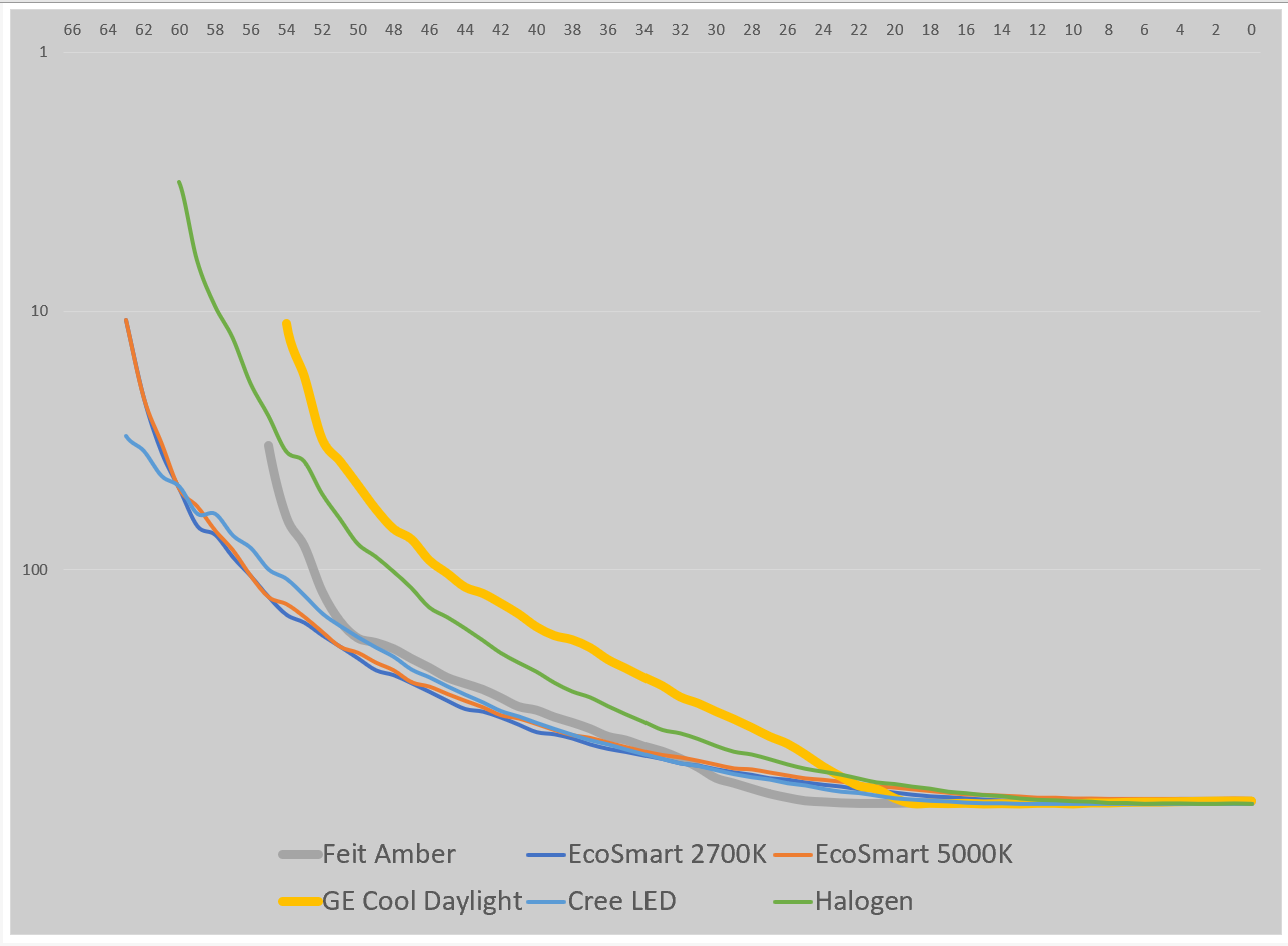
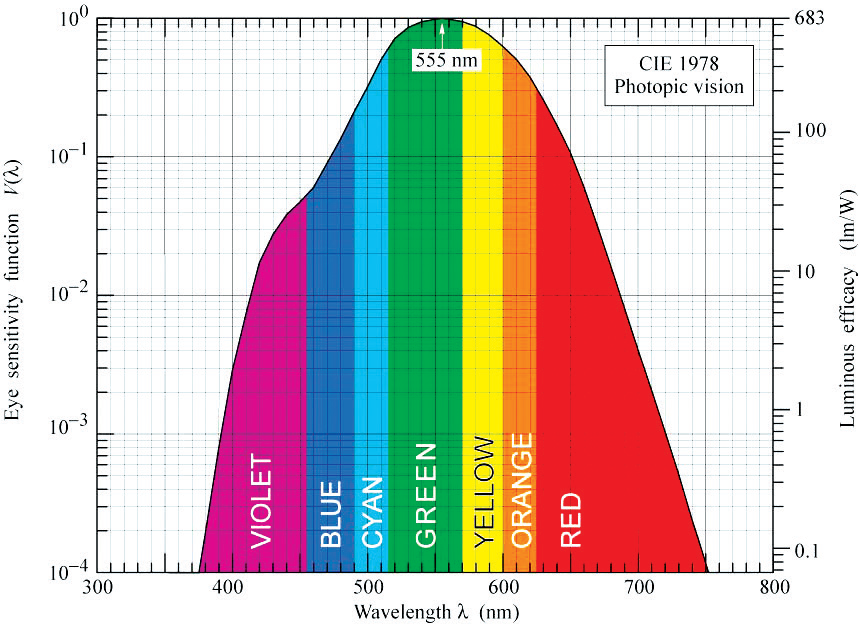
Seeing the open, daylit interiors of the CalEarth SuperAdobe structures also brings to mind a problem witnessed in even traditional buildings: the inability of typical artificial lighting to either leverage, mimic, or complement (and possibly intentionally offset) the existing daylight that enters a room. Often the rooms with the most daylight suffer from unattractive contrasts between the artificial source and the incoming light, while also failing to provide efficiencies that might be available could the light output be modified based upon a target light level. At the same time, rooms cut off from daylight often present stark color differences when viewed from rooms lit from different sources. Though such contrasting scenarios may be intentionally selected for should color temperature maintenance be prioritized over daylight matching, the fact is that few systems actually achieve either result as they fail to account for the effective color temperature of the ambient light received vs. the color temperature output by the light source.
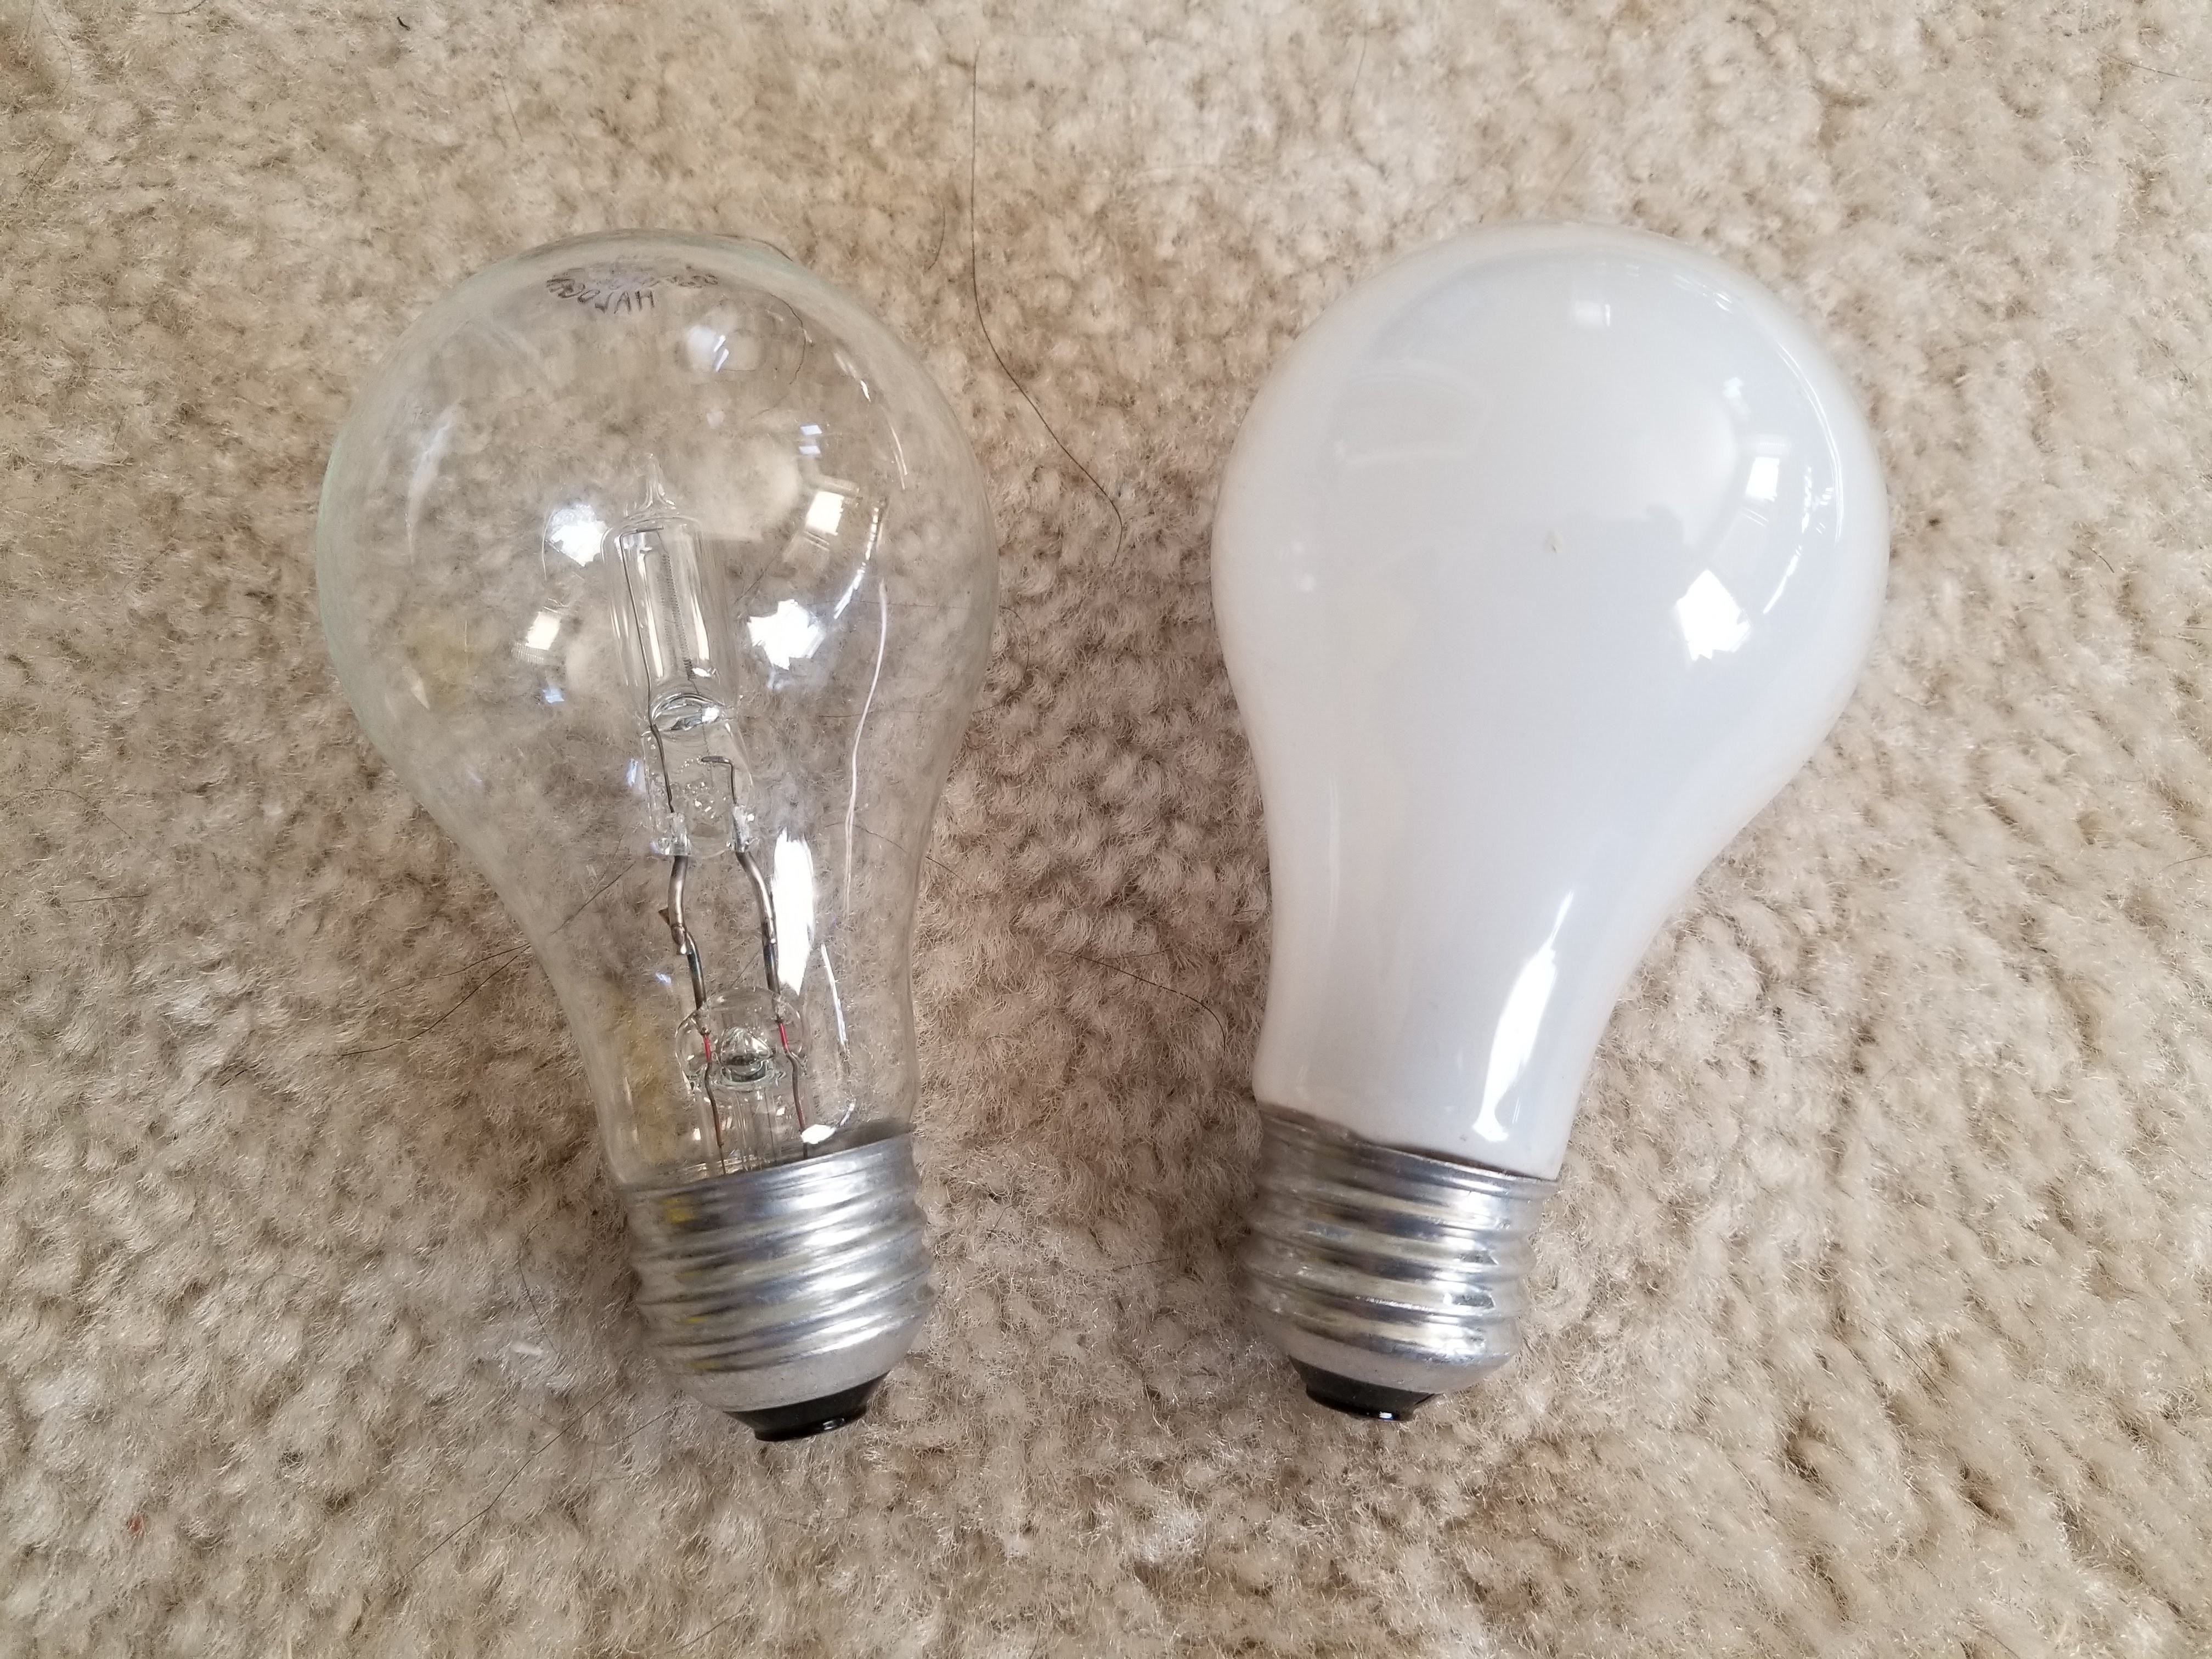
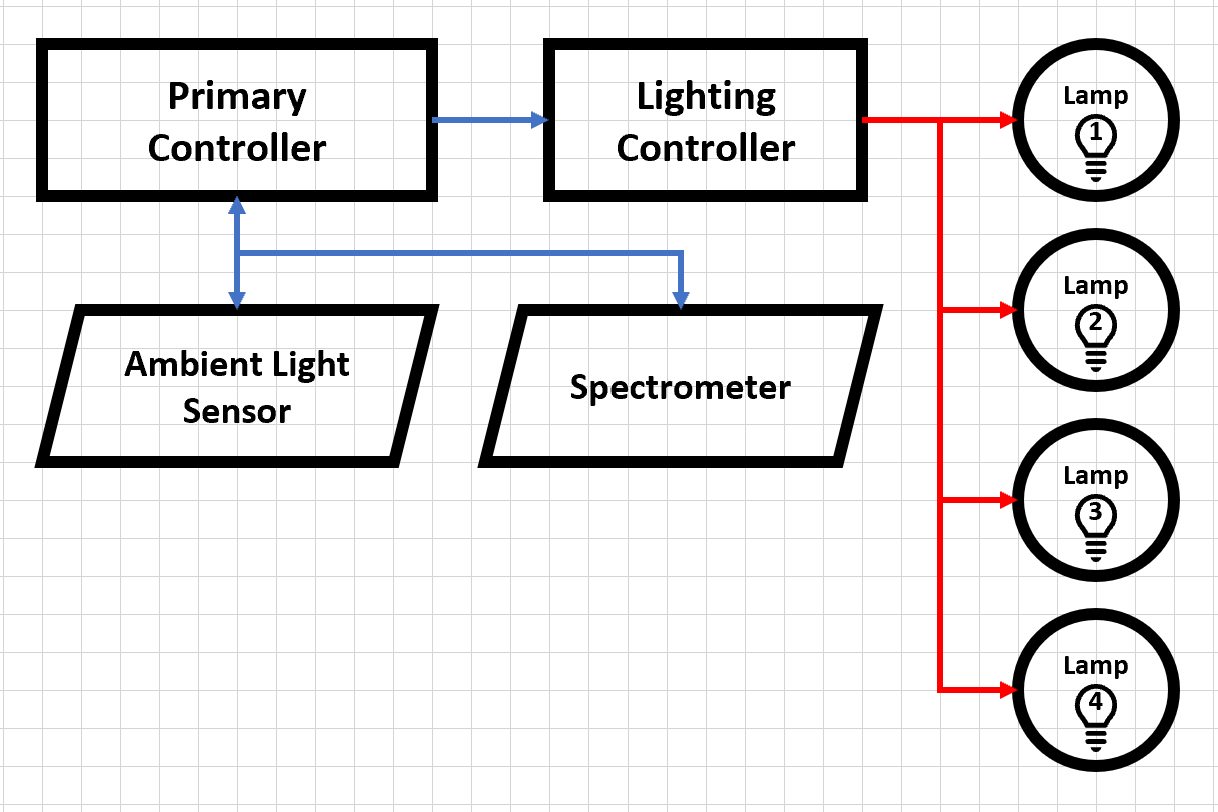
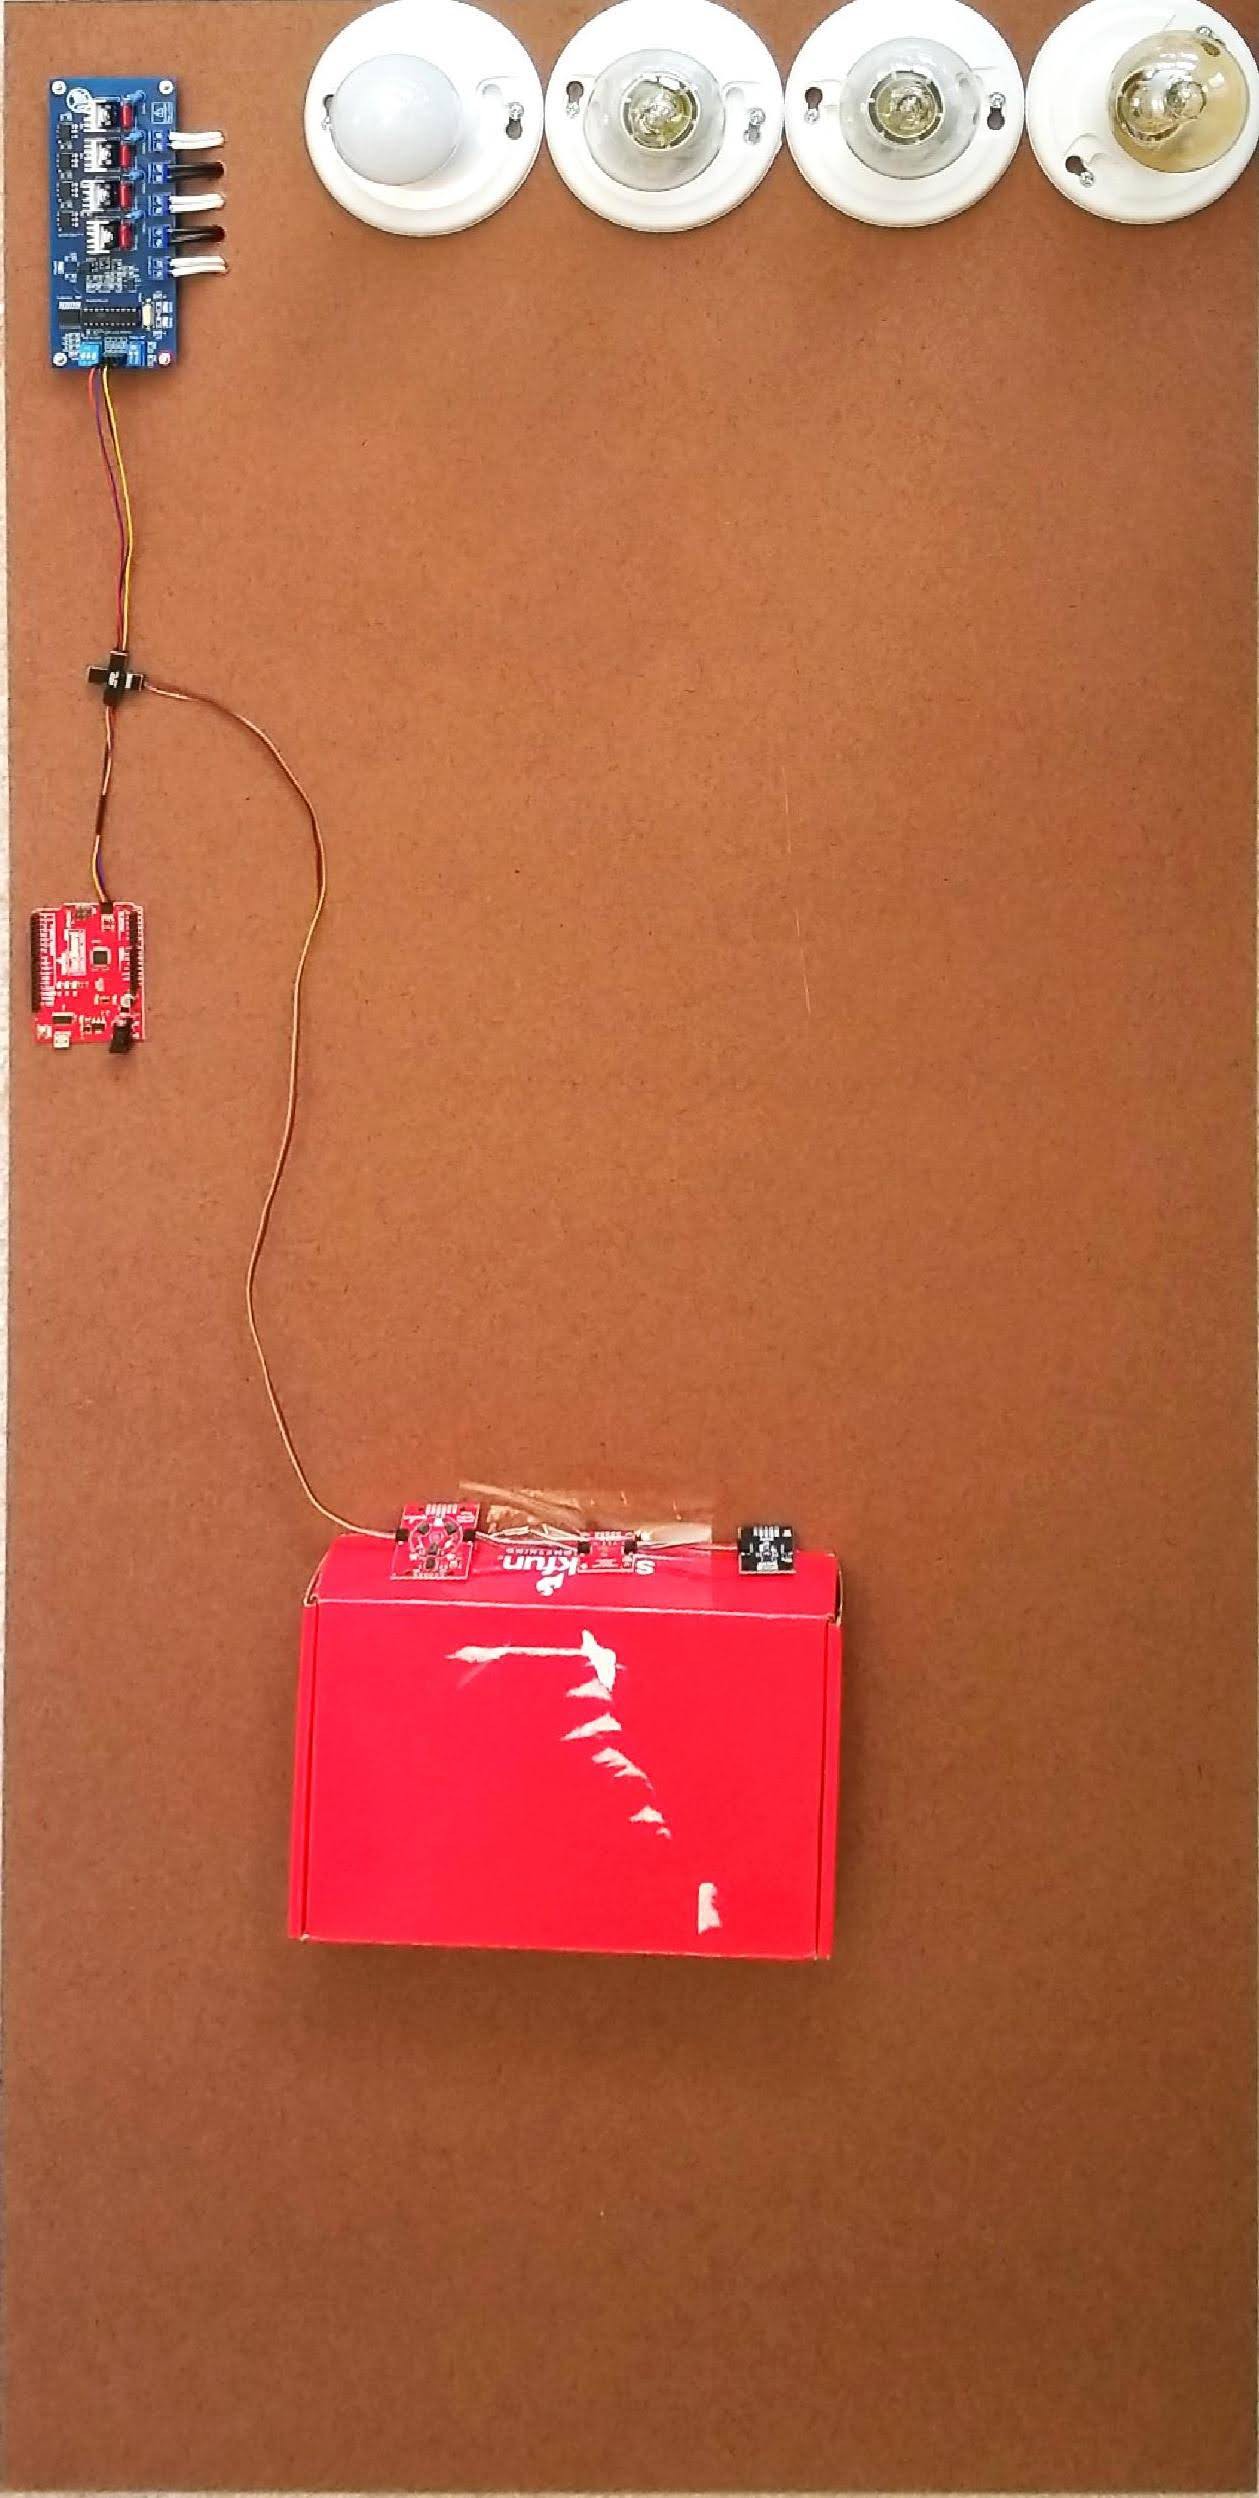
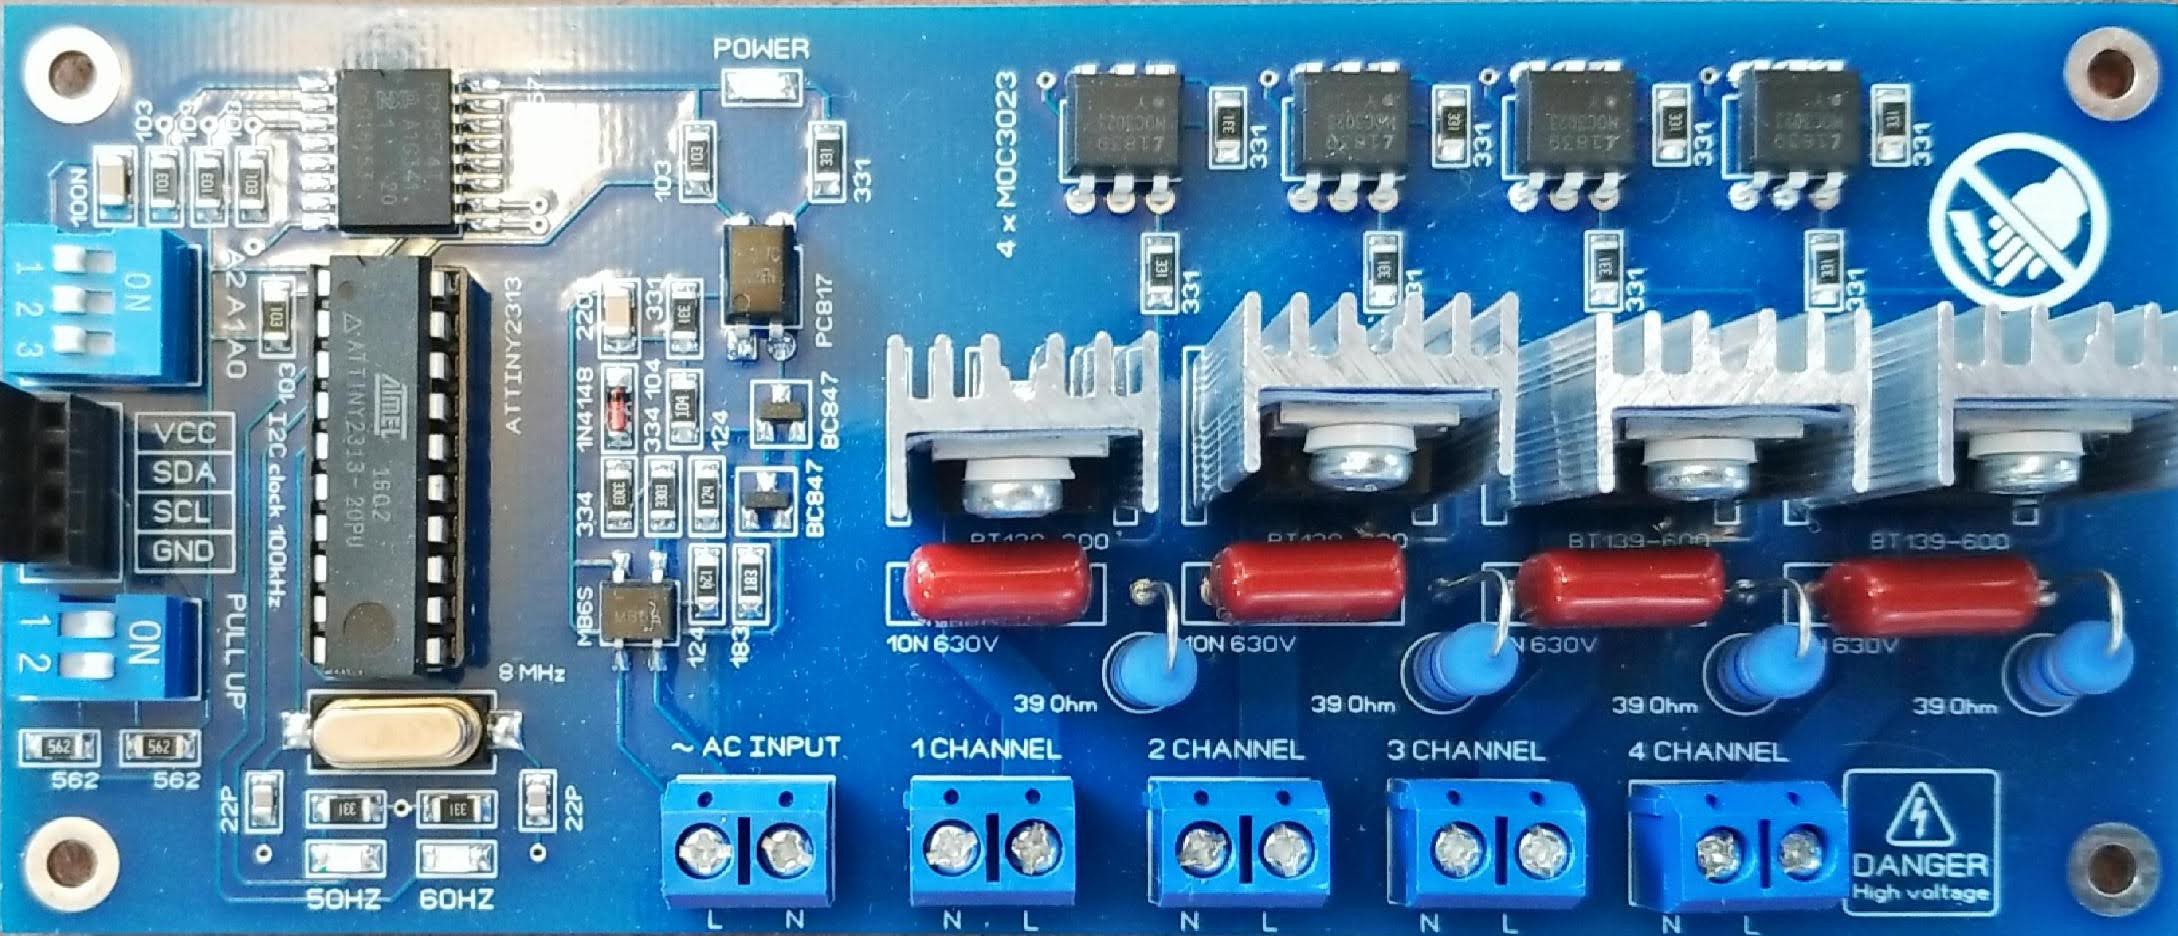
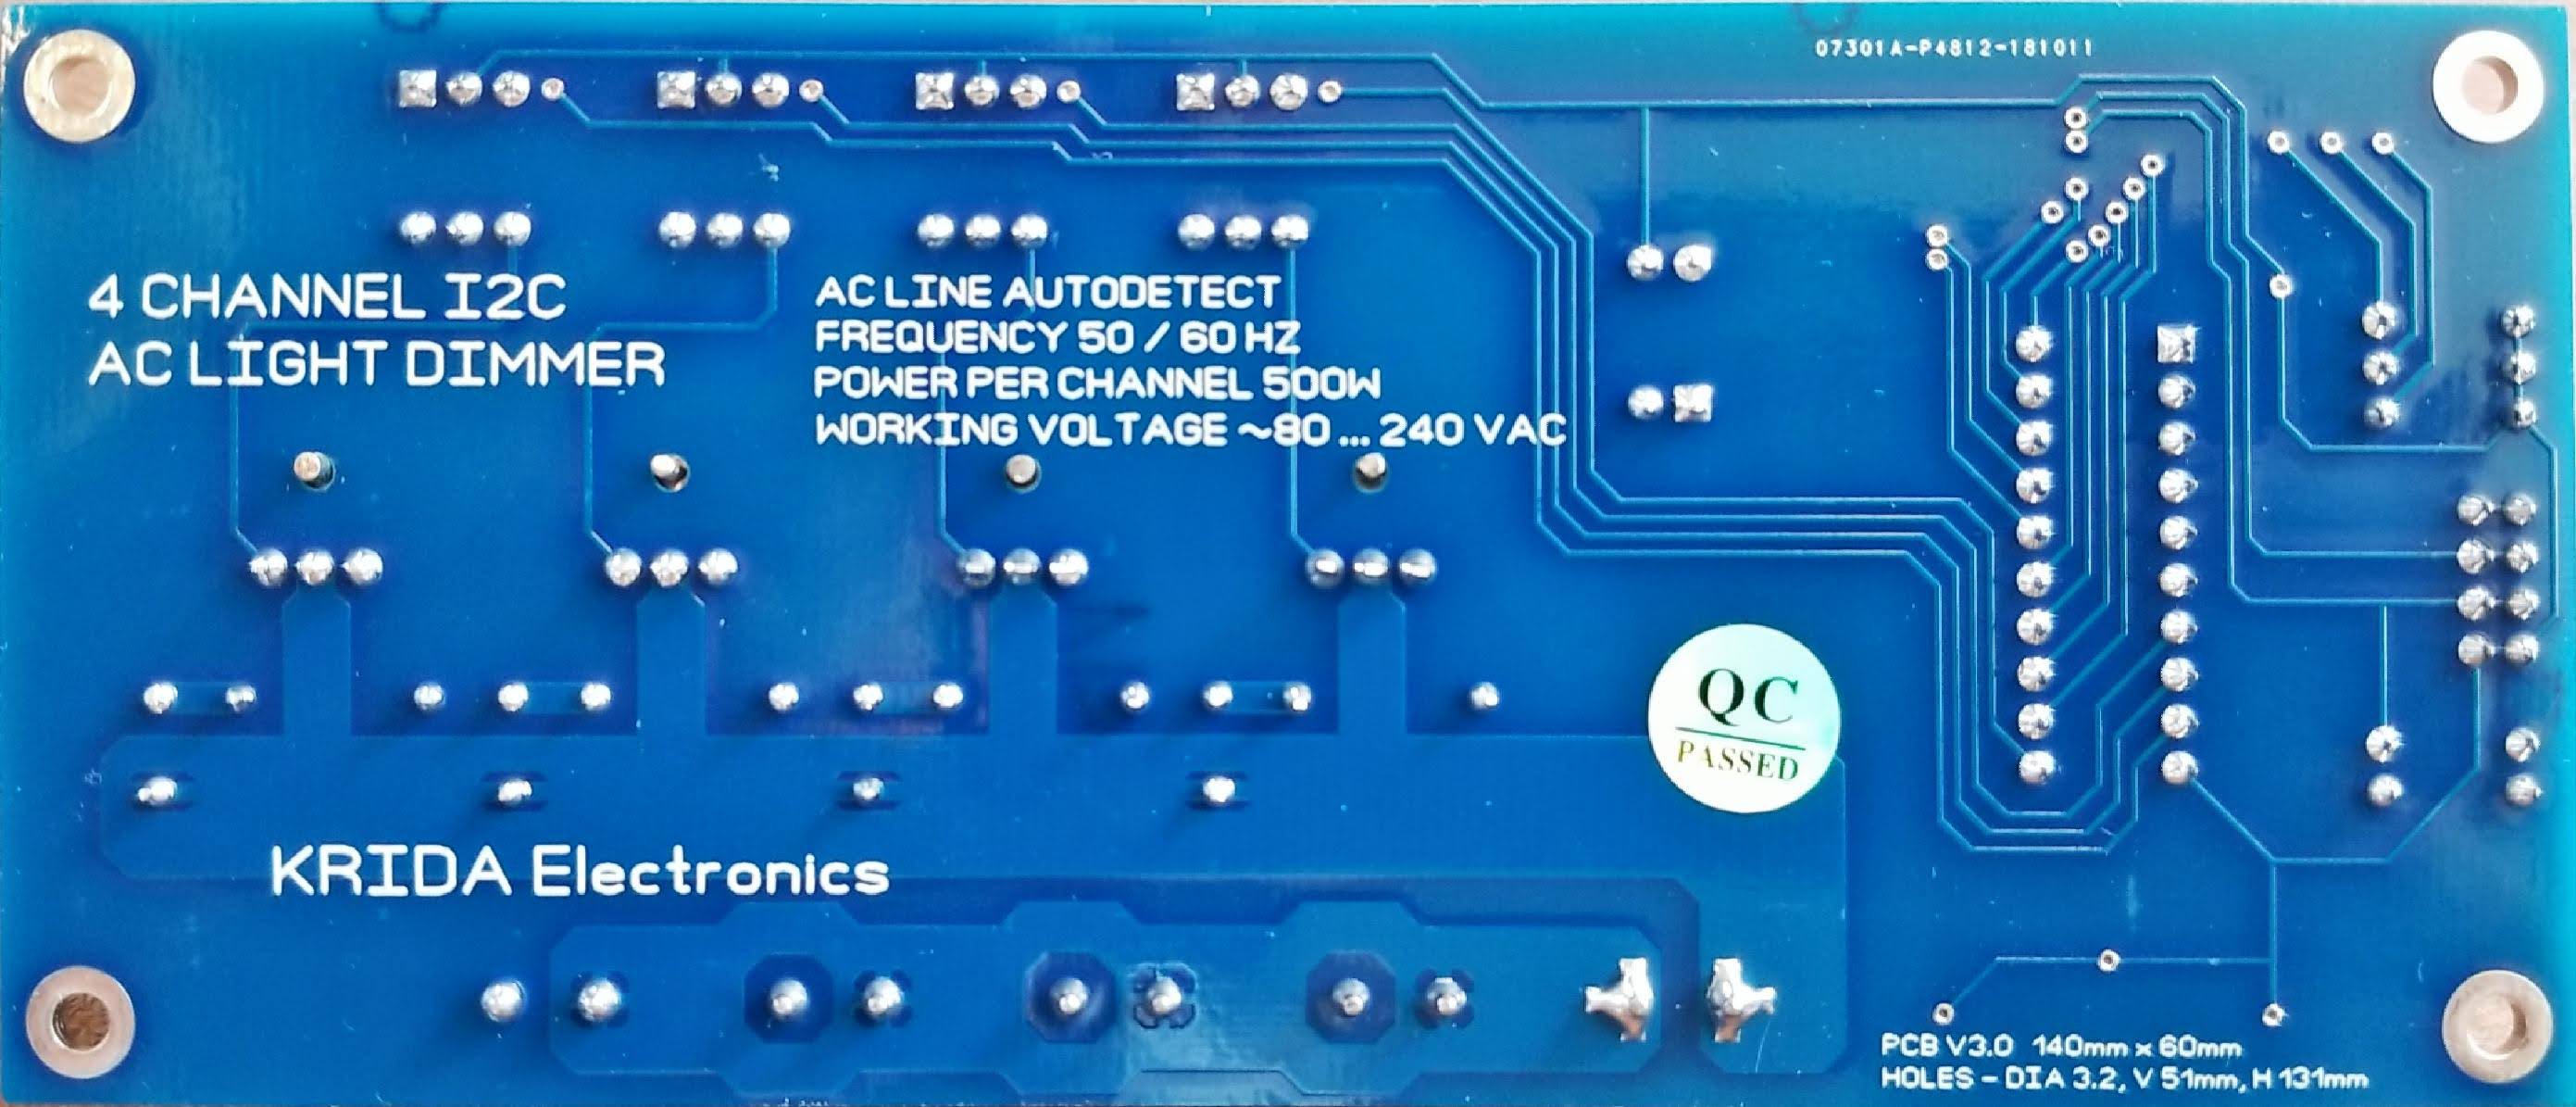
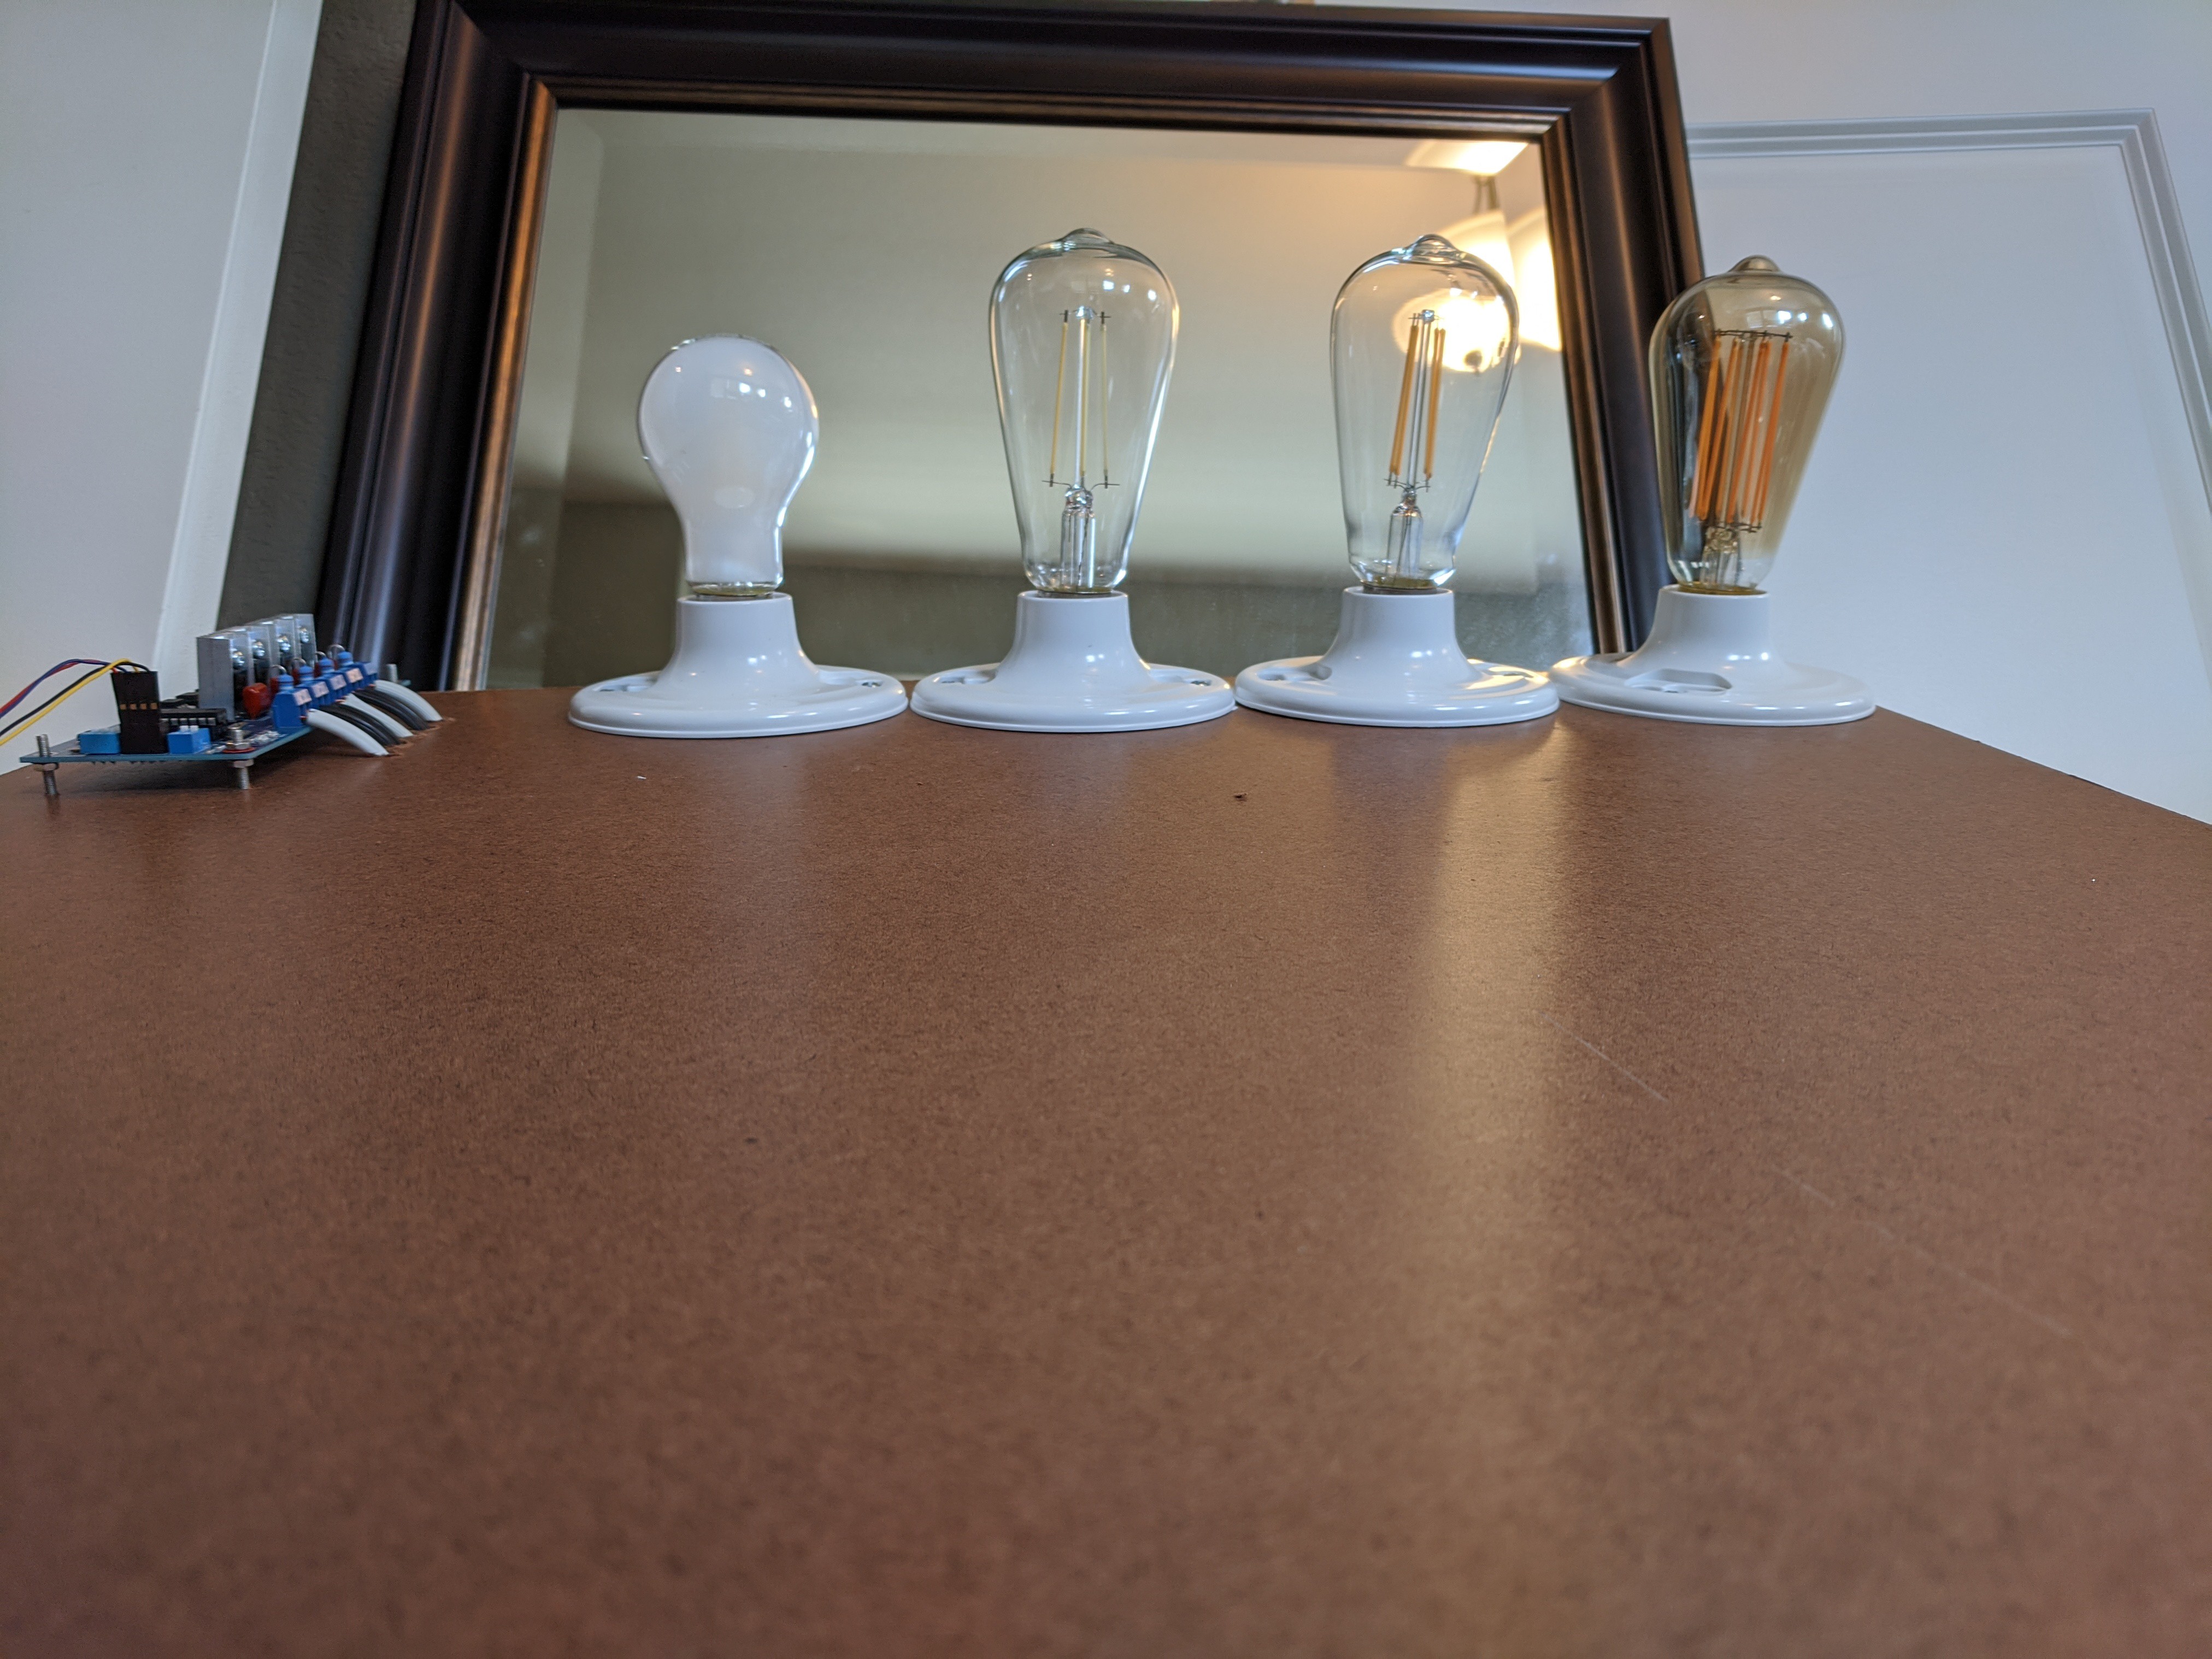
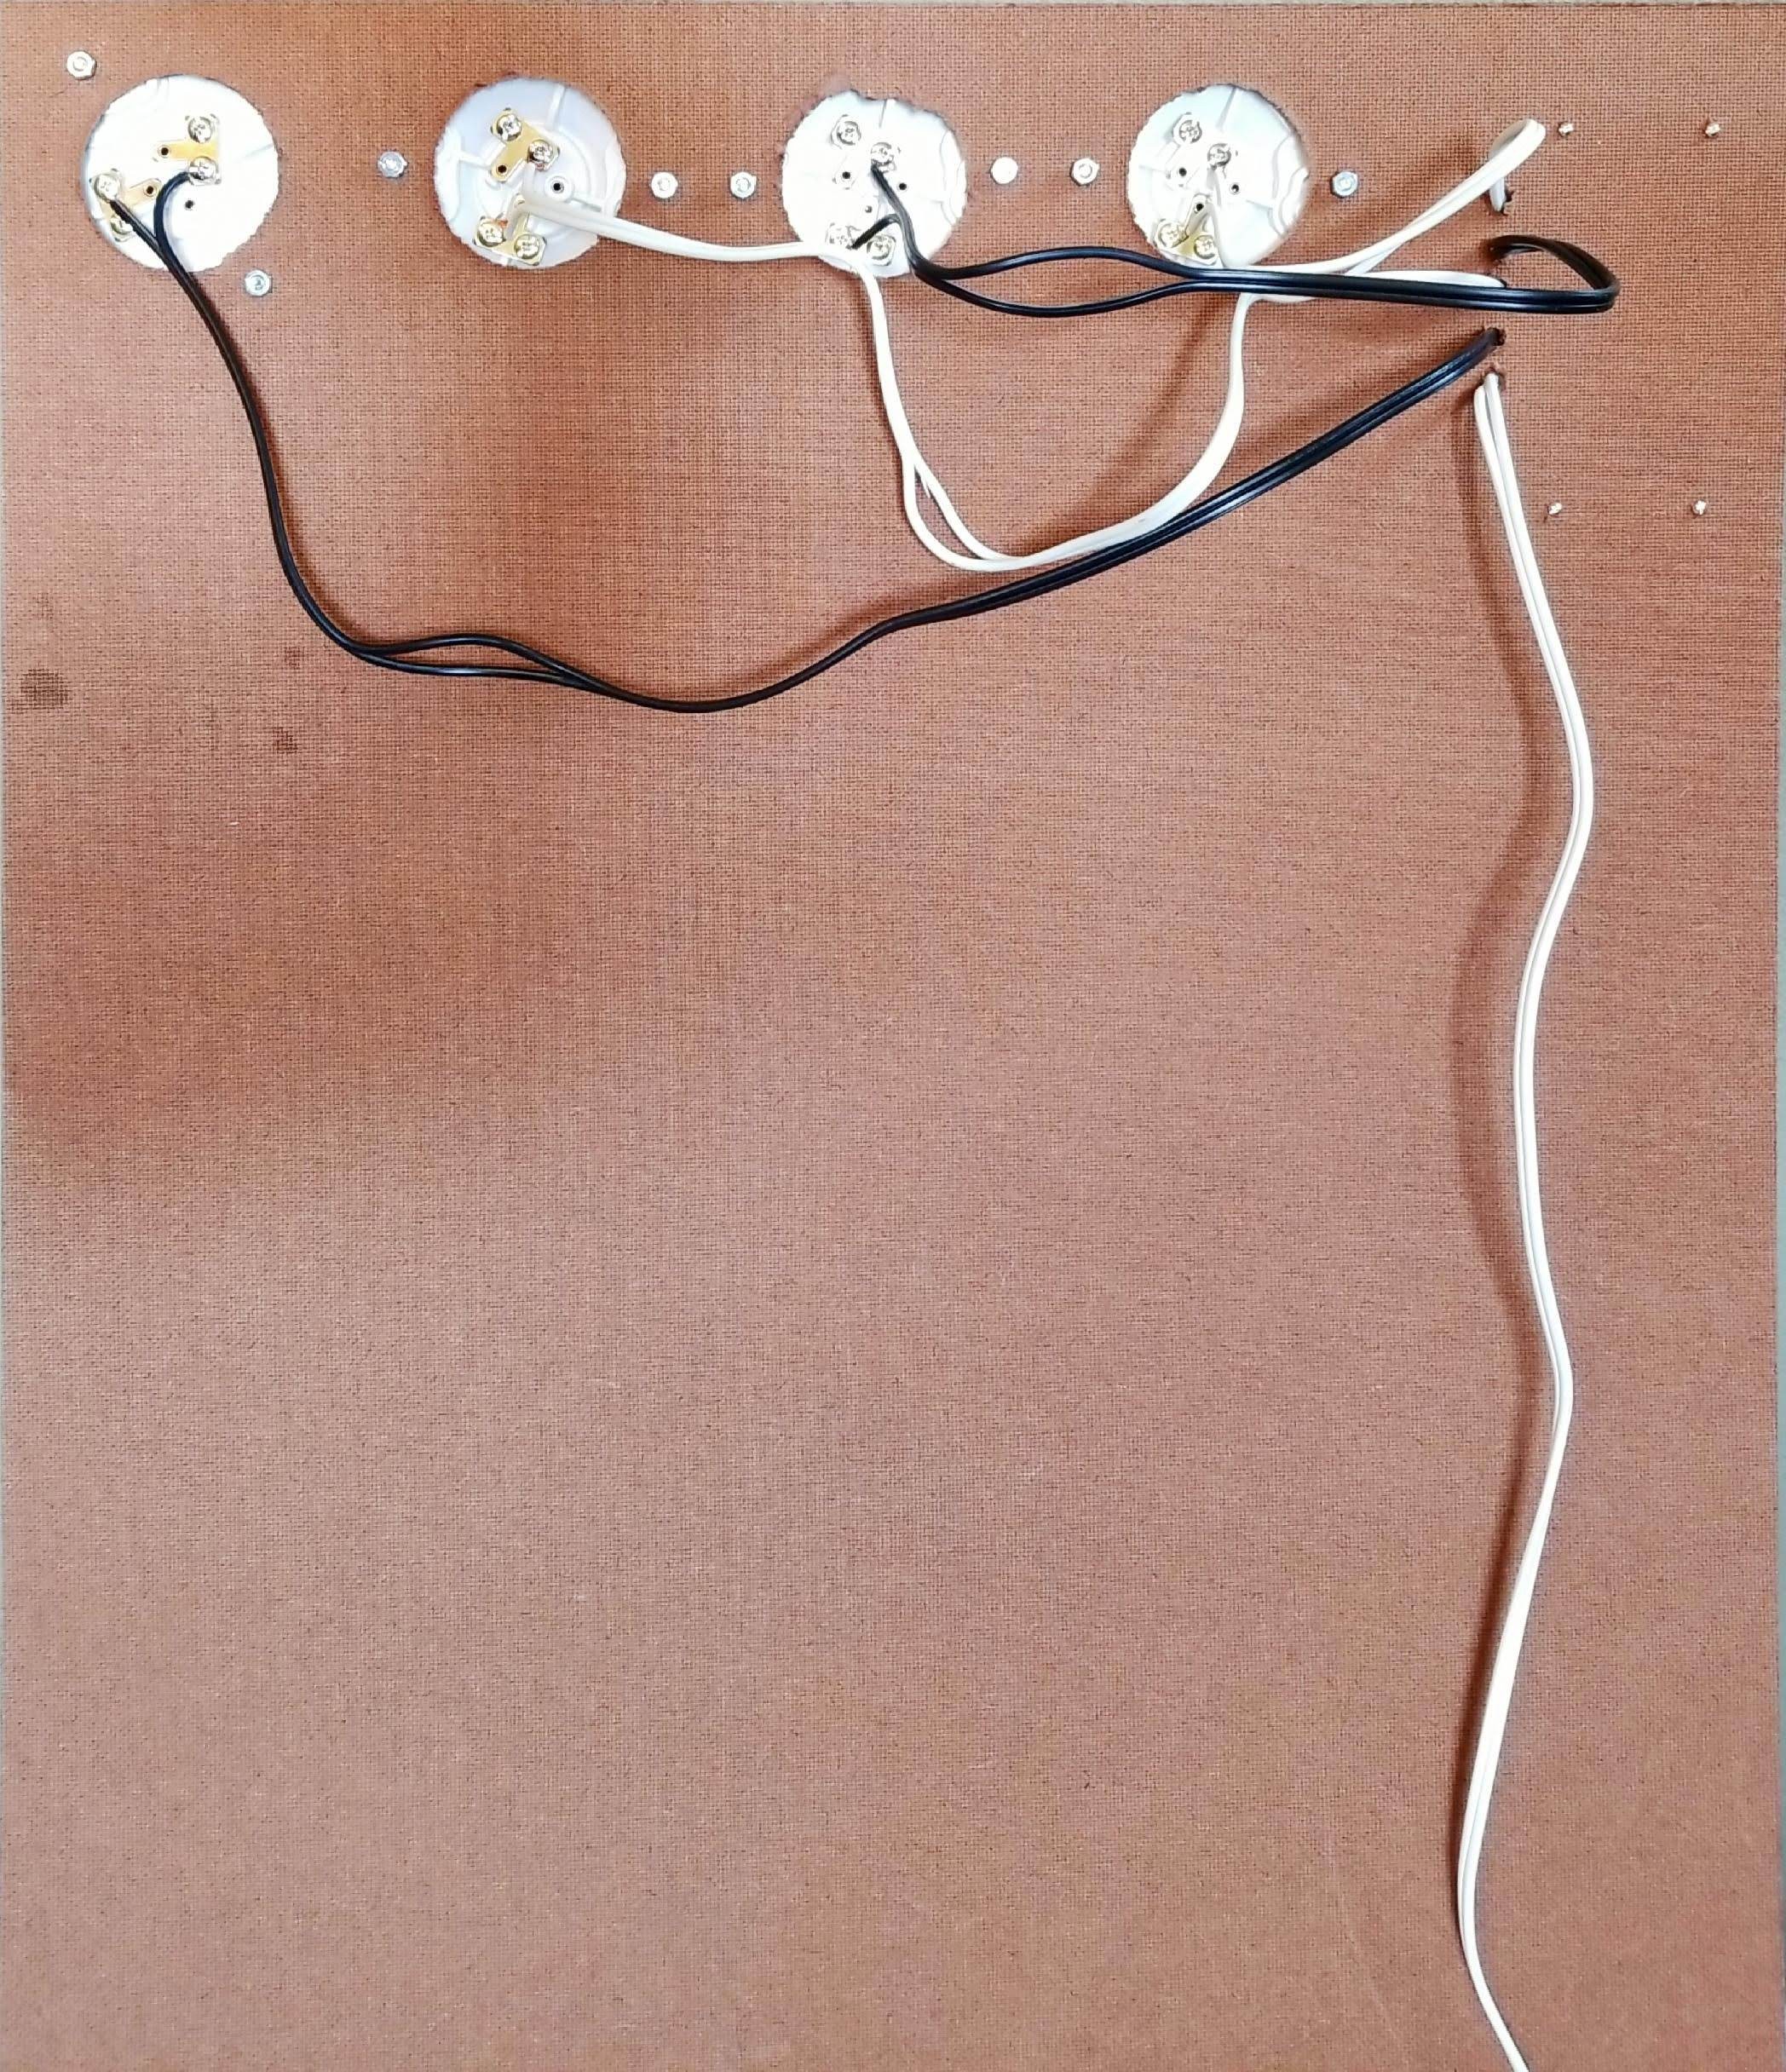
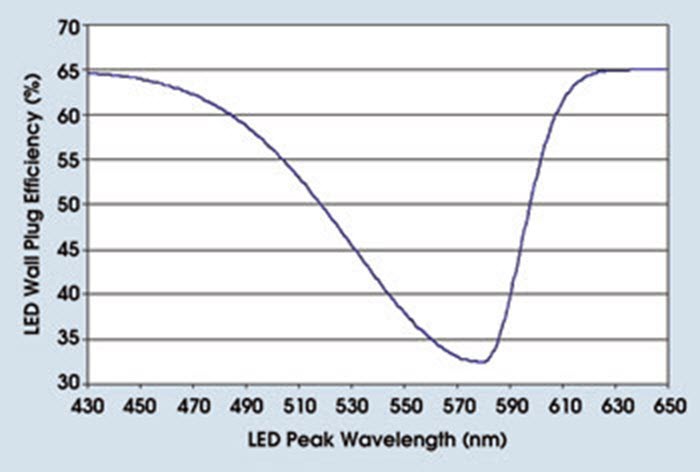
Additionally, a key design goal will be to use traditional household lamps as the primary source. Rather than integrating a DC LED light source, modular screw-in lamps will be used allowing for a system whose color temperature range and output brightness are all modular and extremely flexible (while demanding that associated AC controller circuitry be incorporated).
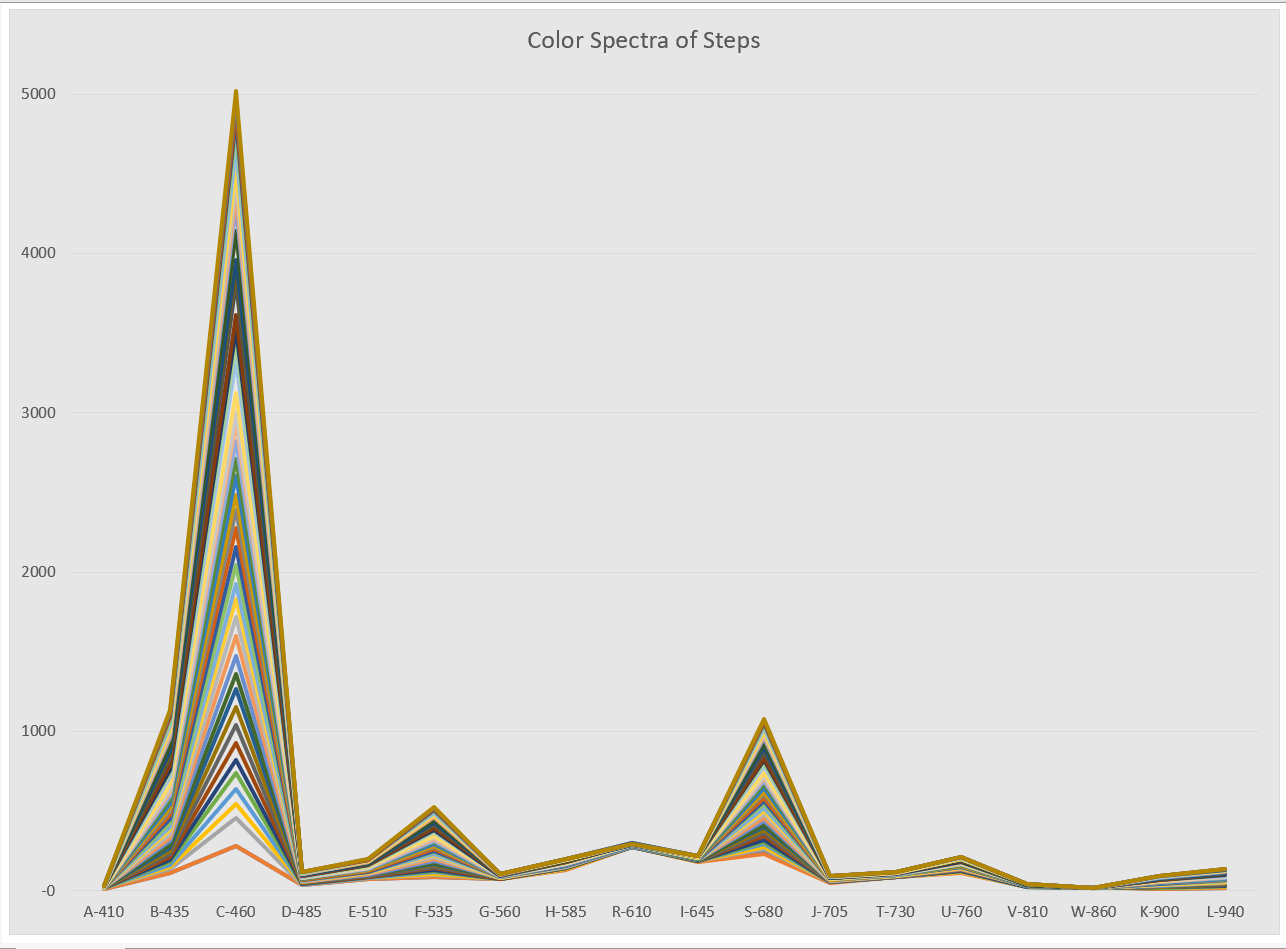
As used in many a smartphone, television and computer monitor, an RGB sensor and ambient light sensor will provide light output and color temperature readings, respectively. A spectrometer will be used to provide deeper insights into the quality of light being generated with the hopes that enough insights might be gained to make this component an operational part of the lighting control system.
An obvious success marker will be the ability to perform fine color temperature controls at given lighting levels. However, in the long term the team hopes to inspire more lighting projects which boldly consider traditional AC-based lamps as their output source.


 John Fu
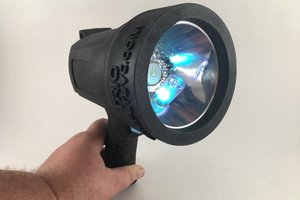
 Josh Starnes
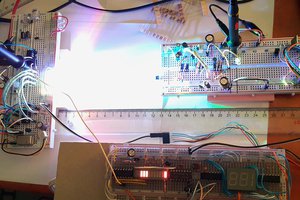
 Jovan
Jovan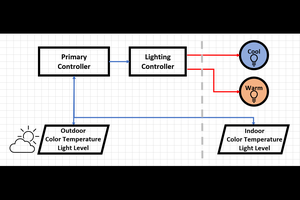
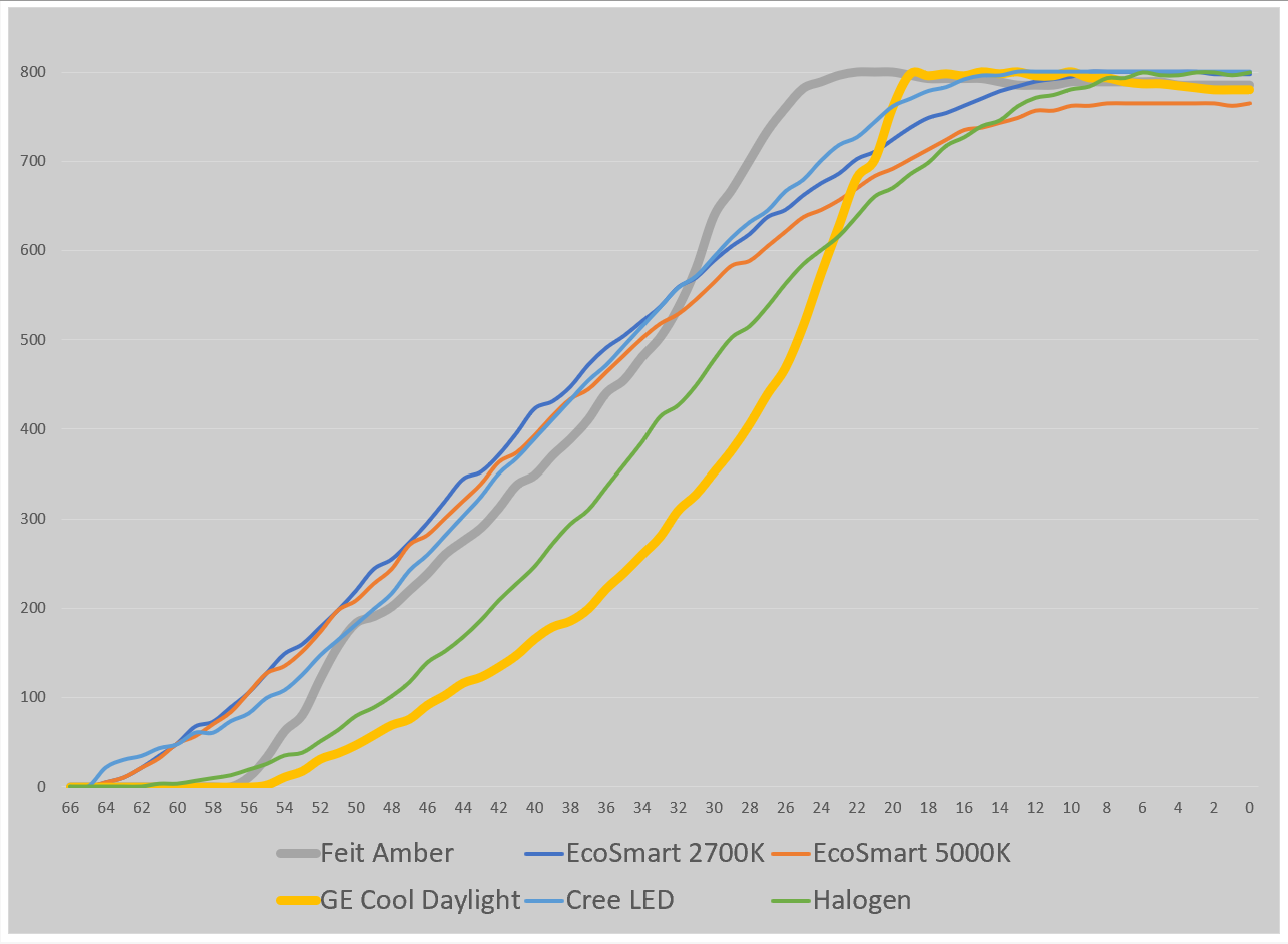
Controller error is a 6 bit rollover on some counter... 2^6 is 64... if they started counting with 1 instead of Zero, they get 65 instead of 64. Then the counter rolls over at 66... which is the same as Zero again. As you say, you can catch it in software.