 Mayke
MaykeThe idea of having an imaging fluorometer at home takes to a complete new level those of us with a keen eye for plants. Imagine, for instance, that you want to develop a more efficient LED lamp for your specialty crop, or that you are looking for ways to understand the underlying causes of stress under different external conditions such as lack of, or too much, humidity, extreme temperatures or lack of nutrients. But what does it make fluorescence to be above other well stablished techniques such as multispectral or hyper spectral imaging and/or ground sensors?
In order to answer the above question, we would have to lay some of the fundamentals about fluorescence first.
When photons reach the surface of a plant, they make the molecules of chlorophyll to get 'excited'. Literally, excitation means that the molecules absorb electromagnetic radiation from the UV-visible range of light, making the electrons to jump from a ground energy state to a higher energy state (See image below). Now, classical biology tells us that those ‘excited’ electrons will travel through other nearby Chl molecules by virtue of FRET (Föster Resonance Energy Transfer) until they reach the Holy Grail of the Light Dependent Reactions, that is, the Reaction Centre (CR), where they will finally get knocked off from the Chl molecules and transferred to the acceptor Plastoquinone. Let us bear in mind that Chlorophyll has two major absorption bands and therefore, it has two different energy levels other than ground: 1st excited singlet state (occasioned by red light absorption), and 2nd excited singlet state (a higher energy level attained from absorbing blue light, which is more energy intensive).
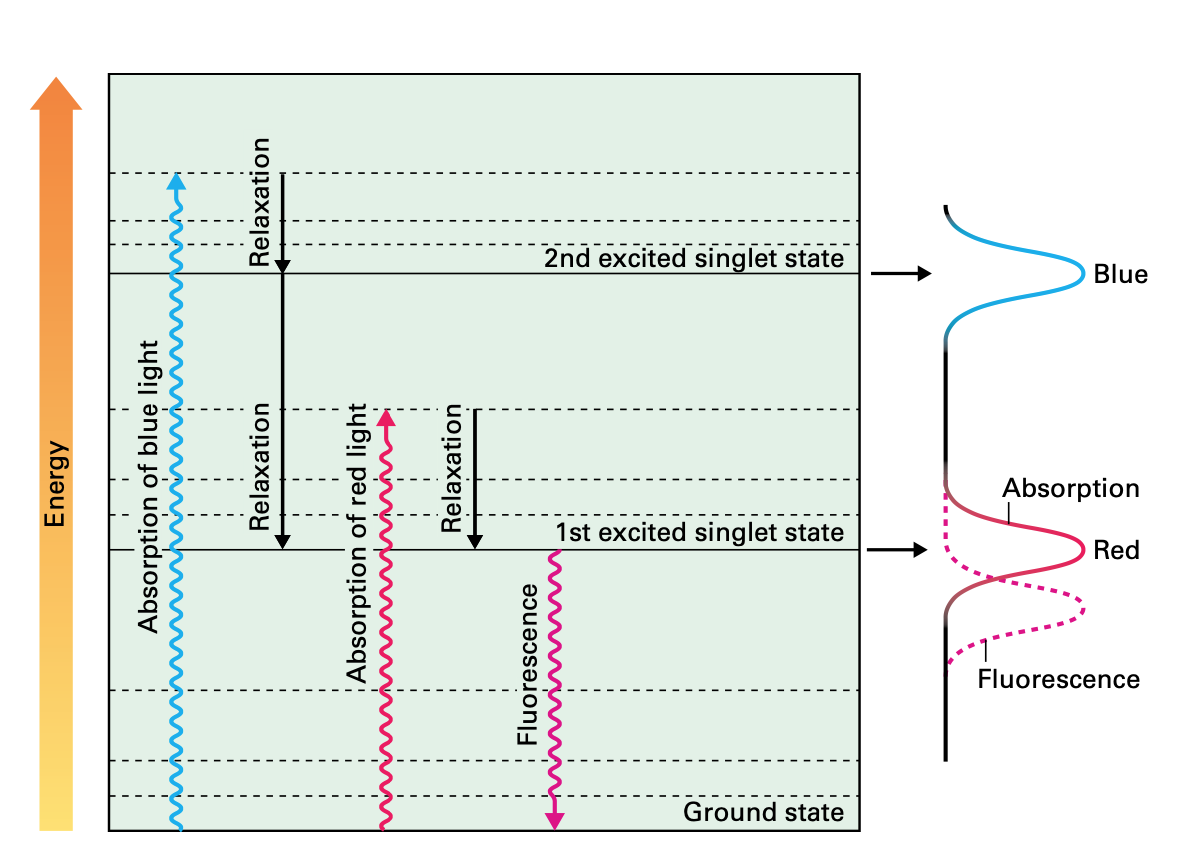
During this process, some of the energy produced by the excited molecules will necessarily be lost; as is the case when the amount of energy absorbed by Chl molecules exceeds the light utilisation of photosynthesis; such excess of energy is dissipated as heat as part of the Chl molecules returning to their ground state. Heat dissipation is always the result of vibrational relaxations that arise from the second excited singlet state. This photo-protective process is called Non Photochemical Quenching (NPQ).
But heat dissipation is not the only way in which a Chl molecule can return to the ground state. Another mechanism involves the emission of a photon while the Chl molecule decays to ground state. Such emission is the result of decay from the first singlet state, and it has a longer wavelength (it will always be in the red portion of the visible spectrum) than the absorbed light. This final process is called fluorescence.
Now, the three processes, electron transfer, heat dissipation and fluorescence, occur against one another, which means that out of 100% of energy being captured by the Ch molecules, more or less 80% will be transferred to the RCs, around 18% will be dissipated as heat, and around 2% will be release as fluorescence. Any increment in any single one of them will mean a reduction in the other two.
The above has huge implications when studying plants, for one thing is to measure external factors such as light intensity, humidity levels or nutrient content, and another one completely different is to be able to know exactly how many electrons are being used by a plant to sustain glucose production. At the heart of measuring Chlorophyll fluorescence is the examination of photosynthesis performance, the single most important process occurring inside a plant.
Kautsky & Hirsch Effect
In the early 1930s Professor Hans Kautsky and his collaborator A. Hirsch observed an increase of fluorescence intensity when dark adapted photosynthetically active samplea were illuminated. They published their discovery in Naturwissenschaften with the title Neue Versuche zur Kohlensäureassimilation (New Experiments on Carbon Dioxide Assimilation).
The immediate conclusion of the authors was that Chl fluorescence rises rapidly to a maximum, then declines to finally reach a steady level within minutes (I would say seconds in fact, see video below). Furthermore, such decline was found to be inversely correlated with the increase in the rate of CO2 assimilation. After that experiment and the consequent publication, everyone went down the rabbit hole.
The Basics of Fluorescence Measurements
As explained above, the excited electrons need to reach the Reaction Centres in order to be transferred to the Calvin cycle via the acceptor Plastoquinone. But, as the plant has been dark-adapted, the enzymes responsible for driving the whole cycle are not 'activated', which means that the first electrons reaching the plastoquinone acceptor will effectively close the reaction centres. That is, no other electrons will be accepted until the enzymes are progressively activated by light and the electron transfer can occur. We can safely say that the plant is in 'sleep' mode. That in turn means that all the electrons that are not transferred will have to be dissipated or 'burnt' in order to prevent tissue damage. Therefore, Chl fluorescence rises rapidly, along with a massive increase in heat dissipation. Once the enzymes start progressively to activate, more and more reaction centres will then open, allowing the electron transfer to occur and both heat dissipation and Chl fluorescence decline until reaching a steady level.
All the above sounds fine and exciting but, can we gain any practical knowledge from it? The answer is yes, but in order to gain such useful knowledge, we need to separate both photochemical and non-photochemical quenching. Remember that any increase or decrease in one of the factors (electron transfer, heat or fluorescence) will directly affect the other two. So the trick of any fluorescence measurement is to be able to close, or reduce to almost zero, two of the processes, so the one left can be estimated. The most common way of doing this is by preventing the occurrence of photochemical and non-photochemical quenching, by using a short pulse of light. The pulse needs to be very short (no more than half a second) and very strong, preferably in the order of +4,000 μmol·m-2·s-1. The light pulse will be too short to enable any electron transport or heat dissipation, and in the absence of both, the maximum level of fluorescence can be determined.
But if we are to measure the maximum level of fluorescence, we also need to measure a baseline, or minimum level. Ideally, the minimum level of Fluorescence is measure by switching a light that is way too weak for any photosynthesis-related process to occur. That is achieved by making sure that the Measuring Light (ML) does not exceeds 1 μmol·m-2·s-1.
Once we have measured the minimum and the maximum levels of Chl fluorescence, we also need to measure the yield of Chl fluorescence during light conditions; that is, in the presence of both photochemical and non-photochemical quenching. Below you can see a typical fluorescence measuring technique:
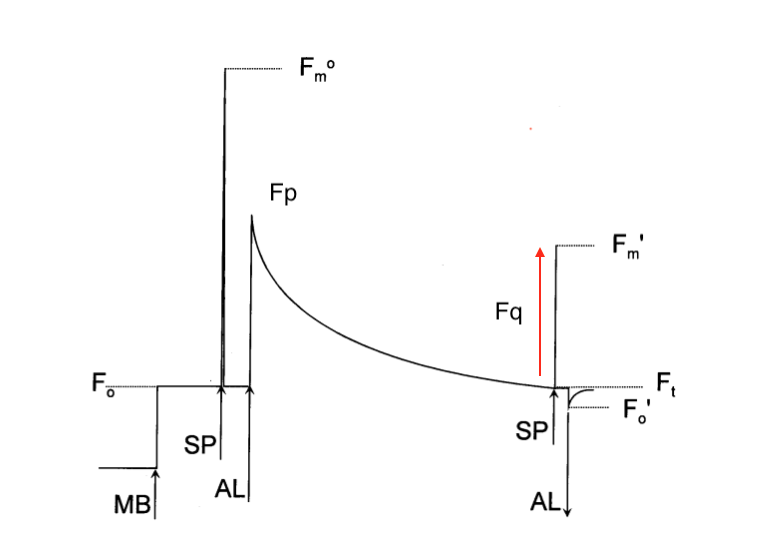
Three types of illumination are used in the experiment above:
- Measuring Light (ML) or MB: 1 μmol·m-2·s-1
- Saturating Pulse (SP): Over 4,000 μmol·m-2·s-1
- Actinic Light (AL): Usually at steady 600 μmol·m-2·s-1
The terminology used for the measurements as follows:
- Fo: Minimum level of Fluorescence attained by switching on ML.
- Fom: Maximum level of Fluorescence attained by applying SP.
- Fp: Maximum level of Fluorescence attained in the presence of PQ and NPQ immediately after switching AL on.
- F’m: Maximum level of Fluorescence attained while applying SP in the presence of PQ and NPQ.
- Ft: The level of Fluorescence immediately before applying the SP while the AL is on.
- F’o: Minimum level of Fluorescence after switching off AL (preferably applying far-red light simultaneously).
The most common used parameters used in Fluorescence measurements are detailed as follows:
Photochemical Quenching Equation
- 𝚽PSII: The quantum yield of Photosystem II. (F’m - Ft) / F’m
- qP: Proportion of open PSII. (F’m - Ft) / (F’m - F’o)
- Fv/Fm: Maximum quantum yield of PSII. (Fm - Fo) /Fm
Non Photochemical Quenching Equation
- NPQ: Non-Photochemical Quenching. (Fom - F’m) / F’m
From 𝚽PSII we can extract even more useful information about the Photochemical processes; for example:
Equation
Linear Electron Transport Rate (J) or ETR: J = 𝚽PSII X PFDa X (0.5)
Where PFDa is absorbed light in μmol·m-2·s-1, and 0.5 the factor that accounts for the energy partition between PSI and PSII.
Another very important parameter for us will be Fv/Fm since this parameter reflects the potential quantum efficiency of PSII and it's used as an indicator of photosynthesis performance, with an optimal value of 0.83 across species.
Project Aims
This project will seek to reproduce the fluorescence trace of the image above and calculate Electron Transport Rate (ETR) values, as well as Fv/Fm using the DIY equipment listed in the following sections.
DISCLAIMER:
You will find an incredible amount of formulas and different references in the literature about Chl Fluorescence. As a matter of fact, it took me quite some time to make sense of most formulas and filter out confusing/contradicting statements and or results. I have settle for a very old paper as the basic for the formulas above (Maxwell & Johnson (2000)) because is one of the less confusing of all. The only caveat is that the trace and nomenclature could have benefitted from more detail, but compare to other papers I have read, is amazingly readable.
Also, this is not a guide about Photosynthesis. I am barely scratching the surface by narrowly focusing on the light reactions.
If you are curious about the literature I have used, I can happily provide a bibliography (Do not expect it in Zotero style). If you need a copy of any of these papers, please request it in the comments section. Be mindful of Intellectual Property Rights.
Lastly, I am not claiming that anything written here is the final truth about Chl fluorescence. I am not biologist and I am not claiming to be one. My understanding of Physics and Chemistry is average. If you spot any mistake or error please do let me know and I will happily correct it.
Please follow the logs for updated information, and thanks for reading.